Looking Glass River Watershed Management Plan - Greater ...
Looking Glass River Watershed Management Plan - Greater ... Looking Glass River Watershed Management Plan - Greater ...
Volunteers identify the species based on their breeding season call or songs and determine the abundance of each species using a call index of 1 (1-5 individuals), 2 (6-12 individuals) & 3 (unable to count individuals). In the Tri-County area, anuran species include the Wood Frog, Western Chorus Frog, Spring Peeper, Northern Leopard Frog, American Toad, Gray Tree Frog, and Green Frog. Volunteers are unable to observe the other species shown in Figure 3-6 because they are primarily found along the lake shore, in the Upper Peninsula, or their population is declining in Michigan. Volunteers monitored the frogs and toads primarily in Watertown Township and Meridian Township. Approximately 4 sections within the Looking Glass River Watershed were surveyed by 12 volunteers. Tri-County area data from the frog and toad surveys are available from the MDNR going back to 1996. Figure 3-6 Calling Calendar for Frogs and Toads in Michigan Section 3: Water Quality Conditions 3-17
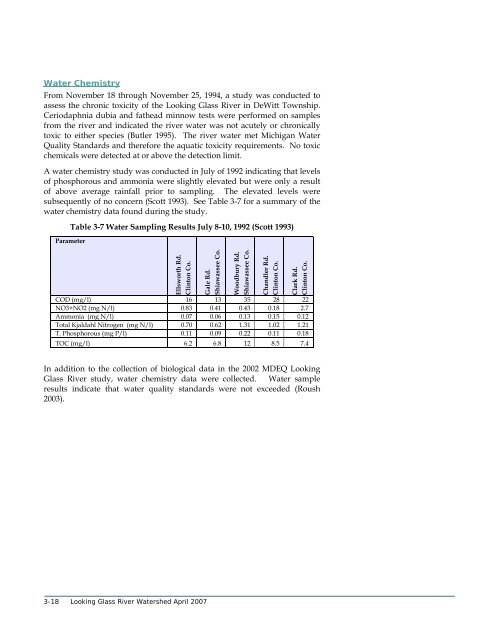
Water Chemistry From November 18 through November 25, 1994, a study was conducted to assess the chronic toxicity of the Looking Glass River in DeWitt Township. Ceriodaphnia dubia and fathead minnow tests were performed on samples from the river and indicated the river water was not acutely or chronically toxic to either species (Butler 1995). The river water met Michigan Water Quality Standards and therefore the aquatic toxicity requirements. No toxic chemicals were detected at or above the detection limit. A water chemistry study was conducted in July of 1992 indicating that levels of phosphorous and ammonia were slightly elevated but were only a result of above average rainfall prior to sampling. The elevated levels were subsequently of no concern (Scott 1993). See Table 3-7 for a summary of the water chemistry data found during the study. Table 3-7 Water Sampling Results July 8-10, 1992 (Scott 1993) Parameter Ellsworth Rd. Clinton Co. Gale Rd. Shiawassee Co. Woodbury Rd. Shiawassee Co. Chandler Rd. Clinton Co. Clark Rd. Clinton Co. COD (mg/l) 16 13 35 28 22 NO3+NO2 (mg N/l) 0.83 0.41 0.43 0.18 2.7 Ammonia (mg N/l) 0.07 0.06 0.13 0.15 0.12 Total Kjaldahl Nitrogen (mg N/l) 0.70 0.62 1.31 1.02 1.21 T. Phosphorous (mg P/l) 0.11 0.09 0.22 0.11 0.18 TOC (mg/l) 6.2 6.8 12 8.5 7.4 In addition to the collection of biological data in the 2002 MDEQ Looking Glass River study, water chemistry data were collected. Water sample results indicate that water quality standards were not exceeded (Roush 2003). 3-18 Looking Glass River Watershed April 2007
- Page 8 and 9: SECTION 10 - Plan Sustainability In
- Page 10 and 11: FIGURES Figure 1-1 Watershed Locati
- Page 12 and 13: Organization of the Plan This plan
- Page 14 and 15: 9. Evaluation and Revision Section
- Page 16 and 17: ! ! ! ! ! ! Forest Hill ! ! ! ! ! !
- Page 18 and 19: The goals and objectives were then
- Page 20 and 21: Looking Glass Watershed The Looking
- Page 22 and 23: • methods for evaluation of progr
- Page 24 and 25: References Center for Watershed Pro
- Page 26 and 27: ! ! ! ! ! ! ! ! ! ! ! ! ! ! ! ! ! !
- Page 28 and 29: ! ! ! ! ! ! ! ! ! ! ! ! ! ! ! ! ! !
- Page 30 and 31: ! ! ! ! ! ! ! ! ! ! ! ! ! ! ! ! ! !
- Page 32 and 33: The majority of wetlands in the wat
- Page 34 and 35: commonly classified as hydrologic s
- Page 36 and 37: ! ! ! ! ! ! ! ! ! ! ! ! ! ! ! ! ! !
- Page 38 and 39: Significant Natural Features to be
- Page 40 and 41: References Centers for Disease Cont
- Page 42 and 43: 3. Water Quality Conditions People
- Page 44 and 45: sanitary sewer treatment system has
- Page 46 and 47: Section 3: Water Quality Conditions
- Page 48 and 49: Data Analysis Tetra Tech summarized
- Page 50 and 51: ! ! ! ! ! ! Forest Hill ! ! ! ! ! !
- Page 52 and 53: ! ! ! ! ! ! Forest Hill ! ! ! ! ! !
- Page 54 and 55: Table 3-4 explains the problems fou
- Page 56 and 57: Vermillion Creek Assessment Vermill
- Page 60 and 61: Watershed Fish Consumption The Mich
- Page 62 and 63: The coldwater fishery use does not
- Page 64 and 65: ! ! ! ! ! ! ! ! ! ! ! ! ! ! ! ! ! !
- Page 66 and 67: Interpretation of Watershed Conditi
- Page 68 and 69: 4. Community Outreach A watershed p
- Page 70 and 71: Public Comment on Draft Plan A draf
- Page 72 and 73: Public Education Plan Public educat
- Page 74 and 75: determining goals and desires for t
- Page 76 and 77: Table 5-1 Status of Designated Uses
- Page 78 and 79: Sources The main sources of sedimen
- Page 80 and 81: the time for the specified month. (
- Page 82 and 83: Altered Hydrology Stream flows vary
- Page 84 and 85: day as it is at a USGS gauging stat
- Page 86 and 87: Figure 5-2 R-B Index at Eagle (USGS
- Page 88 and 89: It should also be noted that the su
- Page 90 and 91: Detergents are becoming a serious t
- Page 92 and 93: Physical Pollutants Physical pollut
- Page 94 and 95: Oil and grease are often referred t
- Page 96 and 97: Table 5-14 Pesticide: Sources and C
- Page 98 and 99: Introduction 6. Goals and Objective
- Page 100 and 101: equirements, some objectives go bey
- Page 102 and 103: Goal 3: Encourage Water Quality Fri
- Page 104 and 105: general health of wetlands, primary
- Page 106 and 107: References DAS Manufacturing. “Cu
Water Chemistry<br />
From November 18 through November 25, 1994, a study was conducted to<br />
assess the chronic toxicity of the <strong>Looking</strong> <strong>Glass</strong> <strong>River</strong> in DeWitt Township.<br />
Ceriodaphnia dubia and fathead minnow tests were performed on samples<br />
from the river and indicated the river water was not acutely or chronically<br />
toxic to either species (Butler 1995). The river water met Michigan Water<br />
Quality Standards and therefore the aquatic toxicity requirements. No toxic<br />
chemicals were detected at or above the detection limit.<br />
A water chemistry study was conducted in July of 1992 indicating that levels<br />
of phosphorous and ammonia were slightly elevated but were only a result<br />
of above average rainfall prior to sampling. The elevated levels were<br />
subsequently of no concern (Scott 1993). See Table 3-7 for a summary of the<br />
water chemistry data found during the study.<br />
Table 3-7 Water Sampling Results July 8-10, 1992 (Scott 1993)<br />
Parameter<br />
Ellsworth Rd.<br />
Clinton Co.<br />
Gale Rd.<br />
Shiawassee Co.<br />
Woodbury Rd.<br />
Shiawassee Co.<br />
Chandler Rd.<br />
Clinton Co.<br />
Clark Rd.<br />
Clinton Co.<br />
COD (mg/l) 16 13 35 28 22<br />
NO3+NO2 (mg N/l) 0.83 0.41 0.43 0.18 2.7<br />
Ammonia (mg N/l) 0.07 0.06 0.13 0.15 0.12<br />
Total Kjaldahl Nitrogen (mg N/l) 0.70 0.62 1.31 1.02 1.21<br />
T. Phosphorous (mg P/l) 0.11 0.09 0.22 0.11 0.18<br />
TOC (mg/l) 6.2 6.8 12 8.5 7.4<br />
In addition to the collection of biological data in the 2002 MDEQ <strong>Looking</strong><br />
<strong>Glass</strong> <strong>River</strong> study, water chemistry data were collected. Water sample<br />
results indicate that water quality standards were not exceeded (Roush<br />
2003).<br />
3-18 <strong>Looking</strong> <strong>Glass</strong> <strong>River</strong> <strong>Watershed</strong> April 2007


