Washington - Kansas City, Kansas Public Schools
Washington - Kansas City, Kansas Public Schools Washington - Kansas City, Kansas Public Schools
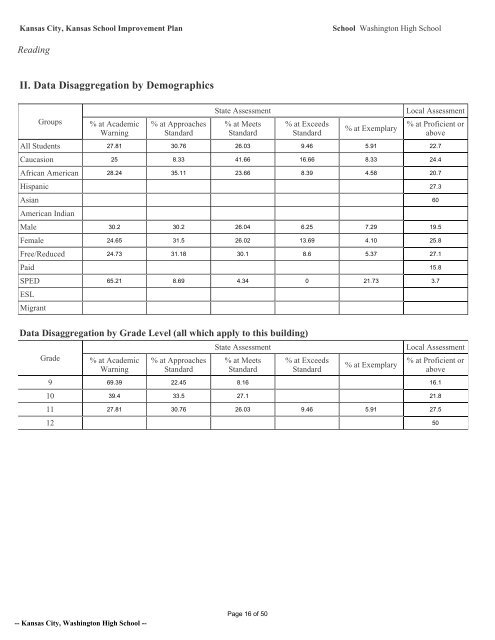
Kansas City, Kansas School Improvement Plan School Washington High School Reading II. Data Disaggregation by Demographics Groups % at Academic Warning % at Approaches Standard State Assessment % at Meets Standard % at Exceeds Standard % at Exemplary Local Assessment % at Proficient or above All Students 27.81 30.76 26.03 9.46 5.91 22.7 Caucasion 25 8.33 41.66 16.66 8.33 24.4 African American 28.24 35.11 23.66 8.39 4.58 20.7 Hispanic 27.3 Asian 60 American Indian Male 30.2 30.2 26.04 6.25 7.29 19.5 Female 24.65 31.5 26.02 13.69 4.10 25.8 Free/Reduced 24.73 31.18 30.1 8.6 5.37 27.1 Paid 15.8 SPED 65.21 8.69 4.34 0 21.73 3.7 ESL Migrant Data Disaggregation by Grade Level (all which apply to this building) Grade % at Academic Warning % at Approaches Standard State Assessment % at Meets Standard % at Exceeds Standard % at Exemplary Local Assessment % at Proficient or above 9 69.39 22.45 8.16 16.1 10 39.4 33.5 27.1 21.8 11 27.81 30.76 26.03 9.46 5.91 27.5 12 50 -- Kansas City, Washington High School -- Page 16 of 50
II. Data Disaggregation by Demographics -- continued -- Based on the site data, identify your building Reading Goal A minimum of 72.0% of the whole population and each of the subgroups will perform at least at the proficiency level or show gains to make safe harbor or the confidence levels on the Kansas State Reading Assessment. A minimum of 72.0% of the African American students will perform at least at the proficiency level or show gains to make safe harbor or the confidence levels on the Kansas State Reading Assessment. A minimum of 72.0% of the caucasian students will perform at least at the proficiency level or show gains to make safe harbor or the confidence levels on the Kansas State Reading Assessment. A minimum of 72.0% of the male students will perform at least at the proficiency level or show gains to make safe harbor or the confidence levels on the Kansas State Reading Assessment. A minimum of 72.0% of the female students will perform at least at the proficiency level or show gains to make safe harbor or the confidence levels on the Kansas State Reading Assessment. A minimum of 72.0% of the students with IEPs will perform at least at the proficiency level or show gains to make safe harbor or the confidence levels on the Kansas State Reading Assessment. A minimum of 72.0% of the students receiving free or reduced meals will perform at least at the proficiency level or show gains to make safe harbor or the confidence levels on the Kansas State Reading Assessment. Identify the relevant State Standards and Indicators the site will focus on based on the building Reading Goal -- Kansas City, Washington High School -- Page 17 of 50
- Page 1 and 2: HIGH SCHOOL Please submit to: Conni
- Page 3 and 4: Part IA. COLLABORATION AND PLANNING
- Page 5 and 6: IB. DATA ANALYSIS READING Compare h
- Page 7 and 8: 10th Grade 1.4.11 (Author's Purpose
- Page 9 and 10: Since only 19 freshmen were test in
- Page 11 and 12: -- Kansas City, Washington High Sch
- Page 13 and 14: -- Kansas City, Washington High Sch
- Page 15: Washington High School Percent of S
- Page 19 and 20: Reading Targets based on the Kansas
- Page 21 and 22: F. Motivation G. Other SCIENTIFICAL
- Page 23 and 24: Kansas City, Kansas School Improvem
- Page 25 and 26: GEOMETRY Figures Applications of th
- Page 27 and 28: G. Other SCIENTIFICALLY BASED RESEA
- Page 29 and 30: Describe what your school will impl
- Page 31 and 32: V. PROFESSIONAL DEVELOPMENT FOR SCI
- Page 33 and 34: By having Wednesday in-service time
- Page 35 and 36: Describe the school’s teacher-men
- Page 37 and 38: VI. HIGHLY QUALIFIED STAFF How wil
- Page 39 and 40: District Policy - Parent/Community
- Page 41 and 42: VIII. TEACHER INVOLVEMENT Describe
- Page 43 and 44: X. ASSISTANCE TO STUDENTS IN NEED
- Page 45 and 46: XII. COLLABORATION AND INTEGRATION
- Page 47 and 48: Parents were encouraged to become a
- Page 49 and 50: opportunities to connect their lear
<strong>Kansas</strong> <strong>City</strong>, <strong>Kansas</strong> School Improvement Plan<br />
School <strong>Washington</strong> High School<br />
Reading<br />
II. Data Disaggregation by Demographics<br />
Groups<br />
% at Academic<br />
Warning<br />
% at Approaches<br />
Standard<br />
State Assessment<br />
% at Meets<br />
Standard<br />
% at Exceeds<br />
Standard<br />
% at Exemplary<br />
Local Assessment<br />
% at Proficient or<br />
above<br />
All Students 27.81 30.76 26.03 9.46 5.91 22.7<br />
Caucasion 25 8.33 41.66 16.66 8.33 24.4<br />
African American 28.24 35.11 23.66 8.39 4.58 20.7<br />
Hispanic 27.3<br />
Asian 60<br />
American Indian<br />
Male 30.2 30.2 26.04 6.25 7.29 19.5<br />
Female 24.65 31.5 26.02 13.69 4.10 25.8<br />
Free/Reduced 24.73 31.18 30.1 8.6 5.37 27.1<br />
Paid 15.8<br />
SPED 65.21 8.69 4.34 0 21.73 3.7<br />
ESL<br />
Migrant<br />
Data Disaggregation by Grade Level (all which apply to this building)<br />
Grade<br />
% at Academic<br />
Warning<br />
% at Approaches<br />
Standard<br />
State Assessment<br />
% at Meets<br />
Standard<br />
% at Exceeds<br />
Standard<br />
% at Exemplary<br />
Local Assessment<br />
% at Proficient or<br />
above<br />
9 69.39 22.45 8.16 16.1<br />
10 39.4 33.5 27.1 21.8<br />
11 27.81 30.76 26.03 9.46 5.91 27.5<br />
12 50<br />
-- <strong>Kansas</strong> <strong>City</strong>, <strong>Washington</strong> High School --<br />
Page 16 of 50


