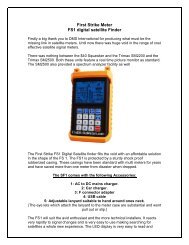
Using the FS1 Satellite Signal Meter - First Strike Meters
Using the FS1 Satellite Signal Meter - First Strike Meters
Using the FS1 Satellite Signal Meter - First Strike Meters

You also want an ePaper? Increase the reach of your titles
YUMPU automatically turns print PDFs into web optimized ePapers that Google loves.
<strong>Using</strong> <strong>the</strong> first strike meter<br />
How to use <strong>the</strong> information displayed to your advantage.<br />
What do <strong>the</strong> figures and numbers on <strong>the</strong> display actually mean.<br />
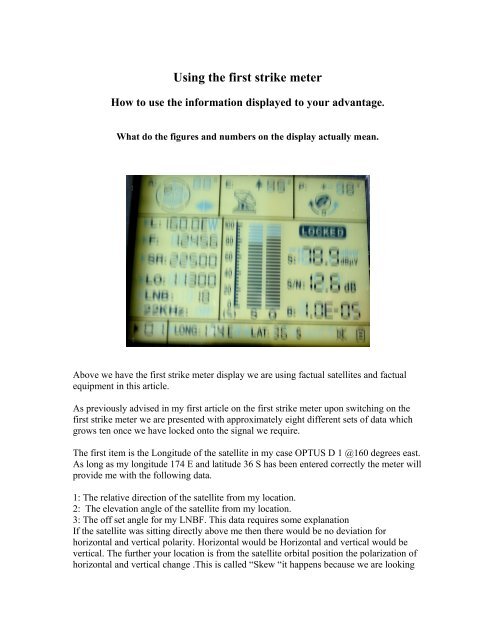
Above we have <strong>the</strong> first strike meter display we are using factual satellites and factual<br />
equipment in this article.<br />
As previously advised in my first article on <strong>the</strong> first strike meter upon switching on <strong>the</strong><br />
first strike meter we are presented with approximately eight different sets of data which<br />
grows ten once we have locked onto <strong>the</strong> signal we require.<br />
The first item is <strong>the</strong> Longitude of <strong>the</strong> satellite in my case OPTUS D 1 @160 degrees east.<br />
As long as my longitude 174 E and latitude 36 S has been entered correctly <strong>the</strong> meter will<br />
provide me with <strong>the</strong> following data.<br />
1: The relative direction of <strong>the</strong> satellite from my location.<br />
2: The elevation angle of <strong>the</strong> satellite from my location.<br />
3: The off set angle for my LNBF. This data requires some explanation<br />
If <strong>the</strong> satellite was sitting directly above me <strong>the</strong>n <strong>the</strong>re would be no deviation for<br />
horizontal and vertical polarity. Horizontal would be Horizontal and vertical would be<br />
vertical. The fur<strong>the</strong>r your location is from <strong>the</strong> satellite orbital position <strong>the</strong> polarization of<br />
horizontal and vertical change .This is called “Skew “it happens because we are looking
at <strong>the</strong> satellite at an angle and not directly faces on. This is called <strong>the</strong>” Slant Angle “and<br />
<strong>the</strong>se changes as our latitude and longitude changes in reference to <strong>the</strong> satellite location.<br />
In my case its approximately 18degrees skew to make sure <strong>the</strong> polarization provides<br />
clean horizontal and vertical signal separation.<br />
Set up parameters<br />
The first user display is termed F for frequency. In my case 12456 being Ku band 12456<br />
is one of <strong>the</strong> half transponders operated by Free View NZ.<br />
Next we have <strong>the</strong> SR symbol rate which can be any thing from 2,000 M/S to 45,000 M/S<br />
depending on <strong>the</strong> operator and whe<strong>the</strong>r <strong>the</strong> transponder is “MCPC” Multiple Channel per<br />
Carrier which will be denoted by a high symbol rate or a Single Channel per Carrier<br />
“SCPC”<br />
Next we have LO which stands for Local Oscillator frequency. These changes depending<br />
on <strong>the</strong> LNBF type and <strong>the</strong> frequency band <strong>the</strong> satellite you are viewing. However more<br />
and more universal LNBF’s are being used which use 9750 /10600 <strong>the</strong> latter with <strong>the</strong><br />
22K option active.<br />
My Lo for <strong>the</strong> Optus D1 series satellites using 12250 to 12750 MHz ei<strong>the</strong>r 11300MHz or<br />
10750 MHz. The actual LNBF for this test was 11.300 MHz<br />
The 22K function was off in this case however it is used when using a universal LNBF<br />
which covers two frequency bands starting at 10 GHz and finishing at 12.75 GHz<br />
The first band is accessed by using 9750 MHz for <strong>the</strong> Lo band and 10.600 for <strong>the</strong> high<br />
band.<br />
The signal and quality meter<br />
This is displayed as a bar graph S “signal” refers to <strong>the</strong> output from <strong>the</strong> meters tuner<br />
using <strong>the</strong> same principle as a satellite receiver. It is a reference to <strong>the</strong> amplified signal<br />
from <strong>the</strong> LNBF as an output to <strong>the</strong> QSPK demodulator stage.<br />
Like wise Q “Quality “is referenced after <strong>the</strong> decoding process The "quality" reading is<br />
<strong>the</strong> inverse of received bit error rate, i.e., as errors rise - with falling signal levels <strong>the</strong><br />
errors go up - so "quality" goes down.<br />
Digital satellite receivers have operating parameters that are well described. The first<br />
strike is really a satellite receiver with out having A/V outputs. The point that we refer<br />
to as "lock" has two names. It is called <strong>the</strong> FP (failure point) by DVB standards and it is<br />
called <strong>the</strong> TOV (threshold of visibility) by <strong>the</strong> ATSC standards. It is defined as a bit error<br />
rate, it is defined by number of corrupted packets, and it is defined visually.
S/N or <strong>Signal</strong> to noise “SNR” <strong>Signal</strong> to Noise Ratio.<br />
I n both analog and digital communications, signal-to-noise ratio, often written S/N or<br />
SNR, is <strong>the</strong> measurement signal strength relative to background noise The ratio is usually<br />
measured in decibels (dB).<br />
The incoming signal strength is measured in microvolt’s Vs, and <strong>the</strong> noise level, also in<br />
microvolt’s, is Vn, <strong>the</strong>n <strong>the</strong> signal-to-noise ratio, S/N, in decibels .Communications<br />
engineers always strive to maximize <strong>the</strong> S/N ratio.<br />
In our case we can assume based upon <strong>the</strong> broadcast parameters what our IRD threshold<br />
will be for a specific satellite service. In My case <strong>the</strong> Free View transmissions use FEC ¾<br />
which equates to an IRD threshold of under 6dB. Infact <strong>the</strong> turn on point is<br />
approximately 5.2db on paper.<br />
By care full adjustment of <strong>the</strong> LNBF <strong>the</strong> actual IRD turn on point can be found you can<br />
vary <strong>the</strong> LNBF to make <strong>the</strong> first strike meter sit on <strong>the</strong> threshold point. This is where <strong>the</strong><br />
meter will display “LOCK” / “UNLOCK” this point is your STB threshold point.<br />
In my case <strong>the</strong> free view threshold point according to my first strike meter is 4.9 Db<br />
Being situated in a climatic zone which requires at least 3.5 Db rain fade margin my<br />
12.6db S/N on a 35cm dish with a spitfire LNBF is more than adequate for home<br />
viewing.<br />
Rule of thumb for digital satellite broadcasts, using full or partial transponders. These<br />
may vary slightly depending on <strong>the</strong> actual broadcasts <strong>the</strong>mselves.<br />
FEC Rate ½ = Threshold rate of 3.6 dB / FEC Rate 2/3 =Threshold rate of 4.2 dB<br />
FEC Rate 3/4 =Threshold rate of 4.9 dB / FEC Rate 5/6 =Threshold rate of 5.2 dB<br />
FEC Rate 7/8 =Threshold rate of 8.2 dB<br />
S or <strong>Signal</strong> measured in dBuv below is a chart out lining <strong>the</strong> various signal strengths<br />
encountered when aligning or trouble shooting satellite installations. Of course <strong>the</strong><br />
difference in received signal will impact upon <strong>the</strong> o<strong>the</strong>r meter readings.<br />
49 dBuv = very low signal / 52 dBuv = low signal / 59 dBuv = marginal signal<br />
requirements / 63 dBuv = acceptable signal / 69 dBuv = good quality signal<br />
72 dBuv = Very good signal / 78 dBuv = classed as optimum signal<br />
80 dBuv and up = Very Very Very Good signal better than optimum signal.
In my case <strong>the</strong> free view signal was 78.9 dBuv which was also reflected by <strong>the</strong> high<br />
readings in <strong>the</strong> o<strong>the</strong>r displays.<br />
78.9Dbuv = 12.6 SN<br />
Lastly “BER” Bit Error Rate.<br />
The bit Error “BER” expresses <strong>the</strong> performance level of a digital receiver .<strong>the</strong> higher <strong>the</strong><br />
BER <strong>the</strong> greater <strong>the</strong> receive systems ability to perform well during marginal reception<br />
conditions, This simple relationship is <strong>the</strong> basis for all BER measurements and<br />
specifications. It assumes that all transmitted bits were sent error free. BER is usually<br />
specified as a number times 10 raised to a large negative exponent. Common<br />
requirements for serial links are generally in <strong>the</strong> range of 1x10⁻⁶ to 1x10-15. BER<br />
numbers by <strong>the</strong>mselves do not represent any period of time. They are only a ratio of<br />
numbers of bits sent and received.<br />
Our 1-0E- 05 BER seems to be standard on <strong>the</strong> first strike meter once acceptable signal<br />
strength has been obtained. The <strong>the</strong>ory behind <strong>the</strong>se calculations and displays take up<br />
several pages of reading. What I have attempted to achieve here is a understanding of<br />
how <strong>the</strong> various displays and <strong>the</strong> information is interrelated and how you can use your<br />
first strike and understand what in real life <strong>the</strong>se displays mean.