editorial team
editorial team
editorial team

Create successful ePaper yourself
Turn your PDF publications into a flip-book with our unique Google optimized e-Paper software.
Akpinar and Akpinar<br />
17<br />
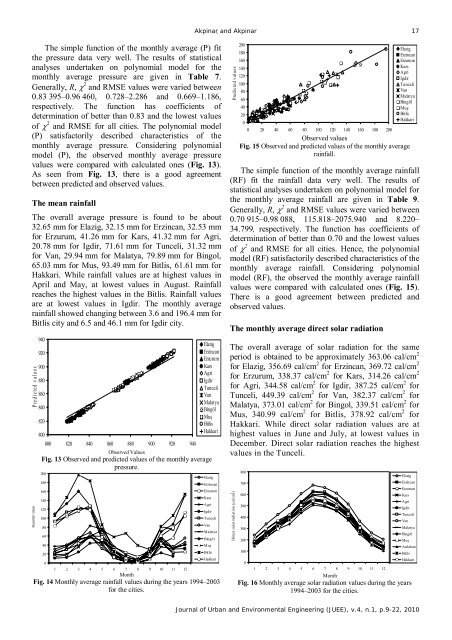
The simple function of the monthly average (P) fit<br />
the pressure data very well. The results of statistical<br />
analyses undertaken on polynomial model for the<br />
monthly average pressure are given in Table 7.<br />
Generally, R, χ 2 and RMSE values were varied between<br />
0.83 395–0.96 460, 0.728–2.286 and 0.669–1.186,<br />
respectively. The function has coefficients of<br />
determination of better than 0.83 and the lowest values<br />
of χ 2 and RMSE for all cities. The polynomial model<br />
(P) satisfactorily described characteristics of the<br />
monthly average pressure. Considering polynomial<br />
model (P), the observed monthly average pressure<br />
values were compared with calculated ones (Fig. 13).<br />
As seen from Fig. 13, there is a good agreement<br />
between predicted and observed values.<br />
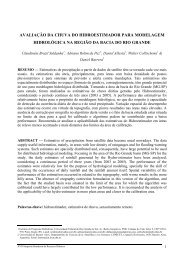
The mean rainfall<br />
The overall average pressure is found to be about<br />
32.65 mm for Elazig, 32.15 mm for Erzincan, 32.53 mm<br />
for Erzurum, 41.26 mm for Kars, 41.32 mm for Agri,<br />
20.78 mm for Igdir, 71.61 mm for Tunceli, 31.32 mm<br />
for Van, 29.94 mm for Malatya, 79.89 mm for Bingol,<br />
65.03 mm for Mus, 93.49 mm for Bitlis, 61.61 mm for<br />
Hakkari. While rainfall values are at highest values in<br />
April and May, at lowest values in August. Rainfall<br />
reaches the highest values in the Bitlis. Rainfall values<br />
are at lowest values in Igdir. The monthly average<br />
rainfall showed changing between 3.6 and 196.4 mm for<br />
Bitlis city and 6.5 and 46.1 mm for Igdir city.<br />
Predicted values<br />
Rainfall (mm<br />
940<br />
920<br />
900<br />
880<br />
860<br />
840<br />
820<br />
800<br />
800 820 840 860 880 900 920 940<br />
Elazig<br />
Erzincan<br />
Erzurum<br />
Kars<br />
Agri<br />
Igdir<br />
Tunceli<br />
Van<br />
Malatya<br />
Bingöl<br />
Muş<br />
Bitlis<br />
Hakkari<br />
Observed Values<br />
Fig. 13 Observed and predicted values of the monthly average<br />
pressure.<br />
200<br />
180<br />
160<br />
140<br />
120<br />
100<br />
80<br />
60<br />
40<br />
20<br />
0<br />
1 2 3 4 5 6 7 8 9 10 11 12<br />
Elazig<br />
Erzincan<br />
Erzurum<br />
Kars<br />
Agri<br />
Igdir<br />
Tunceli<br />
Van<br />
Malatya<br />
Bingöl<br />
Muş<br />
Bitlis<br />
Hakkari<br />
Month<br />
Fig. 14 Monthly average rainfall values during the years 1994–2003<br />
for the cities.<br />
Predicted values<br />
200<br />
180<br />
160<br />
140<br />
120<br />
100<br />
80<br />
60<br />
40<br />
20<br />
0<br />
0 20 40 60 80 100 120 140 160 180 200<br />
Elazig<br />
Erzincan<br />
Erzurum<br />
Kars<br />
Agri<br />
Igdir<br />
Tunceli<br />
Van<br />
Malatya<br />
Bingöl<br />
Muş<br />
Bitlis<br />
Hakkari<br />
Observed values<br />
Fig. 15 Observed and predicted values of the monthly average<br />
rainfall.<br />
The simple function of the monthly average rainfall<br />
(RF) fit the rainfall data very well. The results of<br />
statistical analyses undertaken on polynomial model for<br />
the monthly average rainfall are given in Table 9.<br />
Generally, R, χ 2 and RMSE values were varied between<br />
0.70 915–0.98 088, 115.818–2075.940 and 8.220–<br />
34.799, respectively. The function has coefficients of<br />
determination of better than 0.70 and the lowest values<br />
of χ 2 and RMSE for all cities. Hence, the polynomial<br />
model (RF) satisfactorily described characteristics of the<br />
monthly average rainfall. Considering polynomial<br />
model (RF), the observed the monthly average rainfall<br />
values were compared with calculated ones (Fig. 15).<br />
There is a good agreement between predicted and<br />
observed values.<br />
The monthly average direct solar radiation<br />
The overall average of solar radiation for the same<br />
period is obtained to be approximately 363.06 cal/cm 2<br />
for Elazig, 356.69 cal/cm 2 for Erzincan, 369.72 cal/cm 2<br />
for Erzurum, 338.37 cal/cm 2 for Kars, 314.26 cal/cm 2<br />
for Agri, 344.58 cal/cm 2 for Igdir, 387.25 cal/cm 2 for<br />
Tunceli, 449.39 cal/cm 2 for Van, 382.37 cal/cm 2 for<br />
Malatya, 373.01 cal/cm 2 for Bingol, 339.51 cal/cm 2 for<br />
Mus, 340.99 cal/cm 2 for Bitlis, 378.92 cal/cm 2 for<br />
Hakkari. While direct solar radiation values are at<br />
highest values in June and July, at lowest values in<br />
December. Direct solar radiation reaches the highest<br />
values in the Tunceli.<br />
Direct solar radiation (cal/cm 2 )<br />
800<br />
700<br />
600<br />
500<br />
400<br />
300<br />
200<br />
100<br />
0<br />
1 2 3 4 5 6 7 8 9 10 11 12<br />
Elazig<br />
Erzincan<br />
Erzurum<br />
Kars<br />
Agri<br />
Igdir<br />
Tunceli<br />
Van<br />
Malatya<br />
Bingöl<br />
Muş<br />
Ardahan<br />
Bitlis<br />
Hakkari<br />
Month<br />
Fig. 16 Monthly average solar radiation values during the years<br />
1994–2003 for the cities.<br />
Journal of Urban and Environmental Engineering (JUEE), v.4, n.1, p.9-22, 2010