- Page 2 and 3:
The Secret Lives of INTJs by Anna M
- Page 4 and 5:
Table of Contents A Dark Confession
- Page 6 and 7:
Mate Selection.....................
- Page 8 and 9:
School.............................
- Page 10 and 11:
Preface & Caveat Lector A Dark Conf
- Page 12 and 13:
General When an INTJs gets excited
- Page 14 and 15:
A survey of type and American polit
- Page 16 and 17:
name I can no longer recall was sho
- Page 18 and 19:
Leisure Favorite Pastimes Believe i
- Page 20 and 21:
following the principles the INTJ h
- Page 22 and 23:
observed that the Rational temperam
- Page 24 and 25:
One further note on giving. I suspe
- Page 26 and 27:
were seen as not being "facially an
- Page 28 and 29:
answer—the test subjects were muc
- Page 30 and 31:
2. North Carolina 3. Georgia 4. Uta
- Page 32 and 33:
As it so happens, I have an INTJ fr
- Page 34 and 35:
How to Tell INTJs Apart From INTPs
- Page 36 and 37:
• INTJs generally believe that th
- Page 38 and 39:
• INTJs enjoy exercise more than
- Page 40 and 41:
Fictional INTJs Why study fictional
- Page 42 and 43:
It is better to rely on information
- Page 44 and 45:
Archetypes If you've ever spent tim
- Page 46 and 47:
INTJs in Love Problems with Studyin
- Page 48 and 49:
• Rationals were 65% satisfied wi
- Page 50 and 51:
4. Similar parenting styles 5. Spen
- Page 52 and 53:
• Mutual support All NFs chose th
- Page 54 and 55:
"sentimental" presents. Rationals d
- Page 56 and 57:
neither party will retreat from the
- Page 58 and 59:
Least Important Values The research
- Page 60 and 61:
Guardians like giving and receiving
- Page 62 and 63:
scientists, who named a mouse phero
- Page 64 and 65:
"...there was a mixture of sweetnes
- Page 66 and 67:
Rational, I have very high standard
- Page 68 and 69:
"Then," observed Elizabeth, "you mu
- Page 70 and 71:
animated." When Darcy learned that
- Page 72 and 73:
evening in this way! I declare afte
- Page 74 and 75:
emarried than average, and also had
- Page 76 and 77:
The finished contract will look som
- Page 78 and 79:
You’re sort of like a journal in
- Page 80 and 81:
"St. John had a book in his hand—
- Page 82 and 83:
one of bettering their race—of ca
- Page 84 and 85:
people, i.e. more like themselves.
- Page 86 and 87:
"He [Van Helsing] stepped over and
- Page 88 and 89:
For this reason, Van Helsing was th
- Page 90 and 91:
good at planning trips. • Secrecy
- Page 92 and 93:
This probably argues against ENTJ.)
- Page 94 and 95:
INTJs in Charge Keirsey (1987) call
- Page 96 and 97:
Nathaniel Bowditch Occupation: Math
- Page 98 and 99:
• After forgetting to write in a
- Page 100 and 101:
jumping swiftly to "the wild hilari
- Page 102 and 103:
children. (To give you some tempora
- Page 104 and 105:
could take and work a lunar observa
- Page 106 and 107:
will pay close attention to details
- Page 108 and 109:
more amusing when we look at his bu
- Page 110 and 111:
"exact and equal" justice. In the m
- Page 112 and 113:
an account were such that he might
- Page 114 and 115:
initiation of the disastrous War of
- Page 116 and 117:
it was always his endeavor to do it
- Page 118 and 119:
INTJs like reading and working on t
- Page 120 and 121:
Christians, however.) If the intuit
- Page 122 and 123:
it the least. This trend actually f
- Page 124 and 125:
you know about this" rather than "W
- Page 126 and 127:
The rock belonged to your neighbor
- Page 128 and 129:
changing or of an unknown character
- Page 130 and 131:
minutes for the task, and an additi
- Page 132 and 133: Kim: 'I was Borg.' That's what you
- Page 134 and 135: always aims for the absolute. The d
- Page 136 and 137: So he defined three different ways
- Page 138 and 139: Work Related Miscellanea E-mail Int
- Page 140 and 141: doesn't make him "smart" by our Ein
- Page 142 and 143: creativity often takes the form of
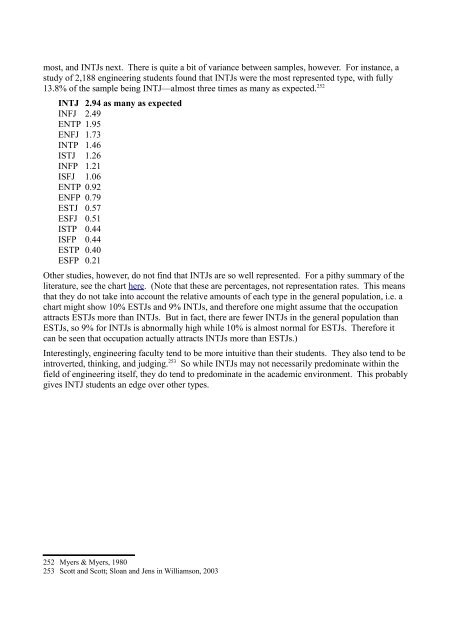
- Page 144 and 145: ESTP 0.49 ISFJ 0.40 ESTJ 0.26 ESFJ
- Page 146 and 147: Child C - IQ Unmeasurable (As teste
- Page 148 and 149: "antagonistic" trait that they deci
- Page 150 and 151: teachers later noted, "My only crit
- Page 152 and 153: his assistants, he could not bear t
- Page 154 and 155: Rationals seldom confuse the means
- Page 156 and 157: & his Head scarcely comb'd.” It t
- Page 158 and 159: used external coercion effectively
- Page 160 and 161: undertaken, and prosecuted with ard
- Page 162 and 163: said so" or "Because I gave birth t
- Page 164 and 165: INTJ Children Lack of Role Models O
- Page 166 and 167: Some of the things that INTJs enjoy
- Page 168 and 169: Computer Games Like adults of the t
- Page 170 and 171: try anything. 228 Others claim that
- Page 172 and 173: Fitting In Many youthful INTJs find
- Page 174 and 175: wished to improve and ennoble you.
- Page 176 and 177: punishments are threatened. Or, if
- Page 178 and 179: learning what they are supposed to
- Page 180 and 181: School Will Socialize You INTJ chil
- Page 184 and 185: MBA A 1997 study 254 of 1,925 worki
- Page 186 and 187: Intelligence Studies Intelligence S
- Page 188 and 189: Science INTJs were the most highly
- Page 190 and 191: Mental Health and Rehabilitation Oc
- Page 192 and 193: INTJs and the Changing Face of Educ
- Page 194 and 195: INTJs and Asperger's Syndrome In IN
- Page 196 and 197: The symptoms he assessed were as fo
- Page 198 and 199: INTJ Detectives and Personality Dis
- Page 200 and 201: person can be 10% OCPD, 30% OCPD, 5
- Page 202 and 203: saddled with innumerable compulsion
- Page 204 and 205: school she attended. Besides this,
- Page 206 and 207: Hercule Poirot and His Little Grey
- Page 208 and 209: square fireplace in the square room
- Page 210 and 211: • Often gave direct commands (NTJ
- Page 212 and 213: simulator) and roleplay as a hard b
- Page 214 and 215: Prison, Criminal Masterminds, and t
- Page 216 and 217: something...reading, writing or doi
- Page 218 and 219: here), so the stereotypes may very
- Page 220 and 221: himself into an INTJ. Maybe INTs ar
- Page 222 and 223: Could this be an isolated finding?
- Page 224 and 225: memorandum-book in which he had scr
- Page 226 and 227: A Brief Note About Holmes I've seen
- Page 228 and 229: Appendix 1: Why Didn't You Include
- Page 230 and 231: and unprovable. Ni was, in fact, th
- Page 232 and 233:
the lower-case non-preferences will
- Page 234 and 235:
the bigot's personal life "proving"
- Page 236 and 237:
Bibliography Ackroyd, P. (2006). Ne
- Page 238 and 239:
of Psychological Type. Kanai, C., I
- Page 240 and 241:
expression of geographic variation