WET LAB DNA Barcoding: From Samples to Sequences - Northwest ...
WET LAB DNA Barcoding: From Samples to Sequences - Northwest ...
WET LAB DNA Barcoding: From Samples to Sequences - Northwest ...

Create successful ePaper yourself
Turn your PDF publications into a flip-book with our unique Google optimized e-Paper software.
<strong>WET</strong> <strong>LAB</strong><br />
d. Ask students <strong>to</strong> estimate the size of the sample bands in the sample lanes<br />
(Lanes 2–5). These bands are just below the 750 bp band in the molecular<br />
weight standard lane, and are estimated <strong>to</strong> be between 650–700 bp. [Note:<br />
These are PCR samples from a <strong>DNA</strong> barcoding experiment with salmon.]<br />
e. Ask students <strong>to</strong> estimate the amount of <strong>DNA</strong> in the sample lanes, using<br />
the known quantity of <strong>DNA</strong> in the molecular weight standard lane<br />
that is closest in size <strong>to</strong> the <strong>DNA</strong> sample bands (i.e., 750 bp, 25<br />
nanograms (ng) of <strong>DNA</strong>).<br />
• Lane 1: Approximately 25 ng. The band is about the same intensity as<br />
the 750 bp band in the molecular weight standard lane.<br />
• Lane 2: Approximately 50 ng. The band is about twice the intensity of<br />
the 750 bp band in the molecular weight standard lane.<br />
• Lane 3: Approximately 75 ng. The band is about three times the intensity<br />
of the 750 bp band in the molecular weight standard lane.<br />
• Lane 4: Approximately 100 ng. The band is about four times the intensity<br />
of the 750 bp band in the molecular weight standard lane.<br />
• Lane 5: Approximately 125 ng. The band is about five times the intensity<br />
of the 750 bp band in the molecular weight standard lane.<br />
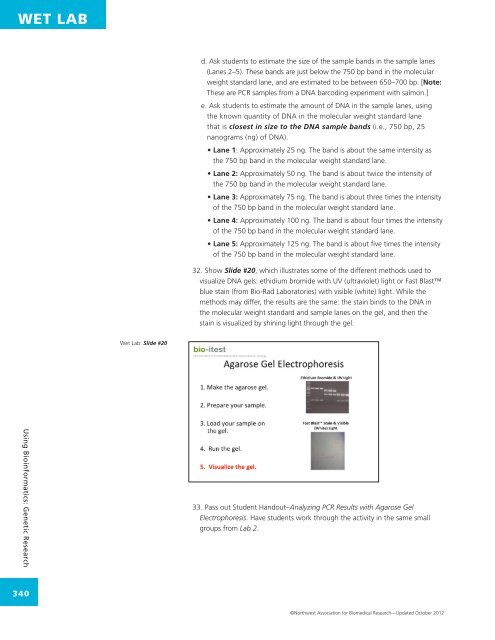
32. Show Slide #20, which illustrates some of the different methods used <strong>to</strong><br />
visualize <strong>DNA</strong> gels: ethidium bromide with UV (ultraviolet) light or Fast Blast<br />
blue stain (from Bio-Rad Labora<strong>to</strong>ries) with visible (white) light. While the<br />
methods may differ, the results are the same: the stain binds <strong>to</strong> the <strong>DNA</strong> in<br />
the molecular weight standard and sample lanes on the gel, and then the<br />
stain is visualized by shining light through the gel.<br />
Wet Lab: Slide #20<br />
Using Bioinformatics: Genetic Research<br />
33. Pass out Student Handout–Analyzing PCR Results with Agarose Gel<br />
Electrophoresis. Have students work through the activity in the same small<br />
groups from Lab 2.<br />
340<br />
©<strong>Northwest</strong> Association for Biomedical Research—Updated Oc<strong>to</strong>ber 2012