
You also want an ePaper? Increase the reach of your titles
YUMPU automatically turns print PDFs into web optimized ePapers that Google loves.
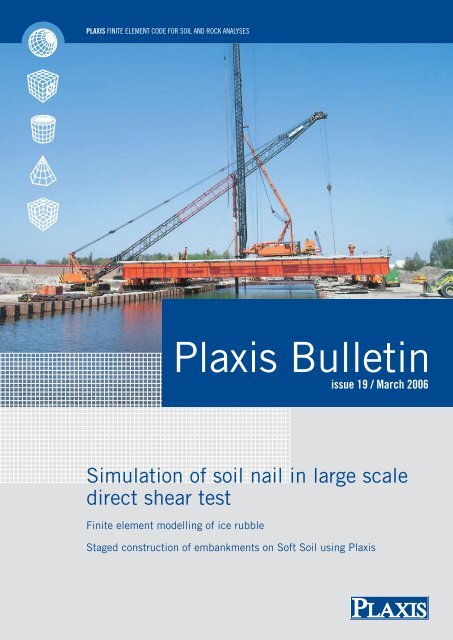
<strong>Plaxis</strong> finite element code for soil and rock analyses<br />
<strong>Plaxis</strong> <strong>Bulletin</strong><br />
issue <strong>19</strong> / March <strong>2006</strong><br />
Simulation of soil nail in large scale<br />
direct shear test<br />
Finite element modelling of ice rubble<br />
Staged construction of embankments on Soft Soil using <strong>Plaxis</strong>
Editorial<br />
Colophon<br />
Ronald Brinkgreve<br />
Editorial<br />
New Developments<br />
<strong>Plaxis</strong> Practice<br />
Finite element<br />
modelling of ice rubble<br />
<strong>Plaxis</strong> Practice<br />
Simulation of soil nail in<br />
large scale direct shear<br />
test<br />
<strong>Plaxis</strong> Practice<br />
Staged construction of<br />
embankments on Soft<br />
Soil using <strong>Plaxis</strong><br />
Recent activities<br />
3<br />
4<br />
6<br />
12<br />
16<br />
18<br />
The <strong>Plaxis</strong> <strong>Bulletin</strong> is the combined magazine of <strong>Plaxis</strong> B.V. and the <strong>Plaxis</strong> Users<br />
Association (NL). The <strong>Bulletin</strong> focuses on the use of the finite element method in geotechnical<br />
engineering practise and includes articles on the practical application of the <strong>Plaxis</strong><br />
programs, case studies and backgrounds on the models implemented in <strong>Plaxis</strong>.<br />
The <strong>Bulletin</strong> offers a platform where users of <strong>Plaxis</strong> can share ideas and experiences with<br />
each other. The editors welcome submission of papers for the <strong>Plaxis</strong> <strong>Bulletin</strong> that fall in<br />
any of these categories.<br />
The manuscript should preferably be submitted in an electronic format, formatted as<br />
plain text without formatting. It should include the title of the paper, the name(s) of the<br />
authors and contact information (preferably email) for the corresponding author(s). The<br />
main body of the article should be divided into appropriate sections and, if necessary,<br />
subsections. If any references are used, they should be listed at the end of the article.<br />
The author should ensure that the article is written clearly for ease of reading.<br />
In case figures are used in the text, it should be indicated where they should be placed<br />
approximately in the text. The figures themselves have to be supplied separately from the<br />
text in a common graphics format (e.g. tif, gif, png, jpg, wmf, cdr or eps formats are all<br />
acceptable). If bitmaps or scanned figures are used the author should ensure that they<br />
have a resolution of at least 300 dpi at the size they will be printed. The use of colour in<br />
figures is encouraged, as the <strong>Plaxis</strong> <strong>Bulletin</strong> is printed in full-colour.<br />
Any correspondence regarding the <strong>Plaxis</strong> <strong>Bulletin</strong> can be sent by email to<br />
bulletin@plaxis.nl<br />
or by regular mail to:<br />
<strong>Plaxis</strong> <strong>Bulletin</strong><br />
c/o Erwin Beernink<br />
PO Box 572<br />
2600 AN Delft<br />
The Netherlands<br />
The <strong>Plaxis</strong> <strong>Bulletin</strong> has a total circulation of 10.000 copies and is distributed worldwide.<br />
Editorial Board:<br />
The <strong>Plaxis</strong> company has now been in existence for 12.5 years. Last year our<br />
emphasis was on quality and involved procedures such as automatic GUI and kernel<br />
testing, improved planning, version control, a system for bug reporting and<br />
monitoring, release test procedure and improved documentation. The new quality<br />
procedures have now been integrated into all <strong>Plaxis</strong> developments. We are also<br />
refactoring – improving the design of our existing code.<br />
This issue of the <strong>Plaxis</strong> <strong>Bulletin</strong> features three articles by <strong>Plaxis</strong> users covering discrete<br />
modeling of ice rubble for offshore construction projects, large-scale shear testing of dike<br />
reinforcement and speed versus safety during road embankment construction. In addition<br />
there is information about <strong>Plaxis</strong> related activities.<br />
The first article describes how <strong>Plaxis</strong> 3D was used for the validation of punch testing results<br />
on ice rubble. The strength of ice rubble had been determined to provide information<br />
for offshore construction projects such as oil platforms. <strong>Plaxis</strong> was used to back-calculate<br />
the test results and a finite element analysis approach was used to model discrete ice<br />
particles. This was actually a mix of continuum and discrete approaches.<br />
The second article discusses the use of <strong>Plaxis</strong> to simulate large-scale shear testing of<br />
dike reinforcement.<br />
The third article looks at the stage-by-stage construction of road embankments. A compromise<br />
always has to be struck between speed of construction and safety. <strong>Plaxis</strong> was<br />
used to analyze stability as a function of consolidation time and turned out to be an ideal<br />
tool for this type of work.<br />
This issue also contains contributions from <strong>Plaxis</strong> and information on <strong>Plaxis</strong> related issues.<br />
These include the relevance of small strain stiffness and the latest information<br />
on the cooperation between <strong>Plaxis</strong> and GeoDelft. Here joint research and development<br />
projects will benefit from the combined expertise of the two companies (finite-element<br />
modeling + geo-engineering).<br />
Wout Broere<br />
Ronald Brinkgreve<br />
Erwin Beernink<br />
François Mathijssen
New Developments<br />
New Developments<br />
New Developments<br />
Ronald Brinkgreve<br />
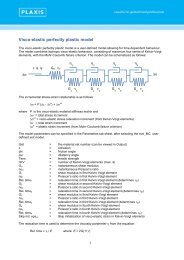
The accuracy of results from <strong>Plaxis</strong> calculations depend in particular on the type of soil<br />
model being used and the selection of the corresponding model parameters.<br />
From the beginning of <strong>Plaxis</strong>, much effort has been put into development, improvement<br />
and implementation of soil models. Over the years more advanced soil models became<br />
available, taking into account more and more aspects of soil behaviour. Most <strong>Plaxis</strong> users<br />
nowadays recognize the advantages of models like the Hardening Soil (HS) model with<br />
its stress(path)-dependent stiffness behaviour. Despite the larger number of stiffness<br />
parameters that have to be entered, the parameter selection is easier than for simplified<br />
models, because of the clear meaning of the individual stiffness parameters in the HS<br />
model.<br />
One feature of soil behaviour that was still missing in the HS model is the high stiffness<br />
at small strain levels (< 10 -5 ). Even in applications that are dominated by ‘engineering<br />
strain levels’ (> 10 -3 ) small-strain stiffness can play an important role. It is generally<br />
known that conventional models over-predict heave in excavation problems. These models<br />
also overpredict the width and underpredict the gradient of the settlement trough behind<br />
excavations and above tunnels. Small-strain stiffness can improve this. Moreover, smallstrain<br />
stiffness can reduce the influence of the particular choice (position) of the finite<br />
element model boundaries. Last but not least, small-strain stiffness can be used to model<br />
the effect of hysteresis and hysteretic damping in applications involving cyclic loading<br />
and dynamic behaviour.<br />
Recently, the <strong>Plaxis</strong> HS model was extended with small-strain stiffness. The smallstrain<br />
stiffness formulation was based on research by Thomas Benz at the Federal Waterways<br />
Engineering and Research Institute (BAW) in Karlsruhe, and supervised by the<br />
Institut für Geotechnik of the University of Stuttgart [1,2]. The extended HS model, named<br />
HSsmall, has been implemented in a special <strong>Plaxis</strong> version for PDC members (PDC =<br />
<strong>Plaxis</strong> Development Community). The extra information on which the small strain stiffness<br />
formulation is based comes from S-shaped curves where the shear modulus, G, is plotted<br />
as a (logarithmic) function of the shear strain, g, ranging from very small strain levels<br />
(vibrations) up to large strain levels. The S-curve is characterised by the small-strain<br />
shear modulus, G 0 , and the shear strain at which the shear modulus has reduced to<br />
0.7 times G 0 (g 0.7<br />
); see Figure 1. These two parameters are the only extra parameters<br />
compared to the original HS model. In fact, it has been demonstrated by comparing<br />
S-curves of several different types of soil that the particular shape of the S-curves<br />
does not change much and that g 0.7<br />
is generally around 10 -4 . G 0 generally ranges from<br />
around 10 times G ur for soft soils, down to 2.5 times G ur for harder types of soil, where<br />
G ur = E ur / (2(1+n ur )).<br />
Figure 2 shows compuational results of an example excavation project in medium stiff<br />
soil, where both the HS model and the HSsmall model with similar parameters were<br />
used to model the soil behaviour. The additional parameters in the HSsmall model were<br />
ref ref<br />
taken G 0 = 3 G ur and g 0.7<br />
= 10 -4 . The results indicate that the HSsmall model gives<br />
a stiffer over-all behaviour and a smaller (less wide) settlement trough behind the<br />
retaining wall. According to Peck [3], the width of the settlement trough behind the retaining<br />
wall in relatively stiff soils extends to a maximum of two times the excavation depth (here<br />
12 m), which corresponds well with the results of the HSsmall model.<br />
Variations with the position of the bottom and side boundaries have indicated that the<br />
HSsmall model is indeed less sensitive for the precise position of the boundaries than<br />
other <strong>Plaxis</strong> soil models.<br />
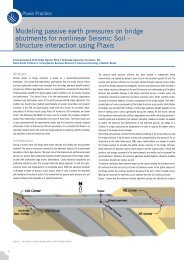
In another application a small soil column was modelled in a dynamic application, applying<br />
a harmonic horizontal prescribed displacement at the bottom. Figure 3 shows the<br />
results in terms of shear stress vs. shear strain for a stress point near the bottom of<br />
the model. The HS and the MC model do not show any hysteresis, whereas the HSsmall<br />
model clearly shows hysteresis for subsequent loading cycles, resulting in more realistic<br />
material damping.<br />
Figure 3: Shear stress as function of shear strain, indicating hysteresis<br />
Blue: Mohr-Coulomb model<br />
Red: Hardening Soil model<br />
Gold: HSsmall model<br />
In the coming period the HSsmall model will be further tested in various applications.<br />
Therefore, different material data sets will be defined for different types of soil, and it<br />
will be validated to what extend these data sets can be used in various applications.<br />
Meanwhile, a small group of users can already get familiar with the new model.<br />
References:<br />
[1] Benz T. (<strong>2006</strong>). Small-strain stiffness of soils and its numerical consequences.<br />
Ph.D. Thesis. Institut für Geotechnik, Universität Stuttgart.<br />
Figure 1: S-curve for reduction of shear modulus with shear strain<br />
Figure 2: Example excavation project.<br />
Above using the existing HS model<br />
Below using the new HSsmall model<br />
[2] Benz T., Schwab R. and Vermeer P.A. (<strong>2006</strong>). A small strain overlay model I:<br />
model formulation. Int. J. Numer. Anal. Meth. Geomech., in progress.<br />
[3] Peck R.B. (<strong>19</strong>69). Deep excavations and tunneling in soft ground.<br />
State of the art report. Proceedings 7th ICSMFE, Mexico.
<strong>Plaxis</strong> Practice<br />
<strong>Plaxis</strong> Practice<br />
Finite element modelling of ice rubble<br />
Pavel Liferov. Barlindhaug Consults AS, Norway; NIP-Informatica, Russia<br />
Introduction<br />
A characteristic feature of ice-covered waters is the presence of ice ridges. They are<br />
formed by compression or shear in the ice cover and are often found in the shear zone<br />
between the land fast ice, i.e. frozen to the shore and the drift ice. A high ridging intensity<br />
may also be found in straits and sounds with strong currents. Ice ridges are in general<br />
long and curvilinear features. Ridges often exist in combination with rafted ice and this<br />
combination is named a ridge field. Ice ridges do in many cases give the design loads for<br />
such structures as offshore platforms and bridge piers. They may also cause significant<br />
impediment to navigation. When drifting into the shallow waters, ice ridges may scour the<br />
seabed and create a serious threat to all seabed installations such as pipelines, cables,<br />
wellheads etc. The loads from ice ridges on various structures are not clear, and one of<br />
the major deficiencies is that the mechanical properties, in time and space, of first-year<br />
sea ice ridges are not well known.<br />
A typical view of the sea ice cover (in the area of high interest with respect to oil and gas<br />
exploration) is shown in Figure 1.<br />
A typical section of the first-year ice ridge is schematically shown in Figure 2. A first-year<br />
ice ridge consists of the sail, the consolidated layer and the keel. The sail is visible, or<br />
above the water surface part of a ridge (ref. Figure 1), similar to that of an iceberg.<br />
The keel is a part of a ridge that is below the water surface. The consolidated layer is the<br />
uppermost refrozen part of the keel. The keel draught can reach 25 – 30 m.<br />
Loads from sea ice ridges on offshore structures are usually estimated by calculating the<br />
loads from the sail, the consolidated layer and the keel separately and adding them at<br />
the end. The consolidated layer is often considered to be a thick level ice sheet so that the<br />
thickness and the strength (flexural and compressive) become the vital parameters. The<br />
sail and the keel are normally called ice rubble and are often treated as a granular material.<br />
A number of testing programmes was conducted both in the laboratory and in-situ<br />
during the last three decades. Ice rubble was normally described either as Tresca or as<br />
Mohr-Coulomb material. The cohesion and the angle of internal friction of ice rubble were,<br />
and still are a subject for investigation and discussion. Variation in the above strength<br />
parameters was, in particular for the laboratory tests, exceedingly high and there are a<br />
number of reasons for this. In contrast with other granular materials, the lifetime of ice<br />
rubble within the ice ridge is limited to a few months. During this period the ice rubble<br />
constantly evolves throughout the initial, main and the decay phases. Laboratory tests on<br />
ice rubble are normally conducted during the initial phase, which is believed to be the<br />
most sensitive with respect to the testing conditions. When modelling ice rubble, the thermodynamic<br />
similarity is of high significance in addition to geometric, kinetic and dynamic<br />
similitude between the prototype and the model. All this, even intending, is very difficult<br />
to achieve in reality. Different interpretation of test result with subsequent comparison<br />
neither helped to meet the agreement on how to describe the ice rubble strength.<br />
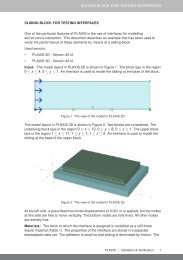
This article briefly descries how PLAXIS was used to simulate some physical tests on<br />
ice rubble with respect to derivation of its strength. The developed pseudo-discrete continuum<br />
model of ice rubble is also presented as a tool to describe and analyse the characteristic<br />
behaviour of ice rubble at failure.<br />
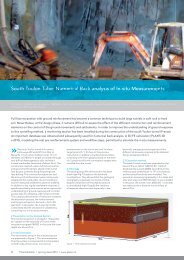
Figure 3: Barge test set-up (from Jensen, 2002)<br />
One of the major problems with laboratory testing is scaling. Gravity forces dominate the<br />
problem studied and thus the Froude scaling was used: the gravity field was not scaled<br />
and the basic scaling unit was the length (l). The flexural strength of the ice was scaled,<br />
but not that of the ice rubble as there are no standardised methods for ridge production<br />
in ice facilities. It was therefore of high importance to conduct separate tests on ice<br />
rubble in order to estimate its strength so it could be related to the full-scale values.<br />
Two types of tests were conducted and analysed: plane strain and circular plate punch<br />
tests. Figure 4 shows a cross-section along the centreline of the ridge with the corresponding<br />
test locations.<br />
of the internal friction angle were obtained. As the analytical approaches do not take<br />
the complexity of deformation mode into account, they may yield to unreliable results.<br />
Numerical modelling of punch tests turned out to be a useful tool for assessment of the<br />
ice rubble strength. Finite-element simulations of the physical tests described above were<br />
conducted in <strong>Plaxis</strong> 8 for the plain strain test and in <strong>Plaxis</strong> 3D tunnel for the circular plate<br />
test as described by Liferov et al. (2002, 2003). The finite-element model of the circular<br />
plate punch test is shown in Figure 5.<br />
Punch testing of ice rubble<br />
During the design phase offshore structures are subjected to physical model testing.<br />
Figure 5: Finite-element model of the simulated punch tests<br />
Figure 1: Sea ice cover<br />
Figure 2: Cross-section of an ice ridge<br />
Action from the ice and the ice ridges is studied in ice basins. In the course of conceptual<br />
design of the Arctic Shuttle Barge equipped with the Submerged Turret Loading system,<br />
the model tests were conducted at the Hamburg Ship Model Basin (TMR Programme<br />
from the European Commission through contract N°ERBFMGECT950081) as described in<br />
details by Jensen, 2002. The use of the barge concept for export of oil includes the following<br />
four major phases: initial approach to the loading facility, final approach and hookup,<br />
loading and departure. During loading the major concerns are related to ice loads on<br />
the tanker from ice ridges and mooring/riser interference with ice when the ridges are<br />
passing by. Figure 3 shows an illustration of the test with the barge and the STL going<br />
through the ice ridge.<br />
Figure 4: Punch tests set-up<br />
As shown in Figure 4, the plain strain test was performed in such a way that it was possible<br />
to observe the failure inside the rubble behind the transparent lexan glass wall.<br />
In the circular plate test, the large circular platen with diameter of 0.7 m was loaded by<br />
230 kg of steel weights. Penetration force (Fz) and displacements of the platen (Z1) and<br />
of the surrounding ice (Z2) were measured in both tests.<br />
The derivation of the rubble strength from punch tests where boundary conditions are not<br />
properly controlled is not straight forward. Two approaches have been used in the past<br />
to interpret the test results: analytical and numerical. Among the analytical approaches<br />
both the different forms of limit equilibrium method and the upper bound theorem of plasticity<br />
were used. The major problem was associated with the use of the two-parametric<br />
Mohr-Coulomb failure criterion since tests result in one equation and two unknowns in<br />
this case. Simplifications were done and ice rubble was considered either as a frictionless<br />
or as a cohesionless material. In the latter case, however, unrealistically high values<br />
The quasi-static approach was used in the simulations and the iterative calculations<br />
were carried out until the prescribed displacement level was reached. The initial stress<br />
state inside the ice rubble was neglected, i.e. the ice rubble was considered as a weightless<br />
material. The level ice and the consolidated layer were modelled as an elastic material<br />
and their elastic properties were estimated during physical model testing. Ice rubble<br />
was modelled as the elastic-perfectly plastic Mohr-Coulomb material. The ice sheet was<br />
modelled resting on the underlying elastic layer whose properties were calibrated such<br />
that it simulated the water for the particular needs (elastic padding). In the part of the<br />
cross-section under the ice rubble the elastic layer underneath was deactivated as it<br />
could impose incorrect boundary conditions at the bottom of the keel. In this area the<br />
buoyancy force was modelled as an imposed traction load applied to the bottom of the<br />
consolidated layer and it was set proportional to the displacement of the ice sheet in<br />
Z-direction. As the ice became fully submerged, the buoyancy load was set to a constant<br />
value. The displacement of the platen was prescribed to a value that was recorded during<br />
the experimental testing. The material properties of the ice rubble were then adjusted<br />
in order to fit the recorded load - displacement curves Fz versus Z1 and Z2. In case of<br />
the plain strain test, the failure mechanism observed through the transparent wall was<br />
an extra “input” to the curve fitting. An example of the experimental and the simulated<br />
failure mechanisms inside the rubble is shown in Figure 6.<br />
The goal of the finite element modelling was to evaluate the strength of the model ice
<strong>Plaxis</strong> Practice<br />
<strong>Plaxis</strong> Practice<br />
Finite element modelling of ice rubble<br />
Continuation<br />
rubble by fitting the experimental curves by the simulated ones. Both the shape of the<br />
curves and their ultimate values were fitted. Nevertheless, no particular efforts were put<br />
into “refining” of the fitting and the attention was rather focused on the parametric study.<br />
Examples of results from the circular plate test simulations is shown in Figure 7 where the<br />
experimental (recorded) and the simulated load – displacement curves are shown.<br />
Two stiffness regions separated at about 1-2 mm displacement were obtained as a result<br />
Primary failure planes<br />
Secondary failure planes<br />
Punch plate<br />
Figure 7: Load-displacement curves, circular plate test (Note: recorded force includes the<br />
buoyancy load that is 40 kN at 40 mm displacement).<br />
of the simulations shown in Figure 7. This coincides well with the experimental records.<br />
The analysis of the material state at the transition point shows that in the first high stiffness<br />
region the ice rubble fails in tension in the lower part of the ridge as shown in Figure<br />
8 (cross-section taken at the centreline of the plate, prescribed displacement not shown).<br />
After that a shear slip surface begins to develop through the keel and a substantial part<br />
of the rubble experiences tensile distortion (Figure 9) and the stiffness drops approaching<br />
zero at failure (Figure 10).<br />
The simulations revealed that the failure mechanism of ice rubble consisted of the plate<br />
bending and the punch through modes. Curve fitting showed that frictional resistance<br />
of the ice rubble against the pushing load was minor compared to the cohesive component.<br />
It became apparent that the frictional resistance could not be mobilized along the<br />
entire failure plane because of the extensive tensile zone in the lower part of the rubble.<br />
The parametric study showed that the strength parameters of the material do not contribute<br />
independently to the peak load. Basically, it was found that strength of the ice rubble<br />
in the punch test is largely dominated by cohesion and tensile strength. The local failure<br />
mode is rather complex and depends on combination of the material properties. It was<br />
also shown that increase of the friction angle may cause decrease of the attained peak<br />
load when the bending of the ice formation is not prevented. It may also be pointed out<br />
that the cohesion of the simulated ice rubble could be in order of 0.5 kPa while its tensile<br />
strength is about 0.25 kPa. These values correspond to the assumed angle of internal<br />
friction of 35º and they provide the best fit of the experimental curves. This corresponds to<br />
the full-scale cohesion value of 12.5 kPa that is in a fairly good agreement with what was<br />
experimentally measured in the full-scale punch tests in-situ.<br />
Pseudo-discrete modelling of ice rubble<br />
Detailed analysis of the in-situ tests on ice rubble described by Liferov and Bonnemaire<br />
(2004) revealed that there exist essentially two failure modes of the ice rubble. The primary<br />
failure mode is associated with breakage of the initial rubble skeleton. The skeleton<br />
consists of the ice blocks that are fused together by freeze bonds. The secondary failure<br />
mode is associated with propagating failure and mobilization of the frictional resistance.<br />
Incorporation of these experimentally observed failure modes into modelling of rubble<br />
– structure interaction can provide an opportunity to conduct more physically sound<br />
simulations and to verify the existing models.<br />
The pseudo-discrete continuum model of ice rubble deformation is a combination of<br />
a discrete particles assembly (i.e. ice rubble accumulation) and a FE analysis of this<br />
assembly. The primary rational for developing such a model was to produce a tool that<br />
would enable a numerical study of the primary failure mode of ice rubble that in many<br />
cases can dominate the global rubble resistance. This model, described by Liferov (2004),<br />
provides the possibility to simulate contacts between ice blocks and to account for their<br />
local failure. The modelling procedure consists of two basic steps. First, the assembly<br />
of blocks is generated. A block generator was developed to fulfil this task. In the second<br />
step, the generated assembly is used as a geometrical input for the FE analysis to study<br />
its behaviour under different boundary conditions. A typical view of the direct shear box<br />
FE model is shown in Figure 11.<br />
A series of experiments was conducted to study the variation of the interface strength<br />
reduction factor R, the confining pressure p, the angle of internal friction of the parent<br />
ice blocks j and the contact area between the blocks A. Three randomly generated block<br />
assemblies were used for each set of the parametric analysis. Figure 12 shows an<br />
example of simulation results: the influence of confining pressure p on the rubble shear<br />
resistance t. For the range of the present analysis t increased non-linearly with increasing<br />
p as shown in Figure 12.<br />
a: Experimental<br />
Lid<br />
Prescribed displacement<br />
(a) Plastic (red) and Tension cut-off (white) points (b) Relative shear stresses (red = 1)<br />
Figure 8. Stress state inside the ice rubble at 1.5 mm displacement of the plate.<br />
(a) Plastic (red) and Tension cut-off (white) points (b) Relative shear stresses (red = 1)<br />
Figure 9. Stress state inside the ice rubble at 6 mm displacement of the plate.<br />
Interface element<br />
to simulate<br />
freeze bond<br />
b: Simulation (total strains)<br />
Figure 6: Failure mechanism in plain strain test<br />
(a) Plastic (red) and Tension cut-off (white) points (b) Relative shear stresses (red = 1)<br />
Figure 10. Stress state inside the ice rubble at the ultimate failure.<br />
Horizontal translation is constrained<br />
Vertical translation is constrained<br />
Figure 11: FE model of the direct shear box test
<strong>Plaxis</strong> Practice<br />
Finite element modelling of ice rubble<br />
<strong>Plaxis</strong> and GeoDelft<br />
Continuation<br />
Klaas Jan Bakker<br />
At the confining pressure p of 1 kPa the rubble failed in tension, i.e. the tensile stresses<br />
at the contacts between the blocks exceeded their tensile strength. The failure mode<br />
changed with increase of p and became a combination of tension and shear modes. Shear<br />
failure dominated at p = 10 kPa.<br />
A good correlation was found between the interface strength (i.e. freeze bond strength) in<br />
the pseudo-discrete model and the equivalent cohesion (i.e. shear strength) in the continuum<br />
model. At present, a research project is ongoing to study the freeze bond strength<br />
between the ice blocks in-situ. This knowledge would enable to provide better assessment<br />
of the ice rubble shear strength, both in time and space, which can then be used in practical<br />
engineering applications.<br />
resulted in a quite approximate description of the ice rubble strength. The numerical<br />
tools such as FEM in general and the PLAXIS code in particular are believed to be useful<br />
in planning and analysing the non-standard tests as well as performing further applied<br />
analyses. Ice rubble resembles granular materials and therefore the soil material models<br />
can be used to simulate its behaviour.<br />
References<br />
Jensen, A., 2002. Evaluation of concepts for loading of hydrocarbons in ice-infested<br />
waters. PhD Thesis, Norwegian University of Science and Technology, Department of<br />
Structural Engineering.<br />
P. Liferov, A. Jensen, K.V. Høyland and S. Løset, 2002. On analysis of punch tests on ice<br />
rubble. 16 th International Symposium on Ice (IAHR’02), Dunedin, New Zealand, December<br />
2002, vol. 2, pp. 101-110.<br />
P. Liferov, A. Jensen and K.V. Høyland, 2003. 3D finite element analysis of laboratory punch<br />
tests on ice rubble. Proceedings of the 17 th Conference on Port and Ocean Engineering<br />
under Arctic conditions (POAC), Trondheim, Norway, June 16-<strong>19</strong>, vol. 2, pp. 611-623.<br />
Liferov, P. and Bonnemaire, B., 2004. Ice rubble behaviour and strength, Part I: Review<br />
of testing methods and interpretation of results. Journal of Cold Regions Science and<br />
Technology, 41: 135-151.<br />
Liferov, P., 2004. Ice rubble behaviour and strength, Part II: Modelling. Journal of Cold<br />
Regions Science and Technology, 41: 153-163.<br />
Since GeoDelft and PLAXIS signed their Memorandum of Understanding on further<br />
cooperation, much progress has been made.<br />
Among other things, GeoDelft and <strong>Plaxis</strong> have undertaken the update of their<br />
mutual product PlaxFlow. As a first step that will eventually lead to the development of<br />
PlaxFlow 3D, an update of the present 2D product PlaxFlow was decided for. The direct<br />
occasion to undertake this job was the development of the multi-language user interface<br />
for <strong>Plaxis</strong> 2D, which will eventually enable a Chinese and Japanese version of the <strong>Plaxis</strong><br />
User interface. This update is in a finishing stage when you read this <strong>Bulletin</strong>.<br />
Besides that, a new product development line has been undertaken in a mutual project<br />
between GeoDelft, Stuttgart University (Prof Pieter Vermeer) and <strong>Plaxis</strong>. The project is<br />
aimed at the development of a new analysis tool for large deformations, such as for<br />
cone-penetration and excavation problems, see Figure 1, and most likely for a number of<br />
offshore problems such as spud can installation.<br />
The method, known as Material Point Method or sometimes referred to as Particle In Cell<br />
method, has shown some major progress in the last decade. Originally some two decades<br />
ago, the method appeared in fluid dynamics. Later on the method was adopted by some<br />
universities which modified the equations to solve geotechnical problems. Amongst these<br />
first geotechnical developers are well-known researchers as Prof Schreyer, University<br />
of Albuquerque in New Mexico, Prof. Wieckowski from Lodz University in Poland, and Dr<br />
Coetzee from Stellenbosch University in South Africa. With the latter a cooperation and<br />
support agreement has been achieved to upgrade his 2D formulation into a 3D version<br />
using <strong>Plaxis</strong>. For those who are familiar with the formulation of the Finite Element Method,<br />
the material points in MPM might roughly be compared to moving integration points in a<br />
FEM formulation. Therefore it was decided to use the <strong>Plaxis</strong> 3D source code as a basis for<br />
the further development of a 3D MPM code. At this moment Dr Claus Wisser has started<br />
working at Stuttgart University IGS with Prof Vermeer, to develop a static version of the<br />
code. We are looking forward for his first results in roughly about one and a half years.<br />
Further <strong>Plaxis</strong> and GeoDelft intend to upgrade the compatibility between the <strong>Plaxis</strong> and<br />
GeoDelft Software by making interactions between a number of Delft Geosystem software<br />
products and <strong>Plaxis</strong> V8. The results of these developments are foreseen in the upcoming<br />
year. On the longer term it is decided to match the <strong>Plaxis</strong> and GeoDelft software range upto<br />
a compatible series of software for geotechnial purposes, where Delft geosystem software<br />
is aimed at application oriented software products for Geotechnical design and <strong>Plaxis</strong> is<br />
aimed at general purpose analysis software for geo-engineering in 2D and 3D.<br />
Further <strong>Plaxis</strong> and GeoDelft have decided to increase their cooperation with respect to<br />
international marketing by using their mutual international networks and e.g. combining<br />
efforts in the case of presence at international conferences and business fairs.<br />
Figure 12: Direct shear box test: t vs. p diagram<br />
Discussion<br />
Mechanical properties of ice rubble is a relatively new item in the engineering ice<br />
research. Practical difficulties with conducting both the laboratory and the in-situ tests<br />
Dead Load<br />
Virgin Material<br />
Bucket Displacement = 800 mm<br />
Figure 1: Example of 2D Material Point Method analysis for large deformation analysis, e.g. bucket excavation, by Coetzee<br />
10 11
<strong>Plaxis</strong> Practice<br />
<strong>Plaxis</strong> Practice<br />
Simulation of soil nail in large scale direct shear test<br />
Arny Lengkeek, Witteveen+Bos<br />
Marco Peters, Grontmij Netherlands<br />
Introduction<br />
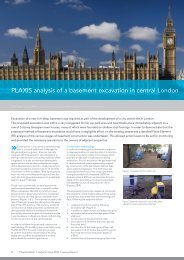
In the Netherlands we have a history of living with water. Dikes, both at the sea and at rivers,<br />
need to protect us against flooding. The height of the dikes in the Netherlands needs<br />
to be increased in the future. Adjustment is needed because of climate changes, raising<br />
sea level and ongoing settlements. If raising of the crest level is required, stability is best<br />
increased by widening the dike. However, this is not possible in case of existing buildings<br />
at the land side and in the case narrowing of the river flow section is not allowed. Within<br />
this framework the project INnovations on Stability Improvement enabling Dike Elevations<br />
(INSIDE) started in 2001.<br />
Consortium INSIDE Squad, a Dutch co-operation between Boskalis b.v., Van Hattum en<br />
Blankevoort b.v., Grontmij b.v. and Witteveen+Bos b.v. developed a new concept “Dijkvernageling”,<br />
which stands for reinforcing dikes by soil nailing. This way steeper slopes are<br />
possible. Figure 1 shows the typical failure mechanism of a dike and the reinforcing by<br />
soil nailing. The soil nails add to the stability of the dike, but do not take over the full load.<br />
The dike keeps functioning the way it did for hundreds of years. The soil nails increase the<br />
internal strength of the dike in three ways:<br />
- anchorage of the sliding section;<br />
- increasing of the contact stress at the shear plane;<br />
- shear connection of the sliding section.<br />
Dike reinforcement by soil nailing is mainly achieved by the anchorage. However, the<br />
shear connection by the soil nails is important for the performance of the soil nail. The<br />
research is focued on the shear connection in clayey soils, as there is little experience on<br />
this subject.<br />
To investigate the behaviour of soil nail in clayey soils, large scale direct shear tests were<br />
executed to explore the strengthening effects with different types of soil nails in clayey<br />
soils. The tests were executed in the laboratory by two circular steel structures with a<br />
diameter of 0.9 m and a total height of 1.2 m. The soil nail was placed centric in the cylinder<br />
with a rotation possibility at the bottom. The upper ring could displace by horizontal<br />
loading, while the lower ring was fixed.<br />
Before performing the large scale direct shear tests, analytical and numerical finite element<br />
analyses (FEM) were carried out to define the soil nail properties such as diameter<br />
and bending stiffness in relation to the soil strength and the soil stiffness. After the<br />
tests, postdiction analyses were made to understand the behaviour and improve the FEM<br />
model.<br />
A total of fifteen large scale direct shear tests have been performed with different soil<br />
nails. Three of these tests have been performed without soil nails for reference, six tests<br />
have been performed on very soft clay and two tests have been performed with three soil<br />
nails in one cylinder.<br />
Typical soil nails that were used are:<br />
- steel rods with a grout body of about 3 to 6 cm;<br />
- carbon rods with a grout body of about 3 to 6 cm;<br />
- HDPE strips with a width of 10 to 15 cm.<br />
Soil behaviour in direct shear test<br />
A proper way to investigate the maximum shear stress in soil is the direct shear test. This<br />
test shows the relation between the present normal stress and the maximum mobilised<br />
shear stress. For a drained situation Coulomb derived the relation as:<br />
t = c + s n tanj<br />
In the case of undrained situations, one may asscume j = 0 and c = c u . Although the<br />
maximum shear stress could directly be obtained, there are some disadvantages about<br />
the direct shear test. The location of the deformation plane is prescribed, and the stress<br />
situation in the soil sample is not uniformly recorded. In contrast of the simple shear test,<br />
the displacements in a direct shear test are not homogeneous but lenticular shaped as<br />
shown in figure 2.<br />
Test result<br />
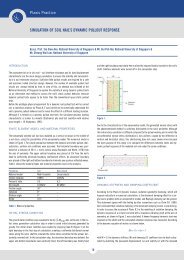
Figure 3 presents the test results of the large scale direct shear tests on soft clay. The<br />
saturated density is 17 kN/m³ and the undrained shear strength is 9 kN/m². The total jack<br />
force has been normalised by the total undrained shear strength of the cross section; this<br />
is called the strengthening ratio. A ratio of 1.0 is equal to the maximum strength of the<br />
soil, any increase is caused by the soil nails. The maximum strengthening of 1 soil nail<br />
at 20 cm displacement is about 25% (ratio is 1.25). For 3 soil nails it is 75%. The force<br />
by 3 soil nails is equal to 3 times that of 1 soil nail. It can be concluded that there is no<br />
negative group effect for soil nails in a close grid (less than 0.5 m).<br />
FE model in prediction analysis<br />
Due to nonsymmetrical loading, numerical analysis was not possible with axi-symmetric<br />
2D calculations. The use of PLAXIS 3D Tunnel makes it possible to simulate these large<br />
scale direct shear tests and 3D effects of the soil nailing properly.<br />
In the prediction analysis, several models were developed to simulate undrained<br />
behaviour of natural clay, see figure 4. In 3D Tunnel, the tunnel structure will normally be<br />
generated in a horizontal z-direction. To model an undrained situation without increasing<br />
effective stresses in y-direction perpendicular to the tunnel lining, the initial stress<br />
condition was created in the first calculation step by using a uniformly distributed z-load.<br />
The material model used in the prediction analysis is the Mohr-Coulomb model, with<br />
c = c u , E = E undr;50 and j set to zero. The different soil nails were modelled by a linear<br />
elastic tunnel structure with bending stiffness EI and extension stiffness EA.<br />
A<br />
B<br />
C<br />
Figure 1: Typical section of reinforced dike by soil nailing<br />
Figure 4: Developed models in prediction analysis<br />
Research<br />
Reinforcing embankments by soil nailing is a proven method to stabilise, especially in<br />
case of constructing a steeper slope in granular soils. But how does it work in dikes<br />
consisting of soft clay?<br />
The main investigation goals were defined as:<br />
- what is the behaviour of soil nails in soft clay in a direct shear mode;<br />
- what are the 3D and group effects of the soil nails;<br />
- is it possible to develop a design model.<br />
Figure 2: Large scale direct shear test<br />
Figure 3: Strengthening by soil nail in direct shear test with soft clay<br />
12 13
<strong>Plaxis</strong> Practice<br />
<strong>Plaxis</strong> Practice<br />
Simulation of soil nail in large scale direct shear test<br />
Continuation<br />
Postdiction model<br />
To postdict the large scale direct shear tests more properly and to obtain more accurate<br />
stress results, the 3D Tunnel model was modified by using gravity loading with an adapting<br />
gravitation direction parallel to the tunnel lining and with adapted boundary conditions.<br />
Moreover, an improved modelling of soil behaviour was considered by using the<br />
Hardening Soil model and by distinguishing between effective stresses and (excess) pore<br />
pressures using the undrained setting.<br />
Figure 5 presents the postdiction reference model without soil nail (half symmetric).<br />
The maximum calculated shear stress t yz was in fact equal to the input value used for the<br />
undrained shear stress (c = c u ). The shear stresses in the symmetric cross section also<br />
showed a lenticular development. Figure 6 presents the postdiction model with soil nail.<br />
There is an obvious interaction between the soil nail and the horizontal stresses.<br />
Soil properties prediction postdiction<br />
Model prediction A, B, C Mohr Coulomb Hardening Soil<br />
Analysis drained undrained<br />
Material type (clay) undrained undrained<br />
Unit weight 18.4 kN/m 3 18.4 kN/m 3<br />
Elastic modulus E 50 (ref.) 700 kPa 700 kPa<br />
Elastic modulus E oed (ref) - <strong>19</strong>73 kPa<br />
Elastic modulus E ur (ref) - 100 kPa<br />
Power m - 0.8<br />
Poisson’s ratio 0.49 0.20<br />
friction angle 1° 1°<br />
cohesion 7.5 kPa 27.5 kPa<br />
shear stress a: x-y plane z-x plane<br />
B + C: z-x plane<br />
initial stress z-load gravity loading (drained)<br />
The strengthening by a soil nail in a large scale direct shear test can also be determined<br />
with the postdiction model. First step is to perform postdiction analyses with soil nail.<br />
Second step is to switch off the soil nail and repeat the calculation. Figure 7 shows the<br />
difference between load-displacement curves of clay with soil nail and without soil nail.<br />
The strengthening ratio can be determined by the ratio of both analyses results.<br />
Comparison of results<br />
The strengthening effect has been determined by the interpretation of the measurements<br />
and the postdiction analyses with the 3D Tunnel model. The results of the strengthening<br />
ratio are presented in figure 8. The symmetry line represents the ideal relation between<br />
measurement and model. Most results do have a margin of less than 10% from this line.<br />
The results are very satisfying in particular because a variety of soil nails have been<br />
tested in normal and very soft clay. The 3D Tunnel model is capable to perform good<br />
postdiction analyses and can be used for future designs.<br />
Conclusions on modelling<br />
With regard to the presented results, one can conclude that PLAXIS 3D Tunnel offers a<br />
good tool to model the large scale direct shear tests. However, some suggestions how to<br />
obtain better results are presented below, as there is always room for improvement.<br />
Mesh refinement with smaller element sizes might lead to even better results, but using<br />
smaller elements could increase calculation time dramatically. Using a half space symmetric<br />
model was one of the methods to reduce calculation time.<br />
Further investigation on the influence of shaft friction between nail and soil and between<br />
soil and inner side of cylinder is recommended. The actual undrained shear strength is<br />
not constant in the different stress paths in the used model. Overconsolidation has been<br />
taken into account, but the degree of overconsolidation in the used clay after installation<br />
in the test rings is not recorded.<br />
One of the advantages of the 3D Tunnel postdiction model is the fact that identical soil<br />
conditions are compared with and without the application of a soil nail. In this way, some<br />
of the inadequacies in modelling leading to different results can be faded out.<br />
Table 1: Material models and material properties<br />
Figure 5: Postdiction reference model without nail, shear stresses<br />
Figure 8: Comparison of strengthening ratio by interpretation of measurements and by<br />
the postdiction model<br />
Figure 7: Postdiction model results, load-displacement curves with and without soil nail<br />
Figure 6: Postdiction model with soil nail, total stresses<br />
14 15
<strong>Plaxis</strong> Practice<br />
<strong>Plaxis</strong> Practice<br />
Staged construction of embankments on<br />
Soft Soil using <strong>Plaxis</strong><br />
Gautam Bhattacharya, Professor, Department of Civil Engineering, Bengal Engineering and Science University, Shibpur, Howrah 711 103, INDIA<br />
Sudip Nath, Graduate Student, Department of Civil Engineering, Bengal Engineering and Science University, Shibpur, Howrah 711 103, INDIA<br />
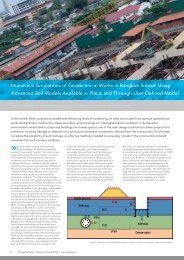
Introduction<br />
A problem, which is rather common in the fields of geotechnical and highway engineering,<br />
arises when road embankments of moderate to large heights are to be constructed on very<br />
soft soils with low shear strength and high compressibility in the shortest possible time.<br />
But, owing to the low shear strength of the subgrade (foundation) soil, the full height of<br />
the embankment cannot be built at a time and the so-called staged construction has to<br />
be resorted to. To implement such a phased construction it is required to carry out an<br />
analysis to determine beforehand the sequence of construction to be followed in a given<br />
situation such that the embankment can be constructed as quickly as possible while<br />
ensuring a reasonable margin of safety.<br />
Analysis of embankment stability using <strong>Plaxis</strong><br />
<strong>Plaxis</strong> (Version 8.0) has the provision for 2D (plane strain) stress-displacement as well<br />
as safety factor analysis of road embankments founded on layered deposit having any<br />
complex soil and pore water pressure conditions. Analysis can be done based on a number<br />
of options available, e.g., type of element, coarse mesh or fine mesh, soil models such as<br />
Mohr-Coulomb model (MC), Soft Soil Creep model (SSC), Hardening Soil model (HS) etc.<br />
Further, the updated mesh and consolidation options can be invoked for a more rigorous<br />
determination of embankment displacements and excess pore pressure dissipation.<br />
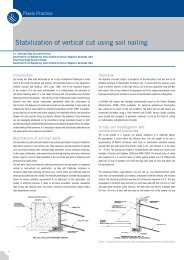
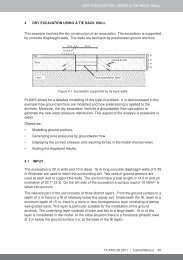
Figure 1: Road embankment on soft soil for the illustrative example<br />
Figure 2: <strong>Plaxis</strong> model<br />
included in the model and a fixed base is used instead (Figure 2). The properties of the<br />
different soil types are given in Table 1. In the initial conditions, the hydrostatic pore water<br />
pressures are based on a general phreatic level at the base of the clay layer.<br />
Safety Analysis for Staged construction<br />
Since it is required to construct the embankment in the shortest possible time, the time<br />
of construction in each stage should be such that it is just sufficient for the stability of<br />
the embankment up to that height for a target factor of safety. The time of construction,<br />
therefore, depends on the target factor of safety. The larger the factor of safety, longer<br />
will be the time of construction in each stage. After the construction of a certain stage,<br />
some time interval needs to be allowed for the improvement in undrained strength due to<br />
consolidation, which is required for the stability of the increased height in the next stage.<br />
Further, after the construction of the total height is over, some amount of time needs<br />
to be allowed for a certain percentage of consolidation to take place for which <strong>Plaxis</strong><br />
has a provision to calculate time of consolidation till the excess pore pressure becomes<br />
less than a certain pre-assigned value (e.g., 1.0 kN/m 2 ). Thus, the total time required<br />
includes the actual time of construction in each stage and the time interval between two<br />
consecutive stages as well as after the final stage of construction. If the construction<br />
sequence thus obtained is available to a practicing geotechnical engineer, for various<br />
target factor of safety, it will enable him to make a trade-off between the time available<br />
for the completion of the project and the amount of risk involved in selecting a particular<br />
target factor of safety.<br />
even after allowing a large time interval of more than 1000 days, the increased strength<br />
is still not sufficient to raise the embankment by another 2.0 m to its final height of 4.0<br />
m. It has therefore been decided to build the remaining height of 2.0 m in two stages, 1m<br />
in each stage, thus making it a 3-stage construction. In the second stage, the required<br />
minimum time interval comes out to be 75, 100 and 125 days corresponding to the target<br />
factor of safety at the end of construction of 1.10, 1.15, 1.20 and 1.25 respectively. In this<br />
case the minimum time of construction is 2, 10, 25 and 35 days respectively. Similarly, for<br />
the third stage, the minimum time interval and time of construction have been obtained.<br />
Finally, the minimum time interval between the completion of construction and the time of<br />
dissipation of excess pore water pressure to less than a value of 1 kN/m 2 has been found<br />
out. The entire sequence of construction thus obtained has been presented in Figure 3 for<br />
various target factor of safety. The long term factor of safety of the completed embankment<br />
is obtained as 1.390.<br />
Figure 4: Variation of Top Vertical Diplacement with FOS<br />
would perform satisfactorily during its design life. Now, as discussed before, for the planning<br />
of staged construction, the geotechnical designer has to adopt a target factor of<br />
safety. The engineering judgment to be applied in this case is obviously based on the<br />
displacement estimated to take place at the end of construction as well as long term. For<br />
the geotechnical engineer, therefore, it would be very useful, if a correlation is available<br />
between the target factor of safety and the estimated vertical displacement at the end of<br />
construction as well as at long term. Figure 4 presents such a correlation in the form of a<br />
plot of factor of safety against displacement.<br />
Utilizing the <strong>Plaxis</strong> updated mesh option, the above mentioned displacements have been<br />
re-evaluated and plotted against the target factor of safety in Figure 5. It may be mentioned<br />
here that such an analysis does not provide values of safety factor and, therefore,<br />
a revised construction sequence similar to Figure 3 cannot be obtained. However, it is<br />
observed that the time of consolidation following the end of construction comes out to<br />
be appreciably less than in the original analysis. This may allow the engineer-in-charge<br />
a little margin in this time interval before declaring the embankment ready for the construction<br />
of pavement structure.<br />
Summary and Conclusion<br />
In the present article an attempt has been made to demonstrate how the <strong>Plaxis</strong> (version<br />
8) can be effectively utilized in providing the practicing geotechnical engineers with all<br />
the relevant results of safety and displacement analyses that will enable him to exercise<br />
engineering judgment in deciding on a judicious sequence of staged construction of a<br />
road embankment. It is understandable that the sequence of construction depends on the<br />
target factor of safety at the intermediate stages; the higher the target factor of safety the<br />
longer it will take for the total construction to be completed. However, the displacement,<br />
especially the vertical displacement at the end of construction as well as at the long term<br />
should be of concern to the designer of such a project. The displacement is obviously<br />
inversely proportional to the total time allowed and hence the target factor of safety. Thus<br />
it is a trade-off between the time available at hand and the maximum permissible vertical<br />
displacement i.e. settlement of the embankment. Keeping this in mind, the results of the<br />
entire analysis have been summed up in the form of two plots – one giving the height of<br />
construction vs. time for various factor of safety and the other, vertical displacement vs.<br />
target factor of safety.<br />
Illustrative Example<br />
Description<br />
Figure 3: Construction sequence<br />
To illustrate the staged construction of a road embankment in the shortest possible time<br />
compatible with the safety requirements at the intermediate stages of construction as<br />
well as during its service life (long term), the embankment section exemplified in the<br />
Tutorial Manual (Lesson 5) has been selected for the present study (Figure 1).<br />
The geometry model, material sets, mesh generation and initial conditions adopted in the<br />
Tutorial Manual (Lesson 5) have been retained. Specifically, a plane strain model with<br />
15-node elements is utilized. The problem being symmetric, only one half is modeled.<br />
The deformations of the deep sand layer are assumed to be zero; hence this layer is not<br />
Results<br />
Sequence of construction<br />
In the first stage, by trial runs, it has been observed that a height of 2.0 m can be built by<br />
allowing a minimum time of construction as 4, 20, 50 and 70 days corresponding to target<br />
factor of safety at the end of construction of 1.10, 1.15, 1.20 and 1.25 respectively. Before<br />
the second stage of construction begins, it is required to allow a sufficient time interval<br />
for substantial strength increase due to consolidation. However, it has been observed that<br />
Figure 5: Variation of Top Vertical Diplacement with FOS (using Updated Mesh)<br />
Correlation Between Factor of Safety and Displacement<br />
Although safety analysis indicates the stability status of the embankment, a displacement<br />
analysis is of interest to ensure its serviceability requirement; in other words, the<br />
displacements occurring particularly at long term indicate whether the embankment<br />
Table 1: Material Properties of the road embankment and subsoil<br />
16 17
<strong>Plaxis</strong> Practice<br />
Recent activities<br />
Erwin Beernink<br />
<strong>Plaxis</strong> Staff<br />
We are pleased to announce that we appointed a new Course Coordinator. From February<br />
12 th European <strong>Plaxis</strong> User Meeting<br />
Around 80 participants attended the European <strong>Plaxis</strong> Users Meeting 2005, hosted by the<br />
<strong>Plaxis</strong> Asia<br />
In Asia we will enforce our activities with the assistance of William Cheang. William<br />
New products/updates<br />
In 2005 we worked hard on improvements of our products and services. Latest extensions<br />
1, <strong>2006</strong>, Dennis Waterman will take over the position of Wout Broere. Wout was working<br />
3 days at <strong>Plaxis</strong> bv and 2 days at Delft University . Wout got the opportunity to get a 4 days<br />
job at the University and he will continue his part of writing manuals of upcoming new<br />
<strong>Plaxis</strong> versions. Dennis has already a long <strong>Plaxis</strong> history with support and programming<br />
activities. Besides course coordination Dennis will also stay responsible for the first line<br />
support. During support peak periods he will be assisted by other <strong>Plaxis</strong> staff. Besides<br />
these internal changes <strong>Plaxis</strong> staff is extended with Eric Verschuur. Eric studied technical<br />
informatics and graduated at the Haagse Hogeschool and has a background in user interface<br />
development. He is currently working on upgrading the 3D Geothermic program.<br />
Due to continued growth, <strong>Plaxis</strong> bv has<br />
additional positions available for;<br />
- Software Quality Engineer<br />
- Senior Software Development Engineer<br />
- Programmer Graphical User Interface<br />
- Numerical Geophysicist/Geohydrologist<br />
See our website for detailed information.<br />
BundesAnstalt für Wasserbau in Karlsruhe, Germany. Many interesting presentations<br />
were given by engineering consultants and researcher, on geotechnical engineering applications,<br />
research-like projects, soil modelling aspects, parameter selection and other<br />
<strong>Plaxis</strong>-related subjects. In addition to the presentations, group discussions on special<br />
themes resulted in the generation and distribution of knowledge and new ideas.<br />
An extra day was devoted to user-defined soil models, where researchers presented<br />
implementational aspects and applications of special soil models. This day was not only<br />
visited by researchers, but also by consulting engineers with interest for advanced soil<br />
modelling<br />
Based on the number of participants and the positive comments during and after the<br />
meeting it can be concluded that the meeting was again very succesful. We are looking<br />
forward to the next European <strong>Plaxis</strong> users meeting in Karlsruhe in November <strong>2006</strong>.<br />
See the agenda on our website or the backcover of this bulletin for upcoming User<br />
Meetings and other activities.<br />
will act on behalf of <strong>Plaxis</strong> bv under the flag of “<strong>Plaxis</strong> Asia”. He will be involved in pre<br />
and after sales activities in Asian countries were we do not have an agent. Furthermore<br />
William will assist our agents to promote <strong>Plaxis</strong> products and services via conferences,<br />
courses and seminars. You can already get acquinted with him at the Asian Experienced<br />
<strong>Plaxis</strong> Users Course and Users Forum in Phuket, April 17-20. William did his undergraduate<br />
and Masters of Science degree at the University of East London, United Kingdom.<br />
Furthermore he did a doctoral study at the National University of Singapore under the<br />
title “Axial Soil Nail-Soil Interaction: Quasi-static Pullout Behaviour of Passive Bonded<br />
Inclusions in residual Soils”.<br />
For <strong>Plaxis</strong> activities in China a cooperation agreement has been signed between Prof. E.X.<br />
Song of Tsinghua University, Beijing and <strong>Plaxis</strong> bv. Professor Song has contributed in the<br />
past to the development of the <strong>Plaxis</strong> finite element program and the education to the<br />
<strong>Plaxis</strong> users. See also the updated <strong>Plaxis</strong> History at our website. Last months Prof. Song<br />
performed a quality check on the Chinese <strong>Plaxis</strong> version of the user interface and manual.<br />
We will also cooperate in the organization of Post Academic Computational Geotechnical<br />
Courses in China.<br />
can be downloaded from our website. <strong>Plaxis</strong> Version 8 update pack 7 has been extended<br />
with;<br />
- Steady state groundwater flow for axisymmetric problems has been reintroduced<br />
- The Modified Cam Clay model (has been added to the available soil models)<br />
- A set of revised manuals<br />
- Alternative examples (lesson 4 and 6) using the Hardening Soil model<br />
Furthermore some bugs have been solved including problems on East Asian Windows<br />
systems. From update pack 7 also the Chinese and Japanese version of <strong>Plaxis</strong> V8 are<br />
available.<br />
In Version 1.5 of 3DFoundation many new features are included like;<br />
- Consolidation analyses<br />
- Creep: secondary compression with the Soft Soil Creep model<br />
- New vertical elements: vertical beams, vertical line loads and vertical fixities<br />
- K0-procedure<br />
- Display of (volume) pile forces<br />
- Usage of stress points and nodes of structural elements for curves<br />
<strong>Plaxis</strong> User Meeting 2005<br />
A visited laboratory of the Bundes Anstalt für Wasserbau in Karlsruhe, Germany<br />
18 <strong>19</strong>
<strong>Plaxis</strong> finite element code for soil and rock analyses<br />
Activities <strong>2006</strong><br />
13 - 15 March <strong>2006</strong><br />
Finite Elemente in der Geotechnik,<br />
Theorie und Praxis - Stuttgart, Germany<br />
2 - 4 June <strong>2006</strong><br />
GeoShanghai International Conference<br />
Shanghai, China<br />
20 - 23 March <strong>2006</strong><br />
International Course for Experienced<br />
<strong>Plaxis</strong> Users - Antwerp, Belgium<br />
20 - 22 June <strong>2006</strong><br />
Course Computational Geotechnics<br />
Manchester, United Kingdom<br />
17 - <strong>19</strong> April <strong>2006</strong><br />
2nd Asian Course for Experienced<br />
<strong>Plaxis</strong> Users - Phuket, Thailand<br />
28 - 30 June <strong>2006</strong><br />
ICDE <strong>2006</strong> Deep Excavations -<br />
Singapore<br />
20 April <strong>2006</strong><br />
1st Asian Users Day - Phuket, Thailand<br />
18 - 22 April <strong>2006</strong><br />
100th Anniversary Earthquake Conference<br />
San Fransisco, U.S.A.<br />
22 - 27 April <strong>2006</strong><br />
ITA <strong>2006</strong> - Seoul, South Korea<br />
9 - 11 May <strong>2006</strong><br />
<strong>Plaxis</strong> Workshop<br />
Cairo, Egypt<br />
15 - 18 May <strong>2006</strong><br />
Curso Internacional de Geomecanica<br />
Computational - Valparaiso, Chile<br />
16 May <strong>2006</strong><br />
French <strong>Plaxis</strong> Users Meeting<br />
Paris, France<br />
29 - 31 May <strong>2006</strong><br />
XIII. Danube-European Conference on<br />
Geotechnical Engineering<br />
Ljubljana, Slovenia<br />
1 - 3 June <strong>2006</strong><br />
International Course on Computational<br />
Geotechnics - Ljubljana, Slovenia<br />
31 May-2 June <strong>2006</strong><br />
10th Piling and Deep Foundations<br />
Amsterdam, the Netherlands<br />
July <strong>2006</strong><br />
Short Course on Computational<br />
Geotechnics - Boulder, USA<br />
16 - 18 August <strong>2006</strong><br />
Standard Course on Computational<br />
Geotechnics - Johannesburg, South Africa<br />
27 - 31 August <strong>2006</strong><br />
COBRAMSEG <strong>2006</strong> - Curibita, Brazil<br />
6 - 8 September <strong>2006</strong><br />
6th European Conference on Numerical<br />
Methods in Geotechnical Engineering<br />
Graz, Austria<br />
29 - 30 September <strong>2006</strong><br />
Baugrund Tagung - Bremen, Germany<br />
9 - 11 November <strong>2006</strong><br />
European <strong>Plaxis</strong> User Meeting<br />
Karlsruhe, Germany<br />
13 - 15 November <strong>2006</strong><br />
Short Course on Computational<br />
Geotechnics - Trondheim, Norway<br />
November <strong>2006</strong><br />
Pratique éclairée des éléments finis<br />
en Géotechnique - Paris, France<br />
December <strong>2006</strong><br />
Dutch <strong>Plaxis</strong> Users Meeting<br />
Delft, The Netherlands<br />
<strong>Plaxis</strong> BV<br />
PO Box 572<br />
2600 AN Delft<br />
The Netherlands<br />
Tel: +31 (0)15 251 77 20<br />
Fax: +31 (0)15 257 31 07<br />
E-Mail: info@plaxis.nl<br />
Website: www.plaxis.nl<br />
5004866