UBC3D-PLM (REPORT).June2013.pdf - Knowledge Base - Plaxis
UBC3D-PLM (REPORT).June2013.pdf - Knowledge Base - Plaxis
UBC3D-PLM (REPORT).June2013.pdf - Knowledge Base - Plaxis

You also want an ePaper? Increase the reach of your titles
YUMPU automatically turns print PDFs into web optimized ePapers that Google loves.
PLAXIS LIQUEFACTION MODEL<br />
<strong>UBC3D</strong>-<strong>PLM</strong><br />
Alexandros Petalas<br />
Assistant Researcher, PLAXIS B.V<br />
Vahid Galavi<br />
Researcher, PLAXIS B.V<br />
June 7, 2013
Contents<br />
1 Key Features of <strong>UBC3D</strong> 2<br />
1.1 Yield Surfaces . . . . . . . . . . . . . . . . . . . . . . . . . . . 3<br />
1.2 Elasto-plastic Behaviour and Hardening Rule . . . . . . . . . 6<br />
1.3 Plastic Potential Function . . . . . . . . . . . . . . . . . . . . 8<br />
1.4 Flow Rule . . . . . . . . . . . . . . . . . . . . . . . . . . . . . 9<br />
1.5 Cyclic Mobility and Stress Reversal . . . . . . . . . . . . . . . 10<br />
1.6 Post-liquefaction rule and cyclic mobility . . . . . . . . . . . . 13<br />
1.7 Undrained behaviour in <strong>UBC3D</strong>-<strong>PLM</strong> . . . . . . . . . . . . . 14<br />
1.8 Parameter selection, summary of the <strong>UBC3D</strong> input parameters<br />
and state variables . . . . . . . . . . . . . . . . . . . . . . 16<br />
2 Validation of the <strong>UBC3D</strong> in various stress paths and a finite<br />
element scheme 24<br />
2.1 Validation of the reformulated <strong>UBC3D</strong>-<strong>PLM</strong> in monotonic<br />
loading . . . . . . . . . . . . . . . . . . . . . . . . . . . . . . . 24<br />
2.2 Validation of the <strong>UBC3D</strong>-<strong>PLM</strong> in cyclic loading . . . . . . . 26<br />
2.3 Validation of the <strong>UBC3D</strong>-<strong>PLM</strong> in a finite element scheme . . 32<br />
2
List of Figures<br />
1.1 The intersection of the six planes and finally the yield surface<br />
in 3-D principal stress space. From Tsegaye (2010) . . . . . . 4<br />
1.2 Projection of the yield surface in the deviatoric plane . . . . . 5<br />
1.3 Systematization of the yield surfaces in p’-q stress space . . . 6<br />
1.4 The original UBCSAND’s Hardening Rule . . . . . . . . . . . 8<br />
1.5 Graphical representation of the modified Rowe’s flow rule as<br />
used in <strong>UBC3D</strong>-<strong>PLM</strong> . . . . . . . . . . . . . . . . . . . . . . 10<br />
1.6 Proposed reformulation of the <strong>UBC3D</strong>-<strong>PLM</strong> for cyclic loading 22<br />
1.7 Undrained cyclic shear stress path reproduced with <strong>UBC3D</strong>-<br />
<strong>PLM</strong> for dense sand. Main features. . . . . . . . . . . . . . . 23<br />
2.1 Validation of the <strong>UBC3D</strong>-<strong>PLM</strong> under monotonic triaxial compression.<br />
. . . . . . . . . . . . . . . . . . . . . . . . . . . . . . 25<br />
2.2 Validation of the <strong>UBC3D</strong>-<strong>PLM</strong> under monotonic direct simple<br />
shear. . . . . . . . . . . . . . . . . . . . . . . . . . . . . . 26<br />
2.3 Evolution of excess pore pressures during simple shearing on<br />
Fraser sand (RD=40%). CSR=0.08. σ v =100 kPa. . . . . . . 29<br />
2.4 Evolution of excess pore pressures during simple shearing on<br />
Fraser sand (RD=40%). CSR=0.1. σ v =100 kPa. . . . . . . . 30<br />
2.5 Evolution of excess pore pressures during simple shearing on<br />
Fraser sand (RD=40%). CSR=0.12. σ v =100 kPa. . . . . . . 30<br />
3
2.6 Evolution of shear strains during undrained simple shearing.<br />
Fraser sand (RD=40%). CSR=0.1. σ v =100 kPa. . . . . . . . 31<br />
2.7 Over-produce of hysteretic damping from the <strong>UBC3D</strong>-<strong>PLM</strong><br />
constitutive model. . . . . . . . . . . . . . . . . . . . . . . . . 31<br />
2.8 Comparison of the predicted evolution of excess pore pressure<br />
by the <strong>UBC3D</strong> with the experimental results published by<br />
Byrne et al. (2004). . . . . . . . . . . . . . . . . . . . . . . . 33<br />
4
List of Tables<br />
1.1 Input Parameters for the <strong>UBC3D</strong>. . . . . . . . . . . . . . . . 20<br />
1.2 State variables of the <strong>UBC3D</strong>. . . . . . . . . . . . . . . . . . 21<br />
2.1 Model parameters used to simulate undrained behaviour of<br />
loose Syncrude sand. . . . . . . . . . . . . . . . . . . . . . . . 27<br />
2.2 Input parameters for the validation of the <strong>UBC3D</strong>-<strong>PLM</strong> in<br />
modelling cyclic element tests and a dynamic centrifuge test. 28<br />
5
Abstract<br />
In this report the formulation of the <strong>UBC3D</strong> constitutive model as implemented<br />
in PLAXIS is presented. The <strong>UBC3D</strong> is a 3-D generalized formulation<br />
of the original 2-D UBCSAND model introduced by Puebla et al. (1997).<br />
The initial 3-D implementation in PLAXIS was presented by Tsegaye (2010).<br />
An improved version is developed by the authors and the final model is presented<br />
together with a validation in different monotonic and cyclic stress<br />
paths. <strong>UBC3D</strong>-<strong>PLM</strong> consists a relatively simple but powerful approach<br />
in order to model the onset of the liquefaction phenomenon. In Chapter<br />
1 the main features of the <strong>UBC3D</strong>-<strong>PLM</strong> are presented. The model utilises<br />
isotropic and simplified kinematic hardening rules for primary and secondary<br />
yield surfaces, in order to take into account the effect of soil densification<br />
and predict a smooth transition into the liquefied state during undrained<br />
cyclic loading. By means of a simplified Rowe stress-dilatancy theory the<br />
model is capable of modelling cyclic liquefaction for different stress paths.<br />
Post liquecation behaviour of loose sands and cyclic mobility of dense sands<br />
can be modelled in terms of a stifness degradation rule. In Chapter 2 the<br />
validation of the model in monotonic and cyclic stress paths is discussed.<br />
Moreover,the performance of the model in a finite element scheme is investigated<br />
and the numerical modelling of a dynamic centrifuge test with<br />
PLAXIS 2D Dynamics is presented. The ability of the model to capture<br />
the onset of liquefaction is thoroughly discussed. The capabilities and the<br />
limitations are highlighted and recommendations for the use of the model<br />
are summarized.
Chapter 1<br />
Key Features of <strong>UBC3D</strong><br />
The <strong>UBC3D</strong>-<strong>PLM</strong> model has been developed by Tsegaye (2010) and implemented<br />
as a user-defined model in PLAXIS. It is closely based on the<br />
UBCSAND model introduced by Puebla et al. (1997), Beaty and Byrne<br />
(1998). The original UBCSAND is a 2-D model developed for prediction of<br />
liquefaction in sandy soils. Its formulation is based on classical plasticity<br />
theory with a hyperbolic strain hardening rule, based on the Duncan-Chang<br />
approach with modifications. The hardening rule relates the mobilized friction<br />
angle to the plastic shear strain at a given stress. It contains a 2-D<br />
Mohr-Coulomb yield surface and a corresponding non-associated plastic potential<br />
function. The flow rule in the model is based on the stress-dilatancy<br />
theory developed by Rowe (1962), linearised and simplified according to<br />
energy considerations.<br />
The main difference between the UBCSAND model and the <strong>UBC3D</strong><br />
model is the latter generalized 3-D formulation. The <strong>UBC3D</strong> model uses the<br />
Mohr-Coulomb yield condition in a 3-D principal stress space. Moreover, a<br />
modified non-associated plastic potential function based on Drucker-Prager’s<br />
criterion is used, in order to maintain the assumption of stress-strain coaxiality<br />
in the deviatoric plane for a stress path beginning from the isotropic<br />
line (Tsegaye, 2010).<br />
2
Comparing with the previous version of UCB3D implemented in PLAXIS,<br />
in the latest version a correction is made in the equation of the plastic multiplier<br />
which governs the constitutive relationship between the stresses and<br />
strains and higher accuracy is succeeded during monotonic loading. Finally,<br />
a soil densification rule added in order to predict a more realistic evolution<br />
of excess pore pressures during cyclic loading. This allows the increase of<br />
the volumetric strains with a decreasing rate during shearing. Moreover, the<br />
bulk modulus of water is depended with the degree of saturation which is<br />
specified via PLAXIS input and this user defined model can be used in the<br />
Advanced calculation mode of PLAXIS.<br />
The main characteristics of the model as implemented by (Tsegaye, 2010)<br />
and modified by the authors are presented in the following sections.<br />
1.1 Yield Surfaces<br />
The <strong>UBC3D</strong>-<strong>PLM</strong> model uses the well known Mohr-Coulomb yield function<br />
generalized in 3-D principal stress space. In order to understand how the<br />
algorithm deals with the complexity of the 3-D representation of the yield<br />
surfaces, the full set of the Mohr-Coulomb yield functions are introduced<br />
(pressure is positive, tension is positive):<br />
f 1a = 1 2 (σ′ 2 − σ ′ 3) + 1 2 (σ′ 2 + σ ′ 3) sin φ ′ − c ′ cos φ ′ (1.1)<br />
f 1b = 1 2 (σ′ 3 − σ ′ 2) + 1 2 (σ′ 3 + σ ′ 2) sin φ ′ − c ′ cos φ ′ (1.2)<br />
f 2a = 1 2 (σ′ 3 − σ ′ 1) + 1 2 (σ′ 3 + σ ′ 1) sin φ ′ − c ′ cos φ ′ (1.3)<br />
f 2b = 1 2 (σ′ 1 − σ ′ 3) + 1 2 (σ′ 1 + σ ′ 3) sin φ ′ − c ′ cos φ ′ (1.4)<br />
3
f 3a = 1 2 (σ′ 1 − σ ′ 2) + 1 2 (σ′ 1 + σ ′ 2) sin φ ′ − c ′ cos φ ′ (1.5)<br />
f 3b = 1 2 (σ′ 2 − σ 1) ′ + 1 2 (σ′ 2 + σ 1) ′ sin φ ′ − c ′ cos φ ′ (1.6)<br />
The six combinations of the principal stresses in the equations define six<br />
planes in 3-D principal stress space. These planes defines the Mohr-Coulomb<br />
yield surface as presented in Figure 1.1. The projection of the yield surface<br />
in the π -plane is presented in Figure 1.2.<br />
Figure 1.1: The intersection of the six planes and finally the yield surface<br />
in 3-D principal stress space. After Tsegaye (2010).<br />
The first step that has to be done by the model is to compute the principal<br />
stresses of the stress tensor. This is done after solving the eigenvalue<br />
problem. The eigenvalues give the principal stresses and the eigenvectors<br />
will be their directions. As far as isotropic behaviour is concerned the directions<br />
of the principal stresses are fixed (rotation of the principal stresses<br />
is not included in <strong>UBC3D</strong>-<strong>PLM</strong>) so the material response is not dependent<br />
on the orientation. After the determination of the three principal stresses<br />
4
Figure 1.2: Projection of the yield surface in the deviatoric plane. After<br />
Tsegaye (2010).<br />
the yield surface has to be defined. Considering any stress path in the generalized<br />
3-D stress space visualized in the deviatoric plane, the yield surface<br />
which will be first activated is given by the equation in which the maximum<br />
difference between two principal stresses is being used. The critical yield<br />
surface in the model is given by Equation 1.7:<br />
f m = σ′ max − σ ′ min<br />
2<br />
( σ<br />
′<br />
− max + σ min<br />
′ )<br />
+ c ′ cot φ ′ p sin φ mob (1.7)<br />
2<br />
The above presented equation is derived by the Mohr-Coulomb failure<br />
criterion using the maximum and the minimum principal stress as well as<br />
the mobilized friction angle (see Section 1.2). In order to compute Equation<br />
1.7 the principal stresses are sorted as follows:<br />
−σ 1 ≥ −σ 2 ≥ −σ 3 (1.8)<br />
After the sorting and the development of the yield surface, three possible<br />
stress paths can be produced by the model, in one of the six parts of the<br />
π-plane; triaxial compression, triaxial extension and regular stress path, as<br />
depicted in Figure 1.2.<br />
5
Referred to as the apex term, c cot φ p defines the point where the yield<br />
surface intersects the mean effective stress axis (p) (see Figure 1.3). Usually,<br />
in granular soils, the cohesion is zero, so the intersection would be located<br />
at the origin of the coordinate system (0,0).<br />
Figure 1.3: Systematization of the yield surfaces in p-q stress space. After<br />
Tsegaye (2010).<br />
When the stress state is inside the space defined by the yield surfaces<br />
elastic behaviour is assumed. However, once the stress path touches the<br />
yield surface plasticity starts to occur. After the reformulation made by<br />
the authors the latest version of the <strong>UBC3D</strong>-<strong>PLM</strong> has two yield surfaces in<br />
order to distinguish between the primary and the secondary loading and to<br />
ensure a smooth transition to the liquefied state. This mechanism is better<br />
explained in Section 1.5. The elasto-plastic behaviour of the model will be<br />
analytically presented in the next paragraph.<br />
1.2 Elasto-plastic Behaviour and Hardening Rule<br />
The elastic behaviour which occurs within the yield surface is governed by a<br />
non-linear rule. Two parameters control this non-linear behaviour; the elastic<br />
bulk modulus K and the elastic shear modulus G. These two moduli are<br />
stress dependent and the relationships are given in the following equations:<br />
6
( ) me<br />
p<br />
K = KBP e A (1.9)<br />
P ref<br />
( ) ne<br />
p<br />
G = KGP e A (1.10)<br />
P ref<br />
where KB e and Ke G are the bulk and the shear modulus respectively, at a<br />
reference stress level. The factors ne and me are parameters define the rate<br />
of stress dependency of stiffness. In the literature, the reference stress level<br />
(p ref ) is commonly taken as the atmospheric pressure (P A =100 kPa). Pure<br />
elastic behaviour is predicted by the model during the unloading process.<br />
Once the stress state reaches the yield surface, plastic behaviour is predicted<br />
as long as the stress point is not going immediately back into the<br />
elastic zone. More specifically, plastic hardening based on the principal<br />
of strain hardening is used in the model. The hardening rule governs the<br />
amount of plastic strain (irrecoverable deformation) as a result of mobilization<br />
of the shear strength (sin φ mob ). The mobilized friction angle derived<br />
from the Mohr-Coulomb yield criterion (1.7) is given as:<br />
sin φ mob = σ′ 1 − σ′ 3<br />
σ ′ 1 + σ′ 3<br />
= t mob<br />
s ′ (1.11)<br />
where t mob is the mobilized shear stress and s is the mean effective stress<br />
(s).<br />
The hyperbolic hardening rule (Beaty and Byrne, 1998) is presented<br />
schematically in Figure 1.4. It relates the increment of the sine of the mobilized<br />
friction angle to the plastic shear strain increment as follows (Puebla<br />
et al., 1997):<br />
G ⋆ = k p G<br />
δγ p =<br />
( 1<br />
G ⋆ )<br />
δ sin φ mob (1.12)<br />
( p<br />
′ ) np<br />
{ ( ) } 2<br />
sin φmob<br />
1 −<br />
R F (1.13)<br />
P A sin φ peak<br />
7
where k p G<br />
is the plastic shear modulus number; np is the plastic shear<br />
modulus exponent; φ mob is the mobilized friction angle, which is defined by<br />
the stress ratio; φ peak is the peak friction angle; and R f is the failure ratio<br />
n f /n ult , ranging from 0.5 to 1.0, where n f is the stress ratio at failure and<br />
n ult is the asymptotic stress ratio from the best fit hyperbola.<br />
The hardening rule as reformulated by Tsegaye (2010) in <strong>UBC3D</strong>-<strong>PLM</strong><br />
model is given as:<br />
Figure 1.4: The original UBCSAND’s Hardening Rule.<br />
Byrne (1998)<br />
From Beaty and<br />
d sin φ mob = 1.5K p G<br />
( ) (<br />
p<br />
np<br />
p A<br />
1 − sin φ ) 2<br />
mob<br />
R f dλ (1.14)<br />
p A p m sinφ peak<br />
where dλ is the plastic strain increment multiplier.<br />
1.3 Plastic Potential Function<br />
The plastic potential function specifies the direction of the plastic strain.<br />
A non-associated flow rule based on the Drucker-Prager plastic potential<br />
function is used in the <strong>UBC3D</strong>-<strong>PLM</strong> (Tsegaye, 2010).<br />
The plastic potential function is formulated as:<br />
8
g = q − a ( p ′ + c cot φ p<br />
)<br />
(1.15)<br />
a =<br />
√<br />
3 sin ψmob<br />
cos θ +<br />
sin θ sin ψ<br />
√<br />
3<br />
(1.16)<br />
where θ equals 30 ◦ cause the Drucker-Prager surface is fixed in the compression<br />
point.<br />
1.4 Flow Rule<br />
In the <strong>UBC3D</strong>-<strong>PLM</strong> model the flow rule of the original UBCSAND model<br />
is used, which is derived from energy considerations by Puebla et al. (1997).<br />
The flow rule used in UBCSAND is based on three observations: 1. there<br />
is a unique stress ratio, defined by the constant volume friction angle φ cv ,<br />
for which plastic shear strains do not cause plastic volumetric strains; 2.<br />
stress ratios which lie below sin φ cv exhibit contractive behaviour, while<br />
stress ratios above sin φ cv lead to a dilative response; and, 3. the amount of<br />
contraction or dilation depends on the difference between the current stress<br />
ratio and the stress ratio at sin φ cv .<br />
The relationship is given as follows:<br />
dɛ p v = sin ψ m dγ p (1.17)<br />
sin ψ m = sin φ m − sin φ cv (1.18)<br />
where, dɛ p v is the plastic volumetric strain increment and φ cv is the constant<br />
volume friction angle. A graphical representation of the flow rule is<br />
give in Figure 1.5.<br />
9
Sine of the Mobilized Dilatancy Angle (º)<br />
sinψmob(max)<br />
-sinψmob(max)<br />
Dilative area<br />
sinφcv<br />
Contractive area<br />
sinφpeak<br />
Sine of the Mobilized Friction angle (º)<br />
Figure 1.5: Graphical representation of the modified Rowe’s flow rule as<br />
used in <strong>UBC3D</strong>-<strong>PLM</strong>.<br />
1.5 Cyclic Mobility and Stress Reversal<br />
<strong>Base</strong>d on the mobilized friction angle an unloading-reloading criterion is<br />
defined in the model as follows:<br />
sin φ e m < sin φ 0 m(Unloading; elastic behaviour.) (1.19)<br />
sin φ e m > sin φ 0 m(Loading or reloading; plastic behaviour.) (1.20)<br />
The previous mobilized friction angle (sin φ o m) is memorized from the<br />
previous calculation step, while the current one (sin φ e m) is calculated based<br />
on the current stresses. During loading, the friction angle is mobilized, and<br />
hardening plasticity occurs. During unloading, pure elastic behaviour is<br />
predicted until the stress point reaches the p ′ axis.<br />
A soil densification rule was introduced in the latest verion of the <strong>UBC3D</strong>-<br />
<strong>PLM</strong> in order to have higher accuracy in the predicted evolution of the excess<br />
pore pressures. A secondary yield surface was introduced in the model for<br />
10
the secondary loading in order to ensure a smooth transition into the liquefied<br />
state of the soil. This enables the distinction between primary and<br />
secondary loading.<br />
The secondary yield surface generates less plastic strains compared to the<br />
primary yield surface. An isotropic hardening rule is used for the primary<br />
yield surface, while a simplified kimematic hardening rule is used for the<br />
secondary surface. The plastic shear modulus K p G<br />
during primary loading<br />
is identical with the one entered as input parameter by the user and is used<br />
in the hardening rule governing the hardening of the primary yield surface.<br />
The plastic shear modulus K p G<br />
during the secondary loading is formulated<br />
as a function of the number of cycles followed during the loading process<br />
in order to capture the effect of soil densification during drained shearing<br />
reported by many researchers in the literature (Martin et al., 1975).<br />
A simple rule based on stress reversals from loading to unloadind and<br />
vise versa is used in order to define the counting of cycles. This leads to an<br />
increase of the excess pore pressure during uncdrained cyclic loading with a<br />
decreasing rate until the liquefied state is approached.<br />
The modification of the plastic shear modulus during the secondary loading<br />
is as follows:<br />
(<br />
K p G = Kp G ∗ 4 + n )<br />
rev<br />
∗ hard ∗ fac hard (1.21)<br />
2<br />
where n rev is the number of shear stress reversals from loading to unloading<br />
or vice versa, hard is a factor which is correcting the densification rule for<br />
loose soils and fac hard is a multiplier which is a user input parameter to<br />
adjust the densification rule.<br />
A correction is made in the densification rule for loose sands (5 ≤ N1 60 ≤<br />
9) according to the experimental observations and following the formulation<br />
of the UBCSAND proposed by Beaty and Byrne (2011) and reported by<br />
Naesgaard (2011). The correction rule is as follows:<br />
11
hard = min(1, max(0.5, 0.1N1 60 ) (1.22)<br />
The plastic shear modulus is limited according to the maximum corrected<br />
SPT value (N1 60 ) of corresponding dense soils (Equation 1.23). The<br />
maximum N1 60 for a very dense soil is defined as 60.<br />
K p G,max = Ke G ∗ (maxN1 2 60,max)0.003 + 100 (1.23)<br />
This rule is the result of calibrating a number of direct simple shear<br />
tests. Thus, the calibration factor plays a key role when the user wants to<br />
model different stress paths (cyclic triaxial tests etc.) and the final value is a<br />
matter of judgement according to the most critical stress path for a specific<br />
problem. It finally leads to an increase of the excess pore pressure during<br />
undrained cyclic loading until the liquefied state is approached. The rate of<br />
generation of excess pore pressure decreases by increasing number of cycles<br />
which is proven via experiments.<br />
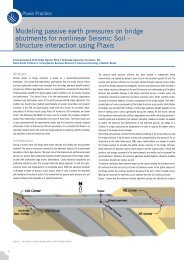
The new yield surfaces are schematically presented in Figure 1.6.<br />
In<br />
Case a, primary loading occurs during the first half cycle in an arbitrary<br />
simple shear test starting from the p ′ axis. The initial input parameter for<br />
the plastic shear modulus K p G<br />
is used and both yield surfaces expand until<br />
the maximum stress state.<br />
In Case b, elastic unloading occurs and the secondary yield surface<br />
shrinks until it reaches the isotropic axis where sin φ mob is very small. A<br />
half cycle is counted. Since an isotropic hardening rule is used for the primary<br />
yield surface, it remains at the maximum stress state reached since<br />
the beginning of the test.<br />
In Case c secondary loading occurs but with an identical plastic shear<br />
modulus as used in primary loading followed by elastic unloading. A full<br />
cycle is counted. After the full cycle the densification rule is activated.<br />
12
In Case d secondary loading occurs with a plastic shear modulus 4.5 times<br />
stiffer than used in primary loading. The secondary yield surface expands<br />
until it reaches the maximum stress state of the primary yield surface. Then<br />
primary loading is predicted again until the new maximum stress state.<br />
Finally, in case e, when the primary yield surface touches the peak stress<br />
state (governed by the peak friction angle) the secondary yield surface is deactivated.<br />
After the deactivation of the secondary yield surface the primary<br />
loading surface is used again.<br />
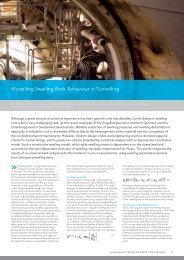
1.6 Post-liquefaction rule and cyclic mobility<br />
One important issue during the modelling of cyclic liquefaction in sands<br />
is the volumetric locking. The evolution of the volumetric strains, after<br />
the stress path reaching the yield surface defined by the peak friction angle,<br />
becomes constant due to the formulation of the flow rule (in Equation (1.18)<br />
sin φ ′ mob becomes sin φ′ p and remains constant while sin φ ′ cv is also constant.<br />
Due to this issue the stiffness degradation of the soil due to the postliquefaction<br />
behaviour of loose non-cohesive soils or due to the cyclic mobility<br />
of dense non-cohesive sands, which is observed in the experimental<br />
studies, cannot be modelled. This limitation is solved in the formulation of<br />
the <strong>UBC3D</strong>-<strong>PLM</strong> with the implementation of an equation which gradually<br />
decreases the plastic shear modulus as a function of the generated plastic<br />
deviatoric strain during dilation of the soil element. The stiffness degradation<br />
is formulated based on the plastic deviatoric strain related with the<br />
dilation of the soil element, due to the deconstruction of the soil skeleton<br />
which occurs during dilative behaviour. This leads to the decreased soil<br />
stiffness during contraction which follows after the unloading phase. This<br />
behaviour is presented in Figure 8 picturing the process of cyclic mobility<br />
of a dense sand. The stiffness degradation is computed as follows:<br />
13
K p G = Kp G,primary ∗ eE dil<br />
(1.24)<br />
E dil = min(110 ∗ ɛ dil , fac post ) (1.25)<br />
where ɛ dil is accumulation of the plastic deviatoric strain which is generated<br />
during dilation of the soil element. With the input parameter fac post<br />
the value of the exponential multiplier term in the above mentioned equation<br />
is limited. The above mentioned behaviour is schematized in Figure<br />
1.7.<br />
1.7 Undrained behaviour in <strong>UBC3D</strong>-<strong>PLM</strong><br />
The undrained behaviour of the soil is treated implicitly by the <strong>UBC3D</strong>-<br />
<strong>PLM</strong> constitutive model. Therefore, the increment of the pore water pressure<br />
is computed at each step of the analysis. Considering a saturated soil<br />
specimen, the increments in total stress during loading is given by the following<br />
equation:<br />
dp = K u dɛ v (1.26)<br />
where K u is the bulk modulus of the undrained soil and dɛ v the volumetric<br />
strain of the soil as a whole.<br />
The effective stress increment can be computed as follows:<br />
dp ′ = K ′ dɛ v (1.27)<br />
where K ′ is the bulk modulus of the soil skeleton and dɛ v its volumetric<br />
strain.<br />
The increments of the pore water pressure is computed with the following<br />
equation:<br />
14
dp w = K w<br />
n dɛ v (1.28)<br />
where K w is the bulk modulus of the water, n is the soil porosity and dɛ v is<br />
the volumetric strain of the fluid.<br />
The relationship between the total stresses, the effective stresses and the<br />
pore pressure is assumed according to Terzaghi’s theory (Equation 1.29).<br />
Moreover, the volumetric compatibility under undrained conditions requires<br />
that the equivalent fluid volumetric strain must be equal to the volumetric<br />
strain of the soil skeleton. Equation 1.30 is finally derived.<br />
dp = dp ′ + dp w (1.29)<br />
K w<br />
n = (K u − K ′ ) (1.30)<br />
Once K w is determined, then the excess pore pressures can be computed<br />
in each increment using Equation 1.28. The Poisson’s ratio for undrained<br />
condition is set as ν = 0.495 implicitly by the model. This value is close to<br />
the upper limit (of 0.5) as water is almost incompressible. Using a value of<br />
0.5 is to be avoided as this is known to cause numerical instabilities. <strong>Base</strong>d<br />
on this Poisson’s ratio the bulk modulus of the undrained soil is computed<br />
as follows:<br />
K u = 2Ge (1 + ν u )<br />
3(1 − 2ν u )<br />
where G e is the elastic shear modulus.<br />
(1.31)<br />
The drained bulk modulus of the soil skeleton K ′ is computed in the<br />
same way using the drained Poisson’s ratio which is based on the stress<br />
dependent stress moduli (Equation 1.32).<br />
ν ′ = 3Ke − 2G e<br />
6K e + 2G e (1.32)<br />
15
In the latest version of the <strong>UBC3D</strong> the bulk modulus of water is dependent<br />
with the degree of saturation of the soil. This enables the prediction of<br />
the pore pressure evolution in unsaturated soils. The bulk modulus of the<br />
unsaturated water is defined as follows:<br />
where K Sat<br />
w<br />
K w unsat =<br />
Kw<br />
Sat K air<br />
SK air + (1 − S)Kw<br />
Sat<br />
(1.33)<br />
is the bulk modulus of the saturated water and K air is the<br />
bulk modulus of air which equals 1 kPa in this implementation having the<br />
minimum value.<br />
This enables to avoid the generation of pore pressures<br />
during modelling a dry sand. under atmospheric pressure. Finally, S is the<br />
degree of saturation in the soil.<br />
In this chapter the formulation of the <strong>UBC3D</strong>-<strong>PLM</strong> model has been thoroughly<br />
discussed. The following chapter presents the validation of the model<br />
under triaxial conditions, in order to investigate how well characteristic soil<br />
behaviour is captured.<br />
1.8 Parameter selection, summary of the <strong>UBC3D</strong><br />
input parameters and state variables<br />
In Table 1.8 the input parameters for the <strong>UBC3D</strong>-<strong>PLM</strong> model are presented.<br />
The main extracting method of the parameters is by fit the experimental<br />
curves from element tests. It is crucial to pick the proper element test<br />
depends on the stress path which will be the critical during the modelling<br />
process. Usually, in earthquake engineering when the onset of liquefaction<br />
is the modelling target a drained cyclic direct simple shear test (DSS) is the<br />
proper test in order to be able to extract all the parameters for the <strong>UBC3D</strong><br />
model.<br />
However, in many cases only data from drained triaxial tests are available<br />
(CD TxC). As the triaxial test does not involve principal stress rotation,<br />
the test data cannot in principal reflect soil response under principal stress<br />
16
otation (Vaid et al., 1995). Puebla et al. (1997) proposed a set of equations<br />
to be used in the original UBCSAND in order to include the effect of the<br />
rotation of principal stresses in terms of stiffness. The equations proposed<br />
are derived by experimental observations and fit to the formulation of the<br />
<strong>UBC3D</strong>-<strong>PLM</strong> constitutive model also. They are derived as follows:<br />
For, 0 o ≤ a σ ≤ 45 o , then K p G = (Kp G ) 0{F − (F − 1) cos 2a} (1.34)<br />
For, 45 o ≤ a σ ≤ 90 o , then K p G = (Kp G ) 0F (1.35)<br />
Where:<br />
• and a σ is the angle between the major principal stress direction and<br />
the vertical axis.<br />
• (K p G ) 0 is the plastic modulus number corresponding to a σ = 0 ◦ (vertical<br />
compression);<br />
• F is the factor of anisotropic plastic response which is less than unity<br />
(proposed value 0.317);<br />
With the use of the proposed equations the plastic shear modulus (K p G<br />
which is proper for modelling the direct simple shear stress path (a σ = 45 ◦ )<br />
is possible if the one suits for triaxial compression is known. Even though<br />
with this specific formulation the effect of principal stress rotation in terms<br />
of stiffness during plastic hardening can be modelled, the limitations of<br />
modelling the inherent and induced anisotropy in the framework of classical<br />
plasticity still arise. The proposed equations were derived only in order to<br />
overcome the limitation of using parameters generated from triaxial compression<br />
tests which is a common procedure in engineering practice.<br />
Finally, some equations for the derivation of the parameters are published<br />
by Beaty and Byrne (2011) for the initial calibration of the model<br />
17
as generic input parameters. These correlations are based on SPT values<br />
after calibration of the UBCSAND with proposed analytical solutions and<br />
experimental results. The <strong>UBC3D</strong>-<strong>PLM</strong> shows a good agreement with the<br />
UBCSAND in this stage of development. However, if only the N1 60 is used<br />
for the preliminary parameter selection, the model has to be calibrated with<br />
experimental data.<br />
The input parameters of the <strong>UBC3D</strong> are summarized bellow:<br />
• φ cv is the constant volume friction angle;<br />
• φ p is the peak friction angle;<br />
• c is the cohesion of the soil;<br />
• KB e is the elastic bulk modulus of the soil in a reference level of 100<br />
kPa. It can be derived from a drained triaxial test with a confining<br />
pressure of 100 kPa. When data from a triaxial test with a different<br />
confining pressure are available, it can be corrected using Equation<br />
1.9;<br />
• KG e is the elastic shear modulus of the soil in a reference level of 100<br />
kPa. It can be related with the KB e using the Poison ratio as shown<br />
in Equation 1.36;<br />
• K p G<br />
fit;<br />
is the plastic shear modulus and has to be extracted after curve<br />
• me is the elastic bulk modulus index and has a default value of 0.5;<br />
• ne is the elastic shear modulus index and has a default value of 0.5;<br />
• np is the plastic shear modulus index and has a default value of 0.5;<br />
• R f is the failure ratio n f /n ult like in Duncan-Chang mode (0.9);<br />
• P A is the atmospheric pressure;<br />
18
• fac hard is the densification factor. It is a multiplier that controls the<br />
scaling of the plastic shear modulus during secondary loading. Above<br />
1 the K p G<br />
becomes higher and the behaviour stiffer and bellow 1 the<br />
K p G<br />
becomes lower and the behaviour softer;<br />
• N1 60 is the corrected SPT value of the soil. If this is not known an<br />
approximation with relative density can be made as shown in Equation<br />
1.37;<br />
• fac post Fitting parameter to adjust post liquefaction behaviour;<br />
K e B<br />
K e G<br />
= 2(1 + ν′ )<br />
3(1 − 2ν ′ )<br />
(1.36)<br />
N1 60 = RD2<br />
15 2 (1.37)<br />
P P R = p′ i − p′ c<br />
p i<br />
(1.38)<br />
where p ′ i is the initial effective mean stress and p′ c is the current effective<br />
mean stress.<br />
When P P R equals 1 then the soil is in a liquefied state.<br />
The PPR state variable can show the current status during the calculation<br />
whereas the P P RMAX can reveal if the soil had been in the liquefied state<br />
even once during the test. The state variable r u gives similar information<br />
as P P R but instead of the effective mean stress the vertical effective stress<br />
is used in the equation as shown in Equation 1.39.<br />
r u = σ′ vertical,i − σ′ vertical,c<br />
σ ′ vertical,i<br />
(1.39)<br />
19
Table 1.1: Input Parameters for the <strong>UBC3D</strong>.<br />
Name Symbol Unit Method Default<br />
Constant volume friction<br />
φ cv ( ◦ ) CD TxC or DSS -<br />
angle<br />
Peak friction angle φ p ( ◦ ) CD TxC or DSS -<br />
Cohesion c kPa CD TxC or DSS 0<br />
Elastic Shear Modulus KG e - Curve Fit -<br />
Elastic Plastic Modulus K p G<br />
- Curve Fit -<br />
Elastic Bulk Modulus KB e - Curve Fit -<br />
Elastic Shear Modulus ne - Curve Fit 0.5<br />
Index<br />
Elastic Bulk Modulus me - Curve Fit 0.5<br />
Index<br />
Plastic Shear Modulus np - Curve Fit 0.5<br />
Index<br />
Failure Ratio R f - Curve Fit 0.9<br />
Atmospheric Pressure P A kPa Standard Value 100<br />
Tension Cut-off σ t kPa - 0<br />
Densification Factor fac hard - Curve Fitting 1<br />
SPT value N1 60 - In-Situ Testing -<br />
Post Liquefaction Factor<br />
fac post - Curve Fitting 0.2-1<br />
20
Table 1.2: State variables of the <strong>UBC3D</strong>.<br />
Name Symbol Explanation<br />
Mobilized Friction Angle<br />
sinphi mob Equation 1.11<br />
Maximum Mobilized maxsinphi mob -<br />
Friction Angle<br />
Internal Variable etham r Equals with the<br />
sinphi mob<br />
Number of Cross Over xCross Number of half cycles<br />
Internal Variable dsinphi mob evolution of sinphi mob<br />
Confining Factor facConf Always 1 in this version<br />
Internal Variavle P hiP Reached It is 1 when the φ peak is<br />
reached<br />
Internal Variable r u Equation 1.39<br />
Initial mean stress p0 In the beginning of the<br />
dynamic phase<br />
Pore pressure ratio P P R Equation 1.38<br />
Initial vertical stress SigV 0 -<br />
Maximum Pore pressure<br />
P P RMax -<br />
ratio<br />
Maximum r u r u Max -<br />
21
Figure 1.6: Introduction of two yield syrfaces in order to include soil densification,<br />
smooth transition in liquefaction state and post-liquefaction behaviour.<br />
22
Shear Stress, τ (kPa)<br />
30<br />
20<br />
10<br />
0<br />
-10<br />
-20<br />
-30<br />
Stiffness Degradation<br />
Touching the<br />
Peak Yield Surface<br />
Densification<br />
Primary Loading<br />
0 10 20 30 40 50 60 70 80 90 100<br />
Effective Vertical Stress, σyy' (kPa)<br />
Figure 1.7: Undrained cyclic shear stress path reproduced with <strong>UBC3D</strong>-<br />
<strong>PLM</strong> for dense sand. Cyclic mobility, stiffness degradation and soil densification<br />
are mentioned on the graph.<br />
23
Chapter 2<br />
Validation of the <strong>UBC3D</strong> in<br />
various stress paths and a<br />
finite element scheme<br />
2.1 Validation of the reformulated <strong>UBC3D</strong>-<strong>PLM</strong><br />
in monotonic loading<br />
In this section the validation of the <strong>UBC3D</strong>-<strong>PLM</strong> under monotonic loading<br />
is presented. The numerical modelling of a monotonic triaxial compression<br />
(TxC) and a monotonic simple shear test (DSS) are shown and compared<br />
with experimental data, as well as with the original UBCSAND as published<br />
by Beaty and Byrne (1998).<br />
The parameters used in the tests are extracted from a drained triaxial<br />
test. The plastic anisotropic factor is used to modify the plastic shear modulus<br />
used in <strong>UBC3D</strong>-<strong>PLM</strong> in PLAXIS as proposed by Puebla et al. (1997).<br />
The parameters are summarized in Table 2.1.<br />
In Figure 2.1 the results for the numerical modelling of a triaxial compression<br />
test are presented. It can be seen that the reproduced soil behaviour<br />
from the <strong>UBC3D</strong>-<strong>PLM</strong> high accuracy and is in close agreement both with the<br />
24
Deviatoric Stress, q (kPa)<br />
<strong>UBC3D</strong><br />
Puebla et al. 1997 (UBCSAND)<br />
Laboratory Results (TxC)<br />
Figure 2.1: Validation of the <strong>UBC3D</strong>-<strong>PLM</strong> under monotonic triaxial compression.<br />
Undrained behaviour of loose Syncrude sand. Isotropic consolidation<br />
with p ′ = 100. The data from the numerical calculation and the<br />
experimental result are published by Beaty and Byrne (1998).<br />
experimental data and the results from the original UBCSAND. In Figure<br />
2.2 the results for the numerical calculation of a monotonic direct simple<br />
shear test are presented.<br />
The <strong>UBC3D</strong>-<strong>PLM</strong> model is in good agreement<br />
both with the experimental data and the results from the original UBC-<br />
SAND for this stress path. The model shows a stiffer undrained hardening<br />
behaviour in small strain but this can be improved after a better calibration<br />
of the input parameters specifically for the proposed model. In this test the<br />
parameters are calibrated based on the original UBCSAND.<br />
It is concluded that the <strong>UBC3D</strong> can model the undrained behaviour of<br />
loose sand with high accuracy.<br />
25
Pore Pressure, u (kPa)<br />
<strong>UBC3D</strong><br />
Ex.Pore.Pr<br />
Puebla et al. 1997 (UBCSAND)<br />
Laboratory Pore Pressure<br />
Laboratory Shear Stress<br />
Figure 2.2: Validation of the <strong>UBC3D</strong>-<strong>PLM</strong> under monotonic direct simple<br />
shear. Undrained behaviour of loose Syncrude sand. Vertical applied stress<br />
100 kPa. The data from the numerical calculation and the experimental<br />
result are published by Beaty and Byrne (1998).<br />
2.2 Validation of the <strong>UBC3D</strong>-<strong>PLM</strong> in cyclic loading<br />
The behaviour of loose Fraser sand under cyclic direct simple shear is modelled<br />
and the numerical results are compared with experimental data as<br />
published by Sriskandakumar (2004). The relative density RD of the tested<br />
sand is 40 %. Three different shear stress ratios are used (CSR=0.08, 0.1,<br />
0.12) with the same set of parameters. The vertical applied stress is 100<br />
kPa in all cases. The K 0 factor in the numerical calculations is assumed to<br />
be 0.46 computed with the well known Jaky formula. Therefore the initial<br />
stresses after consolidation in the two horizontal directions equal 46 kPa.<br />
In Figures 2.3, 2.4 and 2.5 the evolution of excess pore pressure in three<br />
stress controlled DSS tests are presented. The input parameters are pre-<br />
26
φ p ( ◦ ) φ c ( ◦ ) KB e KG e Kp G (T xC) Kp G (DSS) R f F<br />
33.7 33 300 300 310 98.3 0.95 0.317<br />
Table 2.1: Model parameters used to simulate undrained behaviour of loose<br />
Syncrude sand (Puebla et al., 1997). The stiffness parameters determined in<br />
reference stress level of 100 kPa and are unitless. The R f and F are unitless<br />
parameters.<br />
sented in Table 2.2. Even though modelling the onset of liquefaction in<br />
the framework of classical plasticity is very complicated, the <strong>UBC3D</strong>-<strong>PLM</strong><br />
constitutive model can reproduce the evolution of excess pore pressures towards<br />
cyclic liquefaction with adequate accuracy for three different shear<br />
stress ratios using the same set of parameters. The updated formulation of<br />
the densification rule is helping the model not to predict very steep evolution<br />
of the excess pore pressures in the case of the anisotropic consolidated soil<br />
which was reported by Petalas et al. (2012) for previous formulations.<br />
One of the main limitations of the model is presented in the case of<br />
the higher shear stress ratio (CSR=0.12). The formulation of the <strong>UBC3D</strong>-<br />
<strong>PLM</strong> cannot take into account the anisotropic consolidation effects during<br />
the primary loading which causes higher evolution of the excess pore pressures<br />
during the first full cycle. Due to this issue the <strong>UBC3D</strong>-<strong>PLM</strong> predicts<br />
a slower evolution for this CSR. The slope of the curve in the experimental<br />
results is much steeper during the first two half cycles as can be seen in<br />
Figure 2.5. The ability of the <strong>UBC3D</strong>-<strong>PLM</strong> of reproducing with high accuracy<br />
the cyclic stress paths which are started from the isotropic line was<br />
presented by Petalas et al. (2012).<br />
In Figure 2.6 the influence of the post liquefaction formulation can be<br />
seen for the case of the lower shear stress ratio (CSR 0.08). The predicted<br />
total shear strains are in a good agreement with the experimental results<br />
and prove the liquefied state of the soil. The same good agreement in the<br />
predicted relationship between the shear stress and the shear strain is ob-<br />
27
Table 2.2: Input parameters for the validation of the <strong>UBC3D</strong>-<strong>PLM</strong> in modelling<br />
cyclic element tests and a dynamic centrifuge test.<br />
Cyclic and Dynamic Tests<br />
Input Parameters Cyclic DSS Dynamic Centrifuge<br />
φ p (deg) 33.3 31.2<br />
φ cv (deg) 33 34.6<br />
KB e (-) 848 720<br />
KG e (-) 594 1031<br />
K p G<br />
(-) 243 700<br />
me and ne(-) 0.5 0.5<br />
np(-) 0.4 0.4<br />
R f (-) 0.81 0.74<br />
P A (kPa) 100 100<br />
σ t (kPa) 0 0<br />
fac hard (-) 0.45 0.45<br />
N1 60 (-) 8 13<br />
fac post (-) 0.01 0.01<br />
28
Figure 2.3: Evolution of excess pore pressures during simple shearing on<br />
Fraser sand (RD=40%). CSR=0.08. σ v =100 kPa.<br />
served for the other two shear stress ratios as well, still with the same set of<br />
parameters.<br />
Finally, in Figure 2.7 a drained strain controlled cyclic direct simple<br />
shear test on the same soil is modelled with constant applied strain up to<br />
3%. The first cycle is highlighted. It can be concluded that the constitutive<br />
model over-produce hysteretic damping in the system because of the linear<br />
elastic unloading rule with constant shear modulus equals G max . This leads<br />
to bigger area of the hysteretic loop, which equals with the amount of predicted<br />
damping. This fact is well documented in the literature also for the<br />
UBCSAND model (Beaty and Byrne, 2011) and is an intrinsic characteristic<br />
in the formulation of the model.<br />
In the final section the validation of the reformulated version in a finite<br />
element scheme is presented. This gives the opportunity to investigate the<br />
limitations of the reformulated version during non-symmetric cycles, under<br />
different stress paths during the test and finally to have a clearer opinion on<br />
the influence of the K 0 value.<br />
29
Figure 2.4: Evolution of excess pore pressures during simple shearing on<br />
Fraser sand (RD=40%). CSR=0.1. σ v =100 kPa.<br />
Figure 2.5: Evolution of excess pore pressures during simple shearing on<br />
Fraser sand (RD=40%). CSR=0.12. σ v =100 kPa.<br />
30
Figure 2.6: Evolution of shear strains during undrained simple shearing.<br />
Fraser sand (RD=40%). CSR=0.1. σ v =100 kPa.<br />
Figure 2.7: Over-produce of hysteretic damping of the <strong>UBC3D</strong>-<strong>PLM</strong> constitutive<br />
model. The elastic unloading with G max leads to over-produced<br />
damping.<br />
31
2.3 Validation of the <strong>UBC3D</strong>-<strong>PLM</strong> in a finite element<br />
scheme<br />
A dynamic centrifuge test is modelled with PLAXIS 2D dynamics in order<br />
to validate the <strong>UBC3D</strong>-<strong>PLM</strong> in a boundary value problem. The numerical<br />
results are compared with the experimental results published by Byrne et al.<br />
(2004). The input parameters are presented in Table 2.2.<br />
The depth of the sand in the model on prototype scale is 38.1 m. The<br />
width does not have any influence in numerical modelling and a 1D soil<br />
response is predicted. The total time of the input acceleration is 33 seconds.<br />
50 loading cycles are modelled with constant amplitude of acceleration equal<br />
to 1.96 m/s 2 .<br />
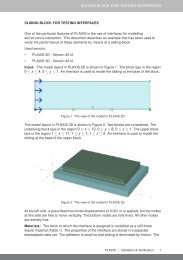
The results of the predicted evolution of excess pore pressure are presented<br />
in Figure 2.8. At 13.1 meters depth the numerical predictions is in<br />
a close agreement with the experimental result. The model can predict the<br />
onset of liquefaction with adequate accuracy for this depth. However, in the<br />
two higher depths, i.e., at 24.8 and 30.8 meters, the model shows inaccuracy<br />
during the first loading cycles. It predicts a much steeper evolution of<br />
excess pore pressure which lead earlier to the liquefied state compared with<br />
the experiment. This issue gets more crucial in the deeper layer.<br />
The influence of the higher relative density in the deeper layer is critical<br />
in that case. The <strong>UBC3D</strong>-<strong>PLM</strong> cannot take into account the specific feature<br />
and the layer is treated as homogeneous. Moreover, the densification of the<br />
soil in the two cases is not in close agreement with the experimental results<br />
and reveals the complexity of the soil behaviour under undrained cyclic<br />
loading. It is concluded from this research that the absence of a stress<br />
densification feature in the model leads to a rapid evolution of the pore<br />
pressures in the first loading cycles. The effective confining pressure does<br />
not influence the behaviour of the current model.<br />
32
EPP (kPa)<br />
EPP (kPa)<br />
EPP (kPa)<br />
140<br />
120<br />
100<br />
80<br />
60<br />
40<br />
20<br />
0<br />
300<br />
250<br />
200<br />
150<br />
100<br />
50<br />
0<br />
350<br />
300<br />
250<br />
200<br />
150<br />
100<br />
50<br />
0<br />
Measurement<br />
Prediction<br />
Depth=13.1m<br />
-- σ'vo<br />
0 10 20 30 40<br />
Depth=24.8m<br />
-- σ'vo<br />
0 10 20 30 40<br />
Depth=30.8m<br />
-- σ'vo<br />
0 10 20 30 40<br />
Figure 2.8: Comparison of the predicted evolution of excess pore pressure by<br />
the <strong>UBC3D</strong> with the experimental results published by Byrne et al. (2004).<br />
33
Bibliography<br />
M. Beaty and P. Byrne. An effective stress model for predicting liquefaction<br />
behaviour of sand. Geotechnical Earthquake Engineering and Soil<br />
Dynamics III ASCE Geotechnical Special Publication No.75, 1:766–777,<br />
1998.<br />
M.H. Beaty and P.M. Byrne. Ubcsand constitutive model version 904ar.<br />
Itasca UDM Web Site, page 69, 2011.<br />
P. M. Byrne, S. S. Park, M. Beaty, M. Sharp, L. Gonzales, and T. Abdoun.<br />
Numerical modelling of dynamic centrifuge tests. 13 th World Conference<br />
in Earthquake Engineering, 2004.<br />
G.R. Martin, W.D.L. Finn, and H.B. Seed. Fundamentals of liquefaction<br />
under cyclic loading. Journal of the Geotechnical Engineering Division,<br />
ASCE, 101, 1975.<br />
E. Naesgaard. A hybrid effective stress-total stress procedure for analysing<br />
soil embankments subjected to potential liquefaction and flow. PHD Thesis<br />
in the University of British Columbia, 2011.<br />
A. Petalas, V. Galavi, and R.B.J. Bringkreve. Validation and verification of<br />
a practical constitutive model for predicting liquefaction in sands. Proceedings<br />
of the 22nd european young geotechnical engineers conference,<br />
Gothenburg, Sweden., pages 167–172, 2012.<br />
34
H. Puebla, M. Byrne, and P. Phillips. Analysis of canlex liquefaction embankments<br />
prototype and centrifuge models. Canadian Geotechnical Journal,<br />
34:641–657, 1997.<br />
P. W. Rowe. The stress-dilatancy relation for static equilibrium of an assembly<br />
of particles in contact. Proc. R. Soc., 269A:500–527, 1962.<br />
S. Sriskandakumar. Cyclic loading response of fraser sand for validation of<br />
numerical models simulating centrifuge tests. Master’s thesis, The University<br />
of British Columbia, Department of Civil Engineering, 2004.<br />
A. Tsegaye. <strong>Plaxis</strong> liqueafaction model. report no. 1. PLAXIS knowledge<br />
base., 2010.<br />
Y.P. Vaid, M. Uthayakumar, S. Sivathayalan, P.K. Robertson, and B. Hofmann.<br />
Laboratory testing of syncrude sand. 48th Candian Geotechnical<br />
Conference, Vancouver, B.C., 1:223–232, 1995.<br />
35