Fitting Improvement Using a New Electrical Circuit Model for the ...
Fitting Improvement Using a New Electrical Circuit Model for the ...
Fitting Improvement Using a New Electrical Circuit Model for the ...

Create successful ePaper yourself
Turn your PDF publications into a flip-book with our unique Google optimized e-Paper software.
Proceedings of <strong>the</strong> 3rd International<br />
IEEE EMBS Conference on Neural Engineering<br />
Kohala Coast, Hawaii, USA, May 2-5, 2007<br />
SaD1.9<br />
<strong>Fitting</strong> <strong>Improvement</strong> <strong>Using</strong> a <strong>New</strong> <strong>Electrical</strong> <strong>Circuit</strong> <strong>Model</strong> <strong>for</strong> <strong>the</strong><br />
Electrode-Electrolyte Interface<br />
Jong-hyeon Chang, Student Member, IEEE, Jungil Park, Student Member, IEEE, Youngmi Kim Pak,<br />
and James Jungho Pak, Member, IEEE<br />
Abstract— The characteristics of impedance <strong>for</strong> <strong>the</strong><br />
electrode-electrolyte interface are important in <strong>the</strong> electrode<br />
researches <strong>for</strong> biomedical applications. So, <strong>the</strong> equivalent<br />
circuit models <strong>for</strong> <strong>the</strong> interface have been researched and<br />
developed. However, <strong>the</strong> applications of such previous models<br />
are limited in terms of <strong>the</strong> frequency range, type of electrode or<br />
electrolyte. In this paper, a new electrical circuit model was<br />
proposed and demonstrated its capability of fitting <strong>the</strong><br />
experimental results more accurately than be<strong>for</strong>e. A new<br />
electrical circuit model consists of three resistors and two<br />
constant phase elements. Electrochemical impedance<br />
spectroscopy was used to characterize <strong>the</strong> interface <strong>for</strong> several<br />
materials of Au, Pt, and stainless steel electrode in 0.9% NaCl<br />
solution. The new model and <strong>the</strong> previous model were applied to<br />
fit <strong>the</strong> measured impedance results, and were compared <strong>the</strong>ir<br />
goodness of fit.<br />
E<br />
I. INTRODUCTION<br />
LECTRODES are widely used <strong>for</strong> measuring<br />
electrochemical reaction in various electrolyte solutions<br />
and <strong>for</strong> stimulating tissues or cells. When a metal electrode is<br />
in electrolyte solution, electrical double layer is <strong>for</strong>med at <strong>the</strong><br />
electrode-electrolyte interface. Characterization of <strong>the</strong><br />
electrode- electrolyte interface is very important in <strong>the</strong> fields<br />
of impedance-based biosensor, neuropro<strong>the</strong>sis, and in vitro<br />
communication with cells[1-3]. So, if <strong>the</strong> interface impedance<br />
is characterized well, <strong>the</strong>n it is possible to make an optimized<br />
microelectrode <strong>for</strong> various biomedical applications.<br />
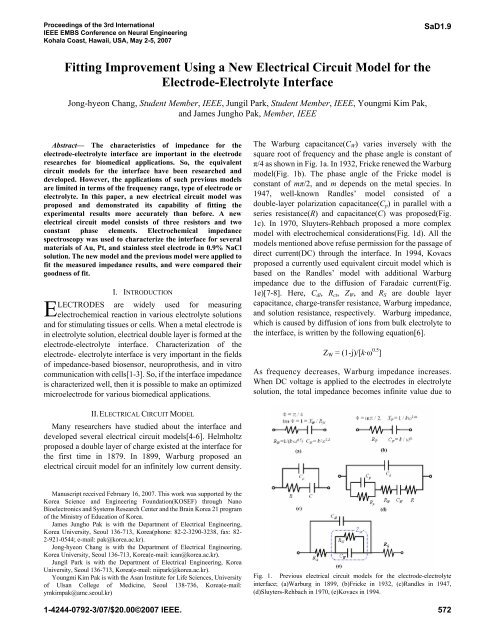
The Warburg capacitance(C W ) varies inversely with <strong>the</strong><br />
square root of frequency and <strong>the</strong> phase angle is constant of<br />
π/4 as shown in Fig. 1a. In 1932, Fricke renewed <strong>the</strong> Warburg<br />
model(Fig. 1b). The phase angle of <strong>the</strong> Fricke model is<br />
constant of mπ/2, and m depends on <strong>the</strong> metal species. In<br />
1947, well-known Randles’ model consisted of a<br />
double-layer polarization capacitance(C p ) in parallel with a<br />
series resistance(R) and capacitance(C) was proposed(Fig.<br />
1c). In 1970, Sluyters-Rehbach proposed a more complex<br />
model with electrochemical considerations(Fig. 1d). All <strong>the</strong><br />
models mentioned above refuse permission <strong>for</strong> <strong>the</strong> passage of<br />
direct current(DC) through <strong>the</strong> interface. In 1994, Kovacs<br />
proposed a currently used equivalent circuit model which is<br />
based on <strong>the</strong> Randles’ model with additional Warburg<br />
impedance due to <strong>the</strong> diffusion of Faradaic current(Fig.<br />
1e)[7-8]. Here, C dl , R ct , Z W , and R S are double layer<br />
capacitance, charge-transfer resistance, Warburg impedance,<br />
and solution resistance, respectively. Warburg impedance,<br />
which is caused by diffusion of ions from bulk electrolyte to<br />
<strong>the</strong> interface, is written by <strong>the</strong> following equation[6].<br />
Z W = (1-j)/[k·ω 0.5 ]<br />
As frequency decreases, Warburg impedance increases.<br />
When DC voltage is applied to <strong>the</strong> electrodes in electrolyte<br />
solution, <strong>the</strong> total impedance becomes infinite value due to<br />
II. ELECTRICAL CIRCUIT MODEL<br />
Many researchers have studied about <strong>the</strong> interface and<br />
developed several electrical circuit models[4-6]. Helmholtz<br />
proposed a double layer of charge existed at <strong>the</strong> interface <strong>for</strong><br />
<strong>the</strong> first time in 1879. In 1899, Warburg proposed an<br />
electrical circuit model <strong>for</strong> an infinitely low current density.<br />
Manuscript received February 16, 2007. This work was supported by <strong>the</strong><br />
Korea Science and Engineering Foundation(KOSEF) through Nano<br />
Bioelectronics and Systems Research Center and <strong>the</strong> Brain Korea 21 program<br />
of <strong>the</strong> Ministry of Education of Korea.<br />
James Jungho Pak is with <strong>the</strong> Department of <strong>Electrical</strong> Engineering,<br />
Korea University, Seoul 136-713, Korea(phone: 82-2-3290-3238, fax: 82-<br />
2-921-0544; e-mail: pak@korea.ac.kr).<br />
Jong-hyeon Chang is with <strong>the</strong> Department of <strong>Electrical</strong> Engineering,<br />
Korea University, Seoul 136-713, Korea(e-mail: ican@korea.ac.kr).<br />
Jungil Park is with <strong>the</strong> Department of <strong>Electrical</strong> Engineering, Korea<br />
University, Seoul 136-713, Korea(e-mail: niipark@korea.ac.kr).<br />
Youngmi Kim Pak is with <strong>the</strong> Asan Institute <strong>for</strong> Life Sciences, University<br />
of Ulsan College of Medicine, Seoul 138-736, Korea(e-mail:<br />
ymkimpak@amc.seoul.kr)<br />
Fig. 1. Previous electrical circuit models <strong>for</strong> <strong>the</strong> electrode-electrolyte<br />
interface; (a)Warburg in 1899, (b)Fricke in 1932, (c)Randles in 1947,<br />
(d)Sluyters-Rehbach in 1970, (e)Kovacs in 1994.<br />
1-4244-0792-3/07/$20.00©2007 IEEE. 572
<strong>the</strong> frequency dependence of <strong>the</strong> Warburg impedance.<br />
However, <strong>the</strong> Kovacs’ model, omitting <strong>the</strong> circuit element R ct<br />
or Z W , in accordance with experimental conditions is often<br />
used[6, 9-12]. In Fig. 1e, constant phase element(CPE) was<br />
used instead of C dl , because a capacitor in electrochemical<br />
impedance spectroscopy(EIS) normally does not behave<br />
ideally and act like a CPE[6].<br />
Z CPE = 1/[A·(jω) a ]<br />
When this equation describes a capacitor, <strong>the</strong> exponent a is 1.<br />
For a CPE, <strong>the</strong> exponent a is less than 1.<br />
To overcome <strong>the</strong> problem of <strong>the</strong> previous model, we make<br />
a new electrical circuit model <strong>for</strong> <strong>the</strong> electrode-electrolyte<br />
interface as shown in Fig. 2. In this model, Warburg<br />
impedance was replaced by CPE b and R b paralleled <strong>for</strong> <strong>the</strong><br />
passage of DC through <strong>the</strong> interface. With this model, total<br />
impedance becomes a finite value even at 0 Hz due to R b . <strong>the</strong>n<br />
<strong>the</strong> total impedance is given by<br />
Z(0) = R a +R b +R S<br />
<strong>the</strong> Kovacs’ model. So, <strong>the</strong> applicable range of this model is<br />
broader than Kovacs’ model at least.<br />
III. EXPERIMENTS<br />
To measure and analyze <strong>the</strong> impedance characteristics<br />
according to <strong>the</strong> frequency, EIS was used. Fig 3 shows<br />
3-electrode system consisted of a working electrode(WE), a<br />
reference electrode(RE) and a counter electrode(CE) <strong>for</strong><br />
stable EIS. Each of Au, Pt and stainless steel(SUS) wire with<br />
5.0 mm 2 in <strong>the</strong> surface area was used as a WE. Where, <strong>the</strong><br />
diameter of each wire electrode was 0.4mm, and <strong>the</strong> length<br />
was 4mm. A commercial Ag/AgCl electrode(RE-5B,<br />
Bioanalytical Systems Inc.) was used as a RE, and Pt coil with<br />
about 400 mm 2 in <strong>the</strong> surface area was used as a CE. The<br />
electrolyte solution was physiological saline, 0.9% NaCl,<br />
with <strong>the</strong> volume of 15mL.<br />
AC voltage of 10mV rms with respect to <strong>the</strong> open-circuit<br />
potential was applied typically and impedance according to<br />
<strong>the</strong> frequency was measured by Potentiostatic EIS(PCI4/750,<br />
Gamry Instruments Inc.). As <strong>the</strong> frequency is lower, <strong>the</strong><br />
If R b has infinite value and <strong>the</strong> parameter of CPE b , b has a<br />
certain value of 0.5, <strong>the</strong>n <strong>the</strong> new model can be converted to<br />
Fig. 2. A <strong>New</strong> electrical circuit model <strong>for</strong> <strong>the</strong> electrode-electrolyte<br />
interface.<br />
Fig. 3. 3-electrode system <strong>for</strong> electrochemical impedance spectroscopy.<br />
Impedance Magnitude [Ω]<br />
10 10 10 8<br />
10 7<br />
10 6<br />
10 5<br />
10 4<br />
10 3<br />
10 2<br />
Frequency [Hz]<br />
10 9<br />
0<br />
10 1<br />
-90<br />
10 -6 10 -5 10 -4 10 -3 10 -2 10 -1 10 0 10 1 10 2 10 3 10 4 10 5 10 6<br />
10<br />
-10<br />
-20<br />
-30<br />
-40<br />
-50<br />
-60<br />
-70<br />
-80<br />
Impedance Phase [degrees]<br />
-imag Z [Ω]<br />
20.0M<br />
15.0M<br />
10.0M<br />
5.0M<br />
0.0<br />
0.0 5.0M 10.0M 15.0M 20.0M 25.0M<br />
real Z [Ω]<br />
-imag Z [Ω]<br />
2.0M<br />
1.5M<br />
1.0M<br />
500.0k<br />
0.0<br />
0.0 500.0k 1.0M 1.5M 2.0M 2.5M 3.0M<br />
real Z [Ω]<br />
-imag Z [Ω]<br />
120.0k<br />
100.0k<br />
80.0k<br />
60.0k<br />
40.0k<br />
20.0k<br />
0.0<br />
0.0 20.0k 40.0k 60.0k 80.0k 100.0k 120.0k 140.0k<br />
real Z [Ω]<br />
(a) (b) (c)<br />
Fig. 4. Impedance magnitude and phase experimental results, and Nyquist diagram <strong>for</strong> (a)Au, (b)Pt, and (c)SUS wire electrodes in 0.9% NaCl with fitting by<br />
Kovacs’ model(dashed line) and new model(solid line).<br />
573
TABLE I<br />
FITTING PARAMETER RESULTS FOR THE ELECTRODE-ELECTROLYTE INTERFACE<br />
Parameter<br />
Au/0.9% NaCl Pt/0.9% NaCl SUS/0.9% NaCl<br />
Kovacs’ model <strong>New</strong> model Kovacs’ model <strong>New</strong> model Kovacs’ model <strong>New</strong> model<br />
R S [Ω] 88 87.3 83.7 83.8 90.6 91.1<br />
Deviation 1.59 1.13 0.807 0.926 1.23 1.43<br />
R b [Ω] ∞ 1.62e7 ∞ 1.27e6 ∞ 8.45e4<br />
Deviation - 2.07e7 - 1.00e6 - 4.18e4<br />
R ct or R a [Ω] 3.52e3 7.54e6 1.55e6 1.34e6 5.24e4 4.93e4<br />
Deviation 1.56e6 3.19e6 1.14e5 4.46e5 8.71e2 3.03e3<br />
k or B [S·s b ] 3.36e-7 1.09e-6 5.53e-6 4.80e-6 1.12e-4 8.06e-5<br />
Deviation 4.10e-8 1.61e-6 9.77e-7 7.49e-6 5.76e-6 1.99e-5<br />
b 0.5 0.888 0.5 0.767 0.5 0.543<br />
Deviation - 5.14e-1 - 4.43e-1 - 1.25e-1<br />
A [S·s a ] 2.22e-6 2.42e-6 5.54e-6 5.49e-6 3.68e-6 3.57e-6<br />
Deviation 1.51e-7 3.74e-8 6.40e-8 1.01e-7 7.78e-8 1.14e-7<br />
a 0.876 0.865 0.893 0.895 0.772 0.776<br />
Deviation 1.55e-2 2.65e-3 2.23e-3 3.43e-3 3.08e-3 4.40e-3<br />
Goodness of fit 6.67e-4 1.96e-4 1.11e-3 1.06e-3 6.92e-4 1.64e-4<br />
impedance magnitude is higher, and <strong>the</strong> current approaches<br />
<strong>the</strong> system measurement limit. So, <strong>the</strong> frequency range was<br />
set between 10 -2 ~ 10 5 Hz. To obtain <strong>the</strong> appropriate electrical<br />
circuit model from <strong>the</strong> measured result, <strong>the</strong> analysis was<br />
per<strong>for</strong>med by using Echem Analyst(Gamry Instruments Inc.).<br />
Both of <strong>the</strong> Kovacs’ model and new model were applied to fit,<br />
and <strong>the</strong> fitting parameters are obtained.<br />
Fig. 4 shows <strong>the</strong> EIS measurements and model results <strong>for</strong><br />
5.0mm 2 Au, Pt, and SUS wire electrodes with fitting by<br />
Kovacs’ model and new model, and Table I shows <strong>the</strong> fitting<br />
parameter results <strong>for</strong> <strong>the</strong> Au/0.9% NaCl, Pt/0.9% NaCl, and<br />
SUS/0.9% NaCl interface.<br />
In <strong>the</strong> fitted results by <strong>the</strong> Kovacs’ model, <strong>the</strong> impedance<br />
magnitude goes up with <strong>the</strong> frequency goes down at <strong>the</strong> very<br />
low frequency. However, in <strong>the</strong> results by <strong>the</strong> new model, <strong>the</strong><br />
impedance goes to a finite value. Both of <strong>the</strong> two models<br />
seem to be fitted well, but <strong>the</strong> new model was fitted more<br />
precisely. Small goodness of fit in Table 1 presents high<br />
accuracy.<br />
V. CONCLUSIONS<br />
A new electrical circuit model <strong>for</strong> <strong>the</strong> electrode-electrolyte<br />
interface was proposed and used to analyze <strong>the</strong> EIS<br />
experimental results comparing with a previous model. Au, Pt<br />
and SUS wire electrode and 0.9% NaCl solution were used to<br />
measure <strong>the</strong> impedance characteristics according to <strong>the</strong><br />
frequency range of 10 -2 ~ 10 5 Hz. The new model was fitted<br />
better than Kovacs’s model at <strong>the</strong> low frequency range, and it<br />
was possible to predict <strong>the</strong> impedance at very low frequency<br />
inclusive of DC using <strong>the</strong> new model. This model will be<br />
applicable to various biomedical applications instead of<br />
previous models <strong>for</strong> accurate analysis.<br />
REFERENCES<br />
[1] L. Yang, et al., “Detection of viable Salmonella typhimurium by<br />
impedance measurement of electrode capacitance and medium<br />
resistance,” Biosensors and Bioelectronics, Vol. 19, pp. 495-502, 2003.<br />
[2] C. Q. Huang, et al., “<strong>Electrical</strong> stimulation of <strong>the</strong> auditory nerve: direct<br />
current measurement in vivo,” IEEE Transactions on Biomedical<br />
Engineering, Vol. 46, pp. 461-469, 1999.<br />
[3] P. Thiebaud, et al., “An array of Pt-tip microelectrodes <strong>for</strong> extracellular<br />
monitoring of activity of brain slices,” Biosensors and Bioelectronics,<br />
Vol. 14, pp. 61–65, 1999.<br />
[4] L. A. Geddes, “Historical evolution of circuit models <strong>for</strong> <strong>the</strong><br />
electrode-electrolyte interface,” Annals of Biomedical Engineering,<br />
Vol. 25, pp. 1-14, 1997.<br />
[5] B. Onaral, et al., “Linear and nonlinear properties of platinum electrode<br />
polarization. Part 1: Frequency dependence at very low frequencies,”<br />
Medical and Biological Engineering and Computing, Vol. 20, pp.<br />
299–306, 1982.<br />
[6] W. Franks, et al., “Impedance characterization and modeling of<br />
electrodes <strong>for</strong> biomedical applications,” IEEE Transactions on<br />
Biomedical Engineering, Vol. 52, No. 7, 2005.<br />
[7] G. T. A. Kovacs, “Introduction to <strong>the</strong> <strong>the</strong>ory, design, and modeling of<br />
thin-film microelectrodes <strong>for</strong> neural interfaces,” in Enabling<br />
Technologies <strong>for</strong> Cultured Neural Networks, D.A. Stenger and T.M.<br />
McKenna, Eds. <strong>New</strong> York: Academic, 1994, Chap. 7, pp. 121-165.<br />
[8] K. Mathieson, et al., “Large-area microelectrode arrays <strong>for</strong> recording of<br />
Neural signals,” IEEE Transactions on Nuclear Science, Vol. 51, No. 5,<br />
pp. 2027-2031, 2004.<br />
[9] D. R. Merrill, et al., “<strong>Electrical</strong> stimulation of excitable tissue: design of<br />
efficacious and safe protocols,” Journal of Neuroscience Methods, Vol.<br />
141, pp. 171-198, 2005.<br />
[10] X. Huang, et al., “Simulation of microelectrode impedance changes due<br />
to cell growth,” IEEE Sensors Journal, Vol. 4, No. 5, pp. 576-583,<br />
2004.<br />
[11] A. Richardot, et al., “Harmonic analysis of low-frequency bioelectrode<br />
behavior,” IEEE Transactions on Medical Imaging, Vol. 21, No. 6, pp.<br />
604-612, 2002.<br />
[12] E. T. McAdams, et al., “Nonlinear transient response of electrodeelectrolyte<br />
interfaces,” Medical and Biological Engineering and<br />
Computing, Vol. 38, pp. 427-432, 2000.<br />
574