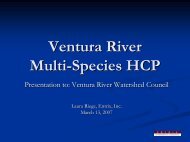
Floods - Ventura River Watershed Council
Floods - Ventura River Watershed Council
Floods - Ventura River Watershed Council

Create successful ePaper yourself
Turn your PDF publications into a flip-book with our unique Google optimized e-Paper software.
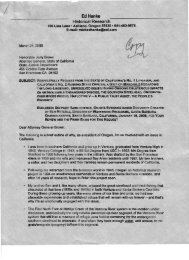
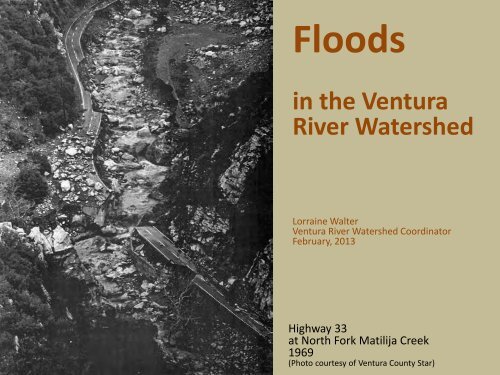
<strong>Floods</strong><br />
in the <strong>Ventura</strong><br />
<strong>River</strong> <strong>Watershed</strong><br />
Lorraine Walter<br />
<strong>Ventura</strong> <strong>River</strong> <strong>Watershed</strong> Coordinator<br />
February, 2013<br />
Highway 33<br />
at North Fork Matilija Creek<br />
1969<br />
(Photo courtesy of <strong>Ventura</strong> County Star)
Many Factors<br />
• Rainfall amounts and patterns<br />
• Steep mountains<br />
• Erosive mountains<br />
• Floodplain encroachment<br />
• Flood protection infrastructure<br />
• Channel condition<br />
• Recent fires<br />
• More
Flooding Profile - Overview<br />
• Types of floods<br />
• Past floods<br />
• Flood protection infrastructure<br />
<strong>Ventura</strong> Ave. looking north, near<br />
<strong>Ventura</strong>’s water treatment plant<br />
2005<br />
(Photo: <strong>Ventura</strong> Water)
Types of <strong>Floods</strong><br />
Coastal Flooding at Surfer’s Point, 1995<br />
(Photo: Paul Jenkin)<br />
• <strong>River</strong>ine<br />
• Alluvial fan<br />
• Coastal<br />
• Urban<br />
drainage<br />
• Dam failure
<strong>River</strong>ine Flooding<br />
Overflowing stream or river channels<br />
<strong>Ventura</strong> <strong>River</strong><br />
San Antonio Creek<br />
Lions Creek<br />
Cañada Larga<br />
Coyote Creek<br />
East Ojai Creeks<br />
Canada Larga, 2005<br />
(Photo: <strong>Ventura</strong> Water)
Frequent<br />
<strong>River</strong>ine Flooding<br />
A major or moderate flood occurs once every<br />
five years on average.<br />
Major flood peak flows:<br />
40,000 cfs +<br />
Moderate flood peak flows:<br />
20,000 cfs–39,999 cfs<br />
As measured at Foster Park.
Flashy<br />
<strong>River</strong>ine Flooding<br />
In the flood of 1992, the rate of flow of<br />
the <strong>Ventura</strong> <strong>River</strong> rose from less than<br />
100 cfs to 46,700 cfs within about 3<br />
hours. (Keller and Capelli 1992)<br />
A 46,600% increase<br />
in 3 hours.<br />
<strong>Ventura</strong> <strong>River</strong> rescue, 1992<br />
(Photo courtesy of <strong>Ventura</strong> County Star)
Damaging<br />
<strong>River</strong>ine Flooding<br />
Sewer overflowing in San Antonio Creek, 2005<br />
(Photo: Ojai Valley Sanitary District)<br />
San Antonio Creek, 2005<br />
(Photo: Paul Jenkin)
Damaging<br />
<strong>River</strong>ine Flooding<br />
City of <strong>Ventura</strong>’s Nye Well 1A, Jan. 2005, which<br />
replaced Nye 1 lost in a previous flood.<br />
The Feb. 2005 flood took out the rest of the well.<br />
(Photo: <strong>Ventura</strong> Water)
Damaging<br />
<strong>River</strong>ine Flooding<br />
1992 Flood – Estimated Damages (in 1992 dollars)<br />
$1,000,000 - <strong>Ventura</strong> Beach RV Resort<br />
$40,000 - Emma Wood State Beach Group Camp<br />
$28,000 - Immediate emergency services (city of <strong>Ventura</strong>)<br />
$24,000 - Post-flood clean-up and repairs (city of <strong>Ventura</strong>)<br />
The bulk of the local emergency services (largely<br />
unreimbursable) costs were incurred by the <strong>Ventura</strong><br />
County Sheriff and Fire Departments for police and<br />
helicopter rescue services. (Keller and Capelli 1992)
<strong>River</strong>ine Flooding<br />
Damaging<br />
.<br />
(Map: <strong>Ventura</strong> County<br />
Office of Emergency<br />
Services website)
<strong>River</strong>ine Flooding<br />
About sediment as much as water<br />
Sediment flowing out to ocean,<br />
<strong>Ventura</strong> <strong>River</strong>, 2005<br />
(Photo: Copyright David L. Magney)<br />
Upstream of Hwy 150 Bridge,<br />
<strong>Ventura</strong> <strong>River</strong>, 2005<br />
(Photo: Copyright David L. Magney)
<strong>River</strong>ine Flooding<br />
About sediment as much as water<br />
The <strong>Ventura</strong> <strong>River</strong> has the highest<br />
suspended and bedload yield of<br />
sediment per unit area of watershed in<br />
Southern California. (Brownlee and<br />
Taylor, 1981; Taylor, 1983)
<strong>River</strong>ine Flooding<br />
About sediment as much as water<br />
Thacher Creek in Siete Robles neighborhood,<br />
2005<br />
(Photo: <strong>Ventura</strong> County <strong>Watershed</strong> Protection District)<br />
Stewart Canyon Debris Basin full, 2005<br />
(Photo: Copyright David L. Magney)
Alluvial Fan Flooding<br />
(Map: Ven. Co. WPD,<br />
East Ojai FLO-2D<br />
Floodplain Study )
Alluvial Fan Flooding<br />
Alluvial Fans:<br />
Fan-shaped<br />
deposits of<br />
rock and<br />
sediment that<br />
accumulate on<br />
valley floors<br />
adjacent to<br />
steep, erosive<br />
mountains,<br />
typically in dry<br />
climates.<br />
(Map: Ven. Co. WPD, East Ojai FLO-2D Floodplain Study )
Alluvial Fan Flooding<br />
High velocity<br />
Soule Park Golf<br />
Course, 2005<br />
(Photo: <strong>Ventura</strong> Co. <strong>Watershed</strong><br />
Protection District)
Alluvial Fan Flooding<br />
Full of debris<br />
Siete Robles neighborhood,<br />
located in the “active”<br />
depositional area of the<br />
alluvial fans<br />
(Photo: <strong>Ventura</strong> County <strong>Watershed</strong><br />
Protection District)
Alluvial Fan Flooding<br />
Unpredictable<br />
The stream<br />
channels<br />
associated with<br />
alluvial fans are<br />
shallow, not well<br />
defined and<br />
unpredictable.<br />
East Ojai Avenue, 1969<br />
(Photo courtesy of <strong>Ventura</strong> County Star)
Coastal Flooding<br />
Ocean driven onto land by<br />
• Storm surges<br />
• Storm-generated wind<br />
• Tides<br />
• Waves<br />
• Tsunamis<br />
• Rising sea level<br />
<strong>Ventura</strong> Pier, 1998<br />
(Photo: Paul Jenkin)
Coastal Flooding<br />
Erosion is a key concern<br />
<strong>Ventura</strong> Fairgrounds, 1972 & 2008<br />
(Photo: Copyright (C) 2002-2013 Kenneth & Gabrielle<br />
Adelman, California Coastal Records Project,<br />
www.Californiacoastline.org)
Coastal Flooding<br />
Erosion is a key concern<br />
Surfer’s Point, 1995<br />
(Photo: Paul Jenkin)
Urban<br />
Drainage<br />
Flooding<br />
Though generally<br />
presenting less danger,<br />
urban storm drains can<br />
also be overwhelmed<br />
by storm flows and<br />
cause flooding.<br />
<strong>Ventura</strong> Avenue<br />
(Photo: Lorraine Walter)<br />
Surfer’s Point<br />
1995<br />
(Photo: Paul Jenkin)
Dam<br />
Casitas Dam<br />
Matilija Dam<br />
Senior Canyon<br />
Dam<br />
Stewart Canyon<br />
Debris Basin<br />
Dam Failure Flooding<br />
The watershed has four dams that pose a potential<br />
failure hazard and are subject to dam safety regulations.<br />
Owner<br />
Dept. of Interior, Bureau of<br />
Reclamation<br />
<strong>Ventura</strong> Co. <strong>Watershed</strong><br />
Protection District<br />
Senior Canyon Mutual Water<br />
Company<br />
<strong>Ventura</strong> Co. <strong>Watershed</strong><br />
Protection District<br />
Capacity<br />
(acre-feet)<br />
Flood Route<br />
254,000 Coyote Creek, <strong>Ventura</strong> <strong>River</strong><br />
500* Matilija Creek, <strong>Ventura</strong> <strong>River</strong><br />
78 Senior Canyon, San Antonio<br />
Creek<br />
64.6 Stewart Canyon Creek<br />
channel, Stewart Canyon<br />
Creek, San Antonio Creek<br />
*The 6,000,000 cy of sediment behind the dam, which has displaced the water, also poses a significant dam failure hazard.
Dam Failure<br />
Flooding<br />
Disaster coordination and<br />
planning is the responsibility of<br />
the Sheriff's Office of<br />
Emergency Services (OES).<br />
OES maintains the County's<br />
Dam Failure Response Plan.<br />
Liquefaction, as a result of an<br />
earthquake, is one of the<br />
primary dam integrity concerns<br />
for the Casitas Dam.
Date<br />
Water<br />
Year<br />
Peak Flow<br />
(cfs)*<br />
% Annual<br />
Exceedance<br />
Probability<br />
Flood<br />
Category**<br />
Past <strong>Floods</strong><br />
*Peak flows as measured at Foster Park.<br />
1978, February 1978 63,600 1.5% Major<br />
1969, January 1969 58,000 2.2% Major<br />
1992, February 1992 45,800 5.2% Major<br />
1995, January 1995 43,700 6.0% Major<br />
2005, January 2005 41,000 7.3% Major<br />
1969, February 1969 40,000 7.8% Major<br />
1938, March 1938 39,200 8.2% Moderate<br />
1998, February 1998 38,800 8.5% Moderate<br />
1980, February 1980 37,900 9.0% Moderate<br />
1943, January 1943 35,000 11.0% Moderate<br />
1952, January 1952 29,500 16.1% Moderate<br />
2005, January 2005 29,400 16.2% Moderate<br />
1983, March 1983 27,000 19.1% Moderate<br />
1952, March 1952 24,600 22.5% Moderate<br />
1934, January 1934 23,000 25.2% Moderate<br />
1986, February 1986 22,100 26.8% Moderate<br />
2004, December 2005 20,600 30.9% Moderate<br />
1944, February 1944 20,000 32.9% Moderate<br />
2011, March 2011 19,100 32.9% Flood<br />
2001, March 2001 19,100 33.8% Flood<br />
2005, February 2005 18,800 38.1% Flood<br />
1958, April 1958 18,700 41.6% Flood<br />
1945, February 1945 17,000 43.1% Action<br />
1969, January 1969 16,600 45.5% Action<br />
1973, February 1973 15,700 47.1% Action<br />
1941, March 1941 15,200 50.2% Action
8 Presidentially-Declared<br />
Flood Disasters<br />
1962, February (Kennedy)<br />
1965, November-December (Johnson)<br />
1967, November-December (Johnson)<br />
1969, January (Nixon)<br />
1983, February-March (Reagan)<br />
1992, February (Bush)<br />
1995, January-March (Clinton)<br />
2005, January (Bush)<br />
Rancho Trailer Park, Casitas Springs<br />
<strong>Ventura</strong> <strong>River</strong>, 1969<br />
(Photo courtesy of <strong>Ventura</strong> County Star)
Significant Coastal <strong>Floods</strong><br />
1907, December<br />
1939, September<br />
1969, December<br />
1977-78, Winter<br />
1982-83, Winter<br />
The years of significant coastal<br />
flooding have not always been<br />
the same as those of significant<br />
riverine flooding.<br />
1988, January<br />
1997-98, Winter<br />
2010, January
Largest Annual Peak Flows<br />
at Foster Park<br />
70,000<br />
60,000<br />
cubic feet per second<br />
50,000<br />
40,000<br />
30,000<br />
20,000<br />
10,000<br />
0<br />
1930 1940 1950 1960 1970 1980 1990 2000 2010<br />
Water Year
Flood Protection Infrastructure<br />
• Levees<br />
• Debris & Detention Basins<br />
• Flood Control Channels
Levees<br />
Levee<br />
Year<br />
Built<br />
Location<br />
Length<br />
(miles)<br />
Built to Protect<br />
<strong>Ventura</strong> <strong>River</strong><br />
Levee<br />
Casitas Springs<br />
Levee<br />
Live Oak Levee<br />
1948 <strong>Ventura</strong>. From Pacific Ocean to Canada<br />
de San Joaquin<br />
1979 Ojai. From Santa Ana Blvd north to<br />
<strong>River</strong>side Rd.<br />
1978 Oak View. From Santa Ana Blvd. Bridge to<br />
the Live Oak Diversion (~where <strong>River</strong>side<br />
Rd. meets Burnham Rd.)<br />
2.65 City of <strong>Ventura</strong><br />
1 Casitas Springs<br />
1.28 Live Oak Acres
<strong>Ventura</strong> <strong>River</strong><br />
Levee
Casitas Springs<br />
Levee
Live Oak Levee
Levees<br />
All 3 levees in the watershed were found to have<br />
deficiencies such that they could not be certified, by<br />
a Nov. 2009 compliance deadline, as fully meeting<br />
federal standards.<br />
Potential Consequence:<br />
When new FEMA flood hazard maps are created,<br />
property owners behind the non-certified levees<br />
could be in a flood hazard zone, and those with<br />
federally-backed mortgages would be subject to<br />
mandatory federal flood insurance requirements.
Levees<br />
Casitas Springs and Live Oak Levees<br />
The Matilija Dam Ecosystem Restoration Project<br />
involves enhancing the Casitas Springs and Live Oak<br />
levees.<br />
Design work in process now.<br />
If sufficient construction funding can be secured for<br />
the levee rehabilitation projects, federal levee<br />
certification requirements should be met.
<strong>Ventura</strong> <strong>River</strong> Levee<br />
Levees<br />
<strong>Ventura</strong> County <strong>Watershed</strong> Protection District is<br />
engaged in preliminary design engineering work in<br />
support of levee retrofit/enhancement and is<br />
researching possible sources of funding.<br />
FEMA Regulation Changes<br />
At the same time, FEMA is also reassessing their<br />
requirements in an effort to improve flexibility as well<br />
as precision. These eventual regulatory changes may<br />
affect local levee certification positively.
Debris & Detention Basins<br />
Typically placed at canyon mouths, debris basins capture<br />
the sediment, gravel, boulders and vegetation that are<br />
washed out of canyons during storms.<br />
Stewart Canyon<br />
Debris Basin, Ojai<br />
10 acres in sizes,<br />
328,300 cy<br />
capacity<br />
(Photo: Lisa Brenneis)
Debris & Detention Basins<br />
Basin<br />
Year<br />
Built<br />
Location*<br />
<strong>Watershed</strong><br />
Area (acres)<br />
Maximum<br />
Debris Storage<br />
Capacity<br />
(cubic yards)<br />
Expected<br />
Debris<br />
Production for<br />
1% AEP* Flood<br />
(cubic yards)<br />
Dent Debris Basin<br />
Live Oak Diversion<br />
Dam<br />
McDonald Canyon<br />
Detention Basin<br />
Stewart Canyon<br />
Debris Basin<br />
1981 <strong>Ventura</strong>, behind De<br />
Anza Middle School<br />
2002 Oak View, west of<br />
Burnham Rd. between<br />
Santa Ana Rd. and Hwy<br />
150<br />
1998 Meiners Oaks, east of<br />
Hwy 33/Fairview Rd<br />
junction<br />
1963 Ojai, at north end of<br />
Canada St.<br />
19 4,100 1,624<br />
794 28,700 20,952<br />
573 23,400 20,179<br />
1,266 328,300 209,000<br />
*Annual Exceedance Probability
Debris & Detention Basins
Flood Control Channels<br />
Fox Canyon Barranca, 2005<br />
(Photo: Copyright David L. Magney)
The End