Vegetarian Alligators - Biology Biozine
Vegetarian Alligators - Biology Biozine
Vegetarian Alligators - Biology Biozine

Create successful ePaper yourself
Turn your PDF publications into a flip-book with our unique Google optimized e-Paper software.
Name _____________________________ Class _________________ Date _________________<br />
That’s Amazing! Worksheet<br />
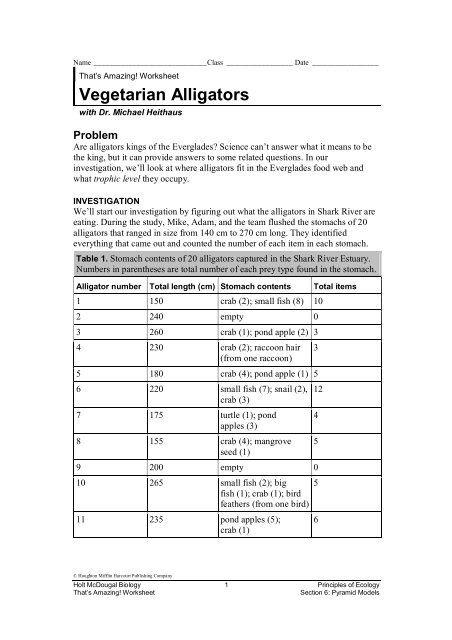
<strong>Vegetarian</strong> <strong>Alligators</strong><br />
with Dr. Michael Heithaus<br />
Problem<br />
Are alligators kings of the Everglades? Science can’t answer what it means to be<br />
the king, but it can provide answers to some related questions. In our<br />
investigation, we’ll look at where alligators fit in the Everglades food web and<br />
what trophic level they occupy.<br />
INVESTIGATION<br />
We’ll start our investigation by figuring out what the alligators in Shark River are<br />
eating. During the study, Mike, Adam, and the team flushed the stomachs of 20<br />
alligators that ranged in size from 140 cm to 270 cm long. They identified<br />
everything that came out and counted the number of each item in each stomach.<br />
Table 1. Stomach contents of 20 alligators captured in the Shark River Estuary.<br />
Numbers in parentheses are total number of each prey type found in the stomach.<br />
Alligator number Total length (cm) Stomach contents<br />
1 150 crab (2); small fish (8) 10<br />
2 240 empty 0<br />
3 260 crab (1); pond apple (2) 3<br />
4 230 crab (2); raccoon hair<br />
(from one raccoon)<br />
5 180 crab (4); pond apple (1) 5<br />
6 220 small fish (7); snail (2),<br />
crab (3)<br />
7 175 turtle (1); pond<br />
apples (3)<br />
8 155 crab (4); mangrove<br />
seed (1)<br />
9 200 empty 0<br />
10 265 small fish (2); big<br />
fish (1); crab (1); bird<br />
feathers (from one bird)<br />
11 235 pond apples (5);<br />
crab (1)<br />
Total items<br />
3<br />
12<br />
4<br />
5<br />
5<br />
6<br />
© Houghton Mifflin Harcourt Publishing Company<br />
Holt McDougal <strong>Biology</strong> 1 Principles of Ecology<br />
That’s Amazing! Worksheet<br />
Section 6: Pyramid Models
Name _____________________________ Class _________________ Date _________________<br />
<strong>Vegetarian</strong> <strong>Alligators</strong> continued<br />
Table 1 (continued)<br />
Alligator number Total length (cm) Stomach contents<br />
12 190 pond apples (1); bird<br />
feathers (from one bird)<br />
13 165 empty 0<br />
14 240 empty 0<br />
15 195 crab (1) 1<br />
16 255 crab (4) 4<br />
17 185 small fish (3);<br />
balloon (3)<br />
18 205 big fish (1); pond<br />
apple (1)<br />
19 215 empty 0<br />
20 230 crab (1); snail (1) 2<br />
1. Data Analysis How many alligators had food in their stomachs? __________<br />
2. Data Analysis How many food items, in total, were found in alligators? _____<br />
3. Use the information in Table 1 to fill out Table 2.<br />
Table 2. The amount of different food types in alligator stomachs<br />
Total food items<br />
Food type Number of stomachs Number of food items<br />
Crabs<br />
Small fishes<br />
Big fishes<br />
Snails<br />
Birds<br />
Mammals<br />
Reptiles<br />
Plants<br />
Human objects<br />
2<br />
6<br />
2<br />
© Houghton Mifflin Harcourt Publishing Company<br />
Holt McDougal <strong>Biology</strong> 2 Principles of Ecology<br />
That’s Amazing! Worksheet<br />
Section 6: Pyramid Models
Name _____________________________ Class _________________ Date _________________<br />
<strong>Vegetarian</strong> <strong>Alligators</strong> continued<br />
One way that biologists measure diet is by determining the proportion of<br />
individuals that have a particular type of food in their stomachs (Frequency %).<br />
Another method is to calculate the proportion of total food items that a particular<br />
type of food makes up (Number %).<br />
4. Data Analysis Use the following formulas to fill out Table 3.<br />
Table 3. Two measures of the relative importance of different food types to<br />
the diets of alligators in the Shark River Estuary<br />
Food type Frequency (%) Number (%)<br />
Crabs<br />
Small fishes<br />
Big fishes<br />
Snails<br />
Birds<br />
Mammals<br />
Reptiles<br />
Plants<br />
Human objects<br />
© Houghton Mifflin Harcourt Publishing Company<br />
Holt McDougal <strong>Biology</strong> 3 Principles of Ecology<br />
That’s Amazing! Worksheet<br />
Section 6: Pyramid Models
Name _____________________________ Class _________________ Date _________________<br />
<strong>Vegetarian</strong> <strong>Alligators</strong> continued<br />
5. Data Analysis Draw a bar graph of the Frequency (%) for each food type in<br />
the diets of alligators.<br />
6. Data Analysis Draw a bar graph of the Number (%) for each food type in the<br />
diets of alligators.<br />
© Houghton Mifflin Harcourt Publishing Company<br />
Holt McDougal <strong>Biology</strong> 4 Principles of Ecology<br />
That’s Amazing! Worksheet<br />
Section 6: Pyramid Models
Name _____________________________ Class _________________ Date _________________<br />
<strong>Vegetarian</strong> <strong>Alligators</strong> continued<br />
7. Data Analysis Describe the diets of alligators. What foods do they eat<br />
most frequently?<br />
____________________________________________________________<br />
____________________________________________________________<br />
____________________________________________________________<br />
____________________________________________________________<br />
8. Do the measures of Frequency (%) and Number (%) in alligator diets give you<br />
different information about what these alligators eat? Explain your answer.<br />
____________________________________________________________<br />
____________________________________________________________<br />
____________________________________________________________<br />
____________________________________________________________<br />
When we look at the stomach contents of alligators, we can only see what they ate<br />
at their most recent meal. In order to quantify their trophic level more accurately,<br />
we need to analyze what the alligators have been eating over the past several<br />
months. It turns out that the tissue samples that Mike and Adam took can help<br />
us find out!<br />
One way to determine trophic level is to analyze the nitrogen isotopes present in<br />
an organism's tissues. Two isotopes of nitrogen present in organisms are used to<br />
build proteins— 14 N and 15 N. The amount of 15 N is given by the value delta 15 N.<br />
When predators eat prey, they accumulate more 15 N than 14 N. So, you can infer<br />
an organism’s level in a food chain by its relative level of 15 N—the higher the<br />
delta 15 N, the higher the trophic level of an organism. In fact, based on many<br />
studies in the laboratory and in the field, we know that delta 15 N increases by an<br />
average of 3 parts per thousand (‰) at each trophic level.<br />
For example, if the delta 15 N of a certain plant is 2.0 ‰, then an herbivore that eats<br />
that plant will have a delta 15 N of 5.0 ‰, and if a predator eats just that herbivore<br />
it will have a delta 15 N of 8.0 ‰. However, it isn’t always that simple. Usually<br />
ecosystems are better represented by food webs than by food chains, because most<br />
organisms eat more than one type of food. That means that the actual delta 15 N<br />
values of organisms in the wild are usually not whole numbers. Table 4 shows the<br />
delta 15 N values of 10 alligators and the mean delta 15 N for other organisms in the<br />
Shark River.<br />
© Houghton Mifflin Harcourt Publishing Company<br />
Holt McDougal <strong>Biology</strong> 5 Principles of Ecology<br />
That’s Amazing! Worksheet<br />
Section 6: Pyramid Models
Name _____________________________ Class _________________ Date _________________<br />
<strong>Vegetarian</strong> <strong>Alligators</strong> continued<br />
9. Data Analysis Calculate the trophic level of the following organisms to<br />
complete the table, using the following formula:<br />
Table 4. delta 15 N values and trophic levels of organisms in the Shark River<br />
estuary. The lengths of individuals sampled are given in parentheses.<br />
Organism delta 15 N Trophic level<br />
Mangrove 2.0 1<br />
Phytoplankton 2.0 1<br />
Herbivorous snail 5.0 2<br />
Florida gar (fish 35-50 cm long fish) 11.0<br />
Snook (fish 50-70 cm long) 12.0<br />
Juvenile bull shark (70-120 cm long) 12.5<br />
American crocodile (320 cm) 14.0<br />
Alligator (150 cm) 8<br />
Alligator ( 235 cm) 9<br />
Alligator (265 cm) 8.5<br />
Alligator (185 cm) 9.5<br />
Alligator (270 cm) 9<br />
Alligator (220 cm) 8<br />
Alligator (195 cm) 8.5<br />
Alligator (240 cm) 9<br />
Alligator (160 cm) 9.5<br />
Alligator (250 cm) 8<br />
Alligator average 8.7<br />
© Houghton Mifflin Harcourt Publishing Company<br />
Holt McDougal <strong>Biology</strong> 6 Principles of Ecology<br />
That’s Amazing! Worksheet<br />
Section 6: Pyramid Models
Name _____________________________ Class _________________ Date _________________<br />
<strong>Vegetarian</strong> <strong>Alligators</strong> continued<br />
CONCLUSION<br />
10. Based on the 15 N isotope data, are alligators the top predators in the Florida<br />
Everglades? Explain your answer.<br />
____________________________________________________________<br />
____________________________________________________________<br />
____________________________________________________________<br />
11. How did the results of the diet studies compare to what you expected to find?<br />
____________________________________________________________<br />
____________________________________________________________<br />
____________________________________________________________<br />
____________________________________________________________<br />
12. So, are alligators the kings of the Everglades? Use what you have learned and<br />
the data you analyzed to support your position.<br />
____________________________________________________________<br />
____________________________________________________________<br />
____________________________________________________________<br />
____________________________________________________________<br />
13. Extension What further studies you would propose to do to help answer<br />
this question?<br />
____________________________________________________________<br />
____________________________________________________________<br />
____________________________________________________________<br />
____________________________________________________________<br />
____________________________________________________________<br />
© Houghton Mifflin Harcourt Publishing Company<br />
Holt McDougal <strong>Biology</strong> 7 Principles of Ecology<br />
That’s Amazing! Worksheet<br />
Section 6: Pyramid Models