Iss31 Art3 - Numerical Analysis of Piled Embankments ... - Plaxis
Iss31 Art3 - Numerical Analysis of Piled Embankments ... - Plaxis
Iss31 Art3 - Numerical Analysis of Piled Embankments ... - Plaxis

Create successful ePaper yourself
Turn your PDF publications into a flip-book with our unique Google optimized e-Paper software.
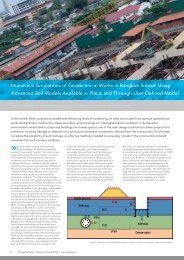
<strong>Numerical</strong> analysis <strong>of</strong> geosynthetic reinforced piled embankment scale model tests<br />
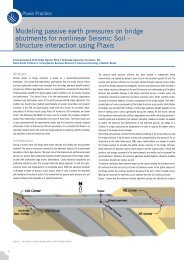
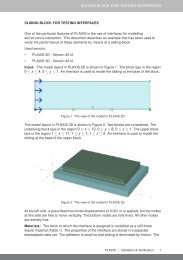
Figure 4: 3D finite element model<br />
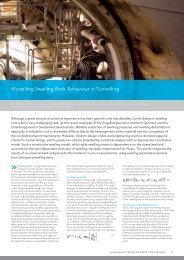
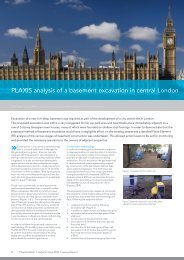
Figure 5: Effective principal stresses <strong>of</strong> the vacuum phase<br />
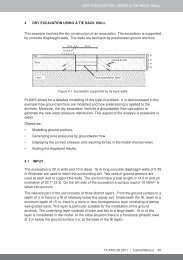
Tunnel an interface cannot be applied at the back<br />
side. To keep the amount <strong>of</strong> load distribution<br />
comparable to the scale test, the top load is<br />
reduced by the amount <strong>of</strong> friction, and no<br />
interface is applied. The disturbance <strong>of</strong> the friction<br />
on the load distribution in the embankment is<br />
therefore neglected in the model. The friction<br />
between the piles and the foam cushion is<br />
assumed to be small and its influence on arching<br />
within the fill is limited. Therefore the friction<br />
between the pile and foam cushion is also<br />
neglected.<br />
The calculation phases <strong>of</strong> the model are based on<br />
the scale test procedure. The top load and water<br />
pressure measured during each step <strong>of</strong> the scale<br />
test procedure is an input value in the calculation<br />
phases. During the initial phase, the water<br />
pressure and SMweight are set to zero, to avoid<br />
an asymmetric situation. In the following phases,<br />
the scale test is build up and the soil weight is<br />
activated. Then the measured load with<br />
corresponding water pressure is applied. During<br />
the last phase, where there is no subsoil support<br />
against the GR, the subsoil and water pressure are<br />
deactivated.<br />
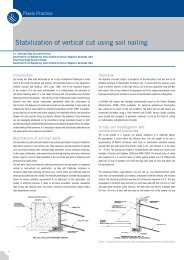
Figure 6: Vertical displacement <strong>of</strong> the vacuum phase<br />
Results<br />
During the vacuum phase there is a constant high<br />
top load applied and there is no subsoil support.<br />
Therefore, the vacuum phase has the largest<br />
deformation. This is the most representative<br />
situation and will be presented in the figures<br />
below. The calculated principal stresses in the<br />
vacuum phase are shown in figure 5. From the<br />
figure, soil arching can be observed. The<br />
calculated vertical displacements are shown in<br />
figure 6. The differential displacements on top <strong>of</strong><br />
the embankment are very small. The tensile forces<br />
in the GR are presented in figure 7. The tensile<br />
forces in the GR are concentrated in ‘tensile strips’.<br />
The tensile strips are the areas <strong>of</strong> that GR that lie<br />
on top <strong>of</strong> and between adjacent piles. The<br />
maximum tensile forces are found in the GR at the<br />
edge <strong>of</strong> the piles. The exact location <strong>of</strong> the peak<br />
values cannot be determined, because the mesh is<br />
too coarse.<br />
The load distribution for the FEM model and the<br />
scale test are plotted in figure 8. The horizontal<br />
axis presents the net load. The net load is the top<br />
load minus subsoil support and friction. Load<br />
parts A and B are presented on the vertical axis in<br />
kN per pile and as percentage <strong>of</strong> the total load<br />
(A+B+C). The figures show two types <strong>of</strong> loading:<br />
top load increase and drainage <strong>of</strong> subsoil<br />
(consolidation). The load transferred directly to the<br />
piles due to arching is load A and the load<br />
transferred through the GR to the piles is load B.<br />
During the first part <strong>of</strong> the test, until the net load is<br />
ca.11 kN/pile, the calculated results <strong>of</strong> load parts A<br />
and B agree quite well with the measured results.<br />
Then the calculated results diverge from the<br />
measured results. Load part A is overestimated<br />
and load part B is underestimated. The calculated<br />
load parts A and B show a smooth relationship<br />
with the net load. This agrees with the conclusion<br />
<strong>of</strong> the measurements. During the first drainage<br />
step with zero top load, the percentage <strong>of</strong> load<br />
part A (A %) increases significantly. This means<br />
that arching occurs immediately. Not only during<br />
the first drainage step, but also in the following<br />
drainage steps load part A % increases. This shows<br />
that subsoil settlement is needed for the<br />
development <strong>of</strong> arching. This conclusion can be<br />
drawn for both the measured and calculated<br />
results. During the steps with increasing top load,<br />
load part A % on the embankment decreases.<br />
From this it follows that during increasing top load<br />
the arching effect decreases, as long as<br />
consolidation does not occur.<br />
www.plaxis.nl l Spring issue 2012 l <strong>Plaxis</strong> Bulletin 15