Prediction of soil deformations during excavation works for ... - Plaxis
Prediction of soil deformations during excavation works for ... - Plaxis
Prediction of soil deformations during excavation works for ... - Plaxis

Create successful ePaper yourself
Turn your PDF publications into a flip-book with our unique Google optimized e-Paper software.
<strong>Plaxis</strong> Practice<br />
<strong>Prediction</strong> <strong>of</strong> <strong>soil</strong> <strong>de<strong>for</strong>mations</strong> <strong>during</strong> <strong>excavation</strong><br />
<strong>works</strong> <strong>for</strong> the renovation <strong>of</strong> “Het Nieuwe<br />
Rijksmuseum” in Amsterdam, The Netherlands<br />
Dipl.-Ing. H.D. Netzel (CRUX Engineering b.v.)<br />
Ir. D. Vink (CRUX Engineering b.v.)<br />
Introduction<br />
The “Rijksmuseum” in Amsterdam is one <strong>of</strong> the most important 19th century monumental<br />
buildings in The Netherlands. The showpiece <strong>of</strong> the museum is the world famous The<br />
Night Watch by Rembrandt. Presently the building is being renovated in order to meet<br />
the modern standards <strong>for</strong> international museums. The design <strong>of</strong> the renovation has<br />
been drawn by Cruz y Ortiz from Sevilla. The constructive design is being carried out by<br />
ARCADIS in cooperation with CRUX Engineering and WARECO <strong>for</strong> the assessment <strong>of</strong> the<br />
geotechnical and hydrological implications <strong>of</strong> the project. The most striking feature in<br />
the new design is a semi-underground square <strong>of</strong> approximately 3000 m 2 in between the<br />
existing monumental building. This square is situated in the existing court yards and<br />
will serve as main entrance to the museum. The geotechnical design calculations are<br />
carried out by CRUX using the Finite Element program PLAXIS. The calculations are part<br />
<strong>of</strong> the risk assessment strategy in order to predict and judge the influence <strong>of</strong> ground<br />
<strong>de<strong>for</strong>mations</strong> due to the <strong>excavation</strong>s on the surrounding building. Intensive monitoring<br />
is used to control the <strong>de<strong>for</strong>mations</strong> <strong>of</strong> the structure and the sheet pile walls <strong>during</strong> the<br />
construction work.<br />
General<br />
The realization <strong>of</strong> the lowered square and underground facility rooms requires the<br />
construction <strong>of</strong> concrete cellars with a depth <strong>of</strong> 6 m or more, right next to the existing<br />
wooden foundation piles <strong>of</strong> the monumental building. The cellars will be cast in building<br />
pits, the <strong>excavation</strong> <strong>of</strong> which will cause relaxation <strong>of</strong> the <strong>soil</strong>, inducing <strong>de<strong>for</strong>mations</strong> in<br />
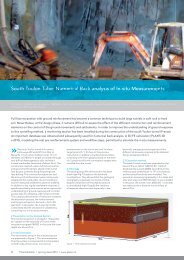
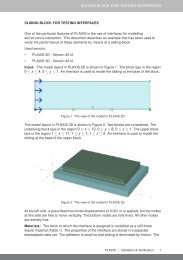
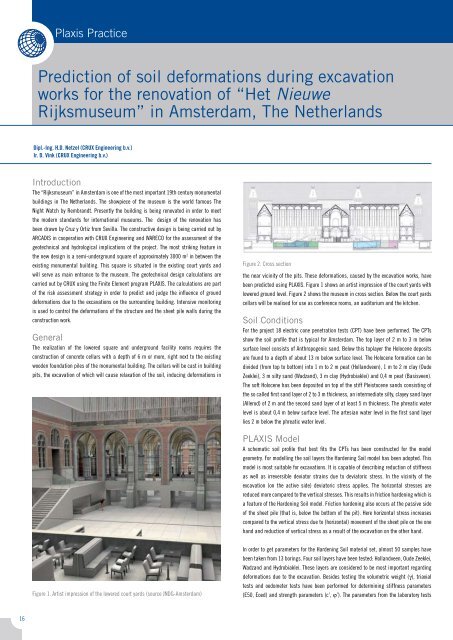
Figure 2. Cross section<br />
the near vicinity <strong>of</strong> the pits. These <strong>de<strong>for</strong>mations</strong>, caused by the <strong>excavation</strong> <strong>works</strong>, have<br />
been predicted using PLAXIS. Figure 1 shows an artist impression <strong>of</strong> the court yards with<br />
lowered ground level. Figure 2 shows the museum in cross section. Below the court yards<br />
cellars will be realised <strong>for</strong> use as conference rooms, an auditorium and the kitchen.<br />
Soil Conditions<br />
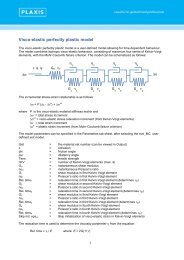
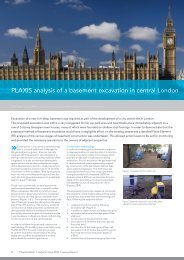
For the project 18 electric cone penetration tests (CPT) have been per<strong>for</strong>med. The CPTs<br />
show the <strong>soil</strong> pr<strong>of</strong>ile that is typical <strong>for</strong> Amsterdam. The top layer <strong>of</strong> 2 m to 3 m below<br />
surface level consists <strong>of</strong> Anthropogenic sand. Below this toplayer the Holocene deposits<br />
are found to a depth <strong>of</strong> about 13 m below surface level. The Holocene <strong>for</strong>mation can be<br />
divided (from top to bottom) into 1 m to 2 m peat (Hollandveen), 1 m to 2 m clay (Oude<br />
Zeeklei), 3 m silty sand (Wadzand), 3 m clay (Hydrobiaklei) and 0,4 m peat (Basisveen).<br />
The s<strong>of</strong>t Holocene has been deposited on top <strong>of</strong> the stiff Pleistocene sands consisting <strong>of</strong><br />
the so called first sand layer <strong>of</strong> 2 to 3 m thickness, an intermediate silty, clayey sand layer<br />
(Allerod) <strong>of</strong> 2 m and the second sand layer <strong>of</strong> at least 5 m thickness. The phreatic water<br />
level is about 0,4 m below surface level. The artesian water level in the first sand layer<br />
lies 2 m below the phreatic water level.<br />
PLAXIS Model<br />
A schematic <strong>soil</strong> pr<strong>of</strong>ile that best fits the CPTs has been constructed <strong>for</strong> the model<br />
geometry. For modelling the <strong>soil</strong> layers the Hardening Soil model has been adopted. This<br />
model is most suitable <strong>for</strong> <strong>excavation</strong>s. It is capable <strong>of</strong> describing reduction <strong>of</strong> stiffness<br />
as well as irreversible deviator strains due to deviatoric stress. In the vicinity <strong>of</strong> the<br />
<strong>excavation</strong> (on the active side) deviatoric stress applies. The horizontal stresses are<br />
reduced more compared to the vertical stresses. This results in friction hardening which is<br />
a feature <strong>of</strong> the Hardening Soil model. Friction hardening also occurs at the passive side<br />
<strong>of</strong> the sheet pile (that is, below the bottom <strong>of</strong> the pit). Here horizontal stress increases<br />
compared to the vertical stress due to (horizontal) movement <strong>of</strong> the sheet pile on the one<br />
hand and reduction <strong>of</strong> vertical stress as a result <strong>of</strong> the <strong>excavation</strong> on the other hand.<br />
Figure 1. Artist impression <strong>of</strong> the lowered court yards (source JNDG-Amsterdam)<br />
In order to get parameters <strong>for</strong> the Hardening Soil material set, almost 50 samples have<br />
been taken from 13 borings. Four <strong>soil</strong> layers have been tested: Hollandveen, Oude Zeeklei,<br />
Wadzand and Hydrobiaklei. These layers are considered to be most important regarding<br />
<strong>de<strong>for</strong>mations</strong> due to the <strong>excavation</strong>. Besides testing the volumetric weight (γ), triaxial<br />
tests and oedometer tests have been per<strong>for</strong>med <strong>for</strong> determining stiffness parameters<br />
(E50, Eoed) and strength parameters (c’, ϕ’). The parameters from the laboratory tests<br />
16
<strong>Plaxis</strong> Practice<br />
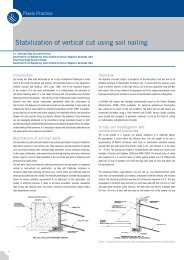
The cross section shown in Figure 2 has been modelled in <strong>Plaxis</strong> 2D using the plane strain<br />
model consisting <strong>of</strong> a mesh <strong>of</strong> triangular elements with 15 nodes. In total 89 clusters<br />
have been defined. The generated mesh contains1906 elements. A picture <strong>of</strong> the model<br />
geometry is shown in Figure 4.<br />
Figure 3. Characteristic Soil pr<strong>of</strong>ile<br />
have been compared to available parameter sets from other projects in the central part <strong>of</strong><br />
Amsterdam. They generally show a good agreement. For the calculations the mean values<br />
<strong>of</strong> stiffness have been taken whereas <strong>for</strong> the strength the low representative values apply.<br />
Table 1 contains the <strong>soil</strong> parameters <strong>for</strong> the Hardening Soil material data set.<br />
Due to the considerable length <strong>of</strong> the cross section only part <strong>of</strong> it has been modelled in<br />
order to reduce the number <strong>of</strong> elements and calculation time. The western court yard<br />
with its sloping bottom has been entirely included in the model geometry; however only<br />
one symmetric half <strong>of</strong> the eastern court yard has been taken into account. The distance<br />
between the boundaries on the left and the right side <strong>of</strong> the model geometry is 100 m.<br />
The bottom level is set at NAP ‐30 m; the top level at NAP +0,0 m. No existing structural<br />
elements such as foundation piles, foundation beams or floors have been modelled.<br />
Hence, the model considers a green field calculation in which the stiffness <strong>of</strong> these<br />
elements is neglected. This is a conservative approach regarding the expected differential<br />
<strong>de<strong>for</strong>mations</strong> <strong>of</strong> the adjacent structure. Existing loads from the building on the stiff sands<br />
at pile tip level have however been taken into account.<br />
The sheet pile walls (three in number) have been modelled as a beam element with the<br />
characteristics <strong>of</strong> AZ 18 pr<strong>of</strong>iles. The piles <strong>of</strong> the underwater concrete floor are loaded by<br />
tensional <strong>for</strong>ces <strong>during</strong> pumping dry the building pits. Anchor elements and geotextile<br />
Table 1. Hardening Soil parameter set<br />
ID Name Type γ unset<br />
γ set<br />
k x<br />
k y<br />
ref<br />
E 50<br />
ref<br />
E oed<br />
ref<br />
E ur<br />
c ref ϕ ψ<br />
[kN/m 3 ] [kN/m 3 ] [kN/m 3 ] [m/day] [m/day] [kN/m 2 ] [kN/m 2 ] [kN/m 2 ] [kN/m 2 ] [º] [º]<br />
1 1st sand layer Drained 19,8 19,8 1,3E+01 1,3E+01 35000 20000 100000 1,0 33,0 3<br />
2 2nd sand layer Drained 19 19 8,0E+00 8,0E+00 32000 25000 80000 1,0 33,0 3<br />
3 Allerod Undrained 18,5 18,5 2,6E+00 2,6E+00 15000 9140 30000 3,0 28,0 0<br />
4 Hollandveen Undrained 10,5 10,5 1,7E-03 8,6E-04 2200 1187 8817 12,1 18,2 0<br />
5 Top layer Drained 17 18,4 8,6E-01 8,6E-01 17000 15000 50000 1,0 27,0 0<br />
6 oude zeeklei Undrained 15,4 15,4 1,3E-04 1,3E-04 9400 5429 20000 2,8 27,4 0<br />
7 wadzand Undrained 18,1 18,1 8,6E-03 8,6E-03 11600 4904 25000 2,0 34,9 4,9<br />
8 Hydrobiaklei Undrained 14,7 14,7 9,0E-05 9,0E-05 5700 3791 11400 13,3 23,3 0<br />
11 basisveen Undrained 11,7 11,7 1,0E-03 1,0E-03 2000 1004 7000 6,0 21,0 0<br />
ID Name k ur<br />
p ref Power K o:nc<br />
c_incr y ref P f<br />
T-Strength R inter<br />
[-] [kN/m 2 ] [-] [-] [kN/m 3 ] [m] [-] [kN/m 2 ] [-]<br />
1 1st sand layer 0,2 100 0,5 0,40 0 0 0,9 0 0,67<br />
2 2nd sand layer 0,2 100 0,5 0,46 0 0 0,9 0 0,375<br />
3 Allerod 0,2 100 0,5 0,50 0 0 0,9 0 0,67<br />
4 Hollandveen 0,15 100 0,72 0,69 0 0 0,9 0 0,5<br />
5 ophooglaag 0,15 100 0,8 0,55 0 0 0,9 0 0,67<br />
6 oude zeeklei 0,15 100 0,57 0,54 0 0 0,9 0 0,67<br />
7 wadzand 0,2 100 0,75 0,43 0 0 0,9 0 0,67<br />
8 Hydrobiaklei 0,15 100 0,59 0,60 0 0 0,9 0 0,67<br />
11 basisveen 0,2 100 0,8 0,65 0 0 0,9 0 0,5<br />
17
<strong>Plaxis</strong> Practice<br />
<strong>Prediction</strong> <strong>of</strong> <strong>soil</strong> <strong>de<strong>for</strong>mations</strong> <strong>during</strong> <strong>excavation</strong><br />
<strong>works</strong> <strong>for</strong> the renovation <strong>of</strong> “Het Nieuwe<br />
Rijksmuseum” in Amsterdam, The Netherlands<br />
Continuation<br />
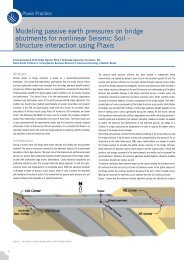
Risk assessment <strong>of</strong> influence on the existing<br />
building and its foundation<br />
The calculated greenfield <strong>de<strong>for</strong>mations</strong> are used to access the influence on the existing<br />
Rijksmuseum building. The following aspects are considered:<br />
Figure 4. Model geometry<br />
elements have been chosen to model the tension piles. The tensional stiffness <strong>of</strong> these<br />
elements has been adapted as to match the stiffness <strong>of</strong> the line <strong>of</strong> piles by dividing the<br />
axial pile stiffness by the center-to-center distance <strong>of</strong> 2,5 m <strong>of</strong> the piles.<br />
Construction phases<br />
Table 2 shows the construction phases with a short description. Except <strong>for</strong> the consolidation<br />
phases, all phases are <strong>of</strong> plastic analysis type. Consolidation phases have been defined<br />
in order to allow <strong>for</strong> dissipation <strong>of</strong> excess pore (under)pressures that develop <strong>during</strong><br />
<strong>excavation</strong>.<br />
- Horizontal <strong>soil</strong> displacements can cause lateral pile loading affecting the bending<br />
capacity <strong>of</strong> the existing wooden foundation piles <strong>of</strong> the Rijksmuseum.<br />
- Vertical <strong>soil</strong> displacements on surface and pile toe level (1st sand layer) can cause pile<br />
and consequently (differential) building <strong>de<strong>for</strong>mations</strong>. Vertical <strong>soil</strong> displacement at<br />
surface level needs to be controlled because settling <strong>soil</strong> may lead to an increase in<br />
negative shaft friction on the existing wooden foundation piles.<br />
- Reduction <strong>of</strong> effective stress at pile tip level due to the <strong>excavation</strong> may lead to reduced<br />
bearing capacity <strong>of</strong> the end-bearing piles <strong>of</strong> the Rijksmuseum close to the <strong>excavation</strong>.<br />
These aspects are analysed with numerical, analytical and empirical prediction methods<br />
in order to quantify the damage risks.<br />
Results<br />
For all main construction stages the following relevant <strong>de<strong>for</strong>mations</strong> and stresses have<br />
been read from the output:<br />
- horizontal de<strong>for</strong>mation <strong>of</strong> the sheet pile wall;<br />
- horizontal and vertical <strong>de<strong>for</strong>mations</strong> in a horizontal cross-section at surface level;<br />
- vertical de<strong>for</strong>mation in a horizontal cross-section at pile tip level;<br />
Table 2: Overview <strong>of</strong> construction phases<br />
Phase Description <strong>soil</strong> behaviour<br />
foundation load on and load passage on loads from pile groups and load <strong>of</strong> passage activated (historic higher surface level) drained<br />
load passage <strong>of</strong>f load <strong>of</strong> passage deactivated in accordance with actual surface level drained<br />
sheet pile walls on beams activated; reset displacements from previous stages to zero drained<br />
East: strut +0,0; <strong>excavation</strong> ‐2,6; water level -3,8 strut court yard east activated; lowering <strong>of</strong> water level in eastern pit to NAP‐3,8 m and<br />
<strong>excavation</strong> to NAP‐2,6m (this dry <strong>excavation</strong> step is necessary due to the <strong>soil</strong><br />
decontamination in the above layers)<br />
undrained<br />
West: strut +0,5; <strong>excavation</strong> ‐2,6; water level -3,8 strut court yard west activated; lowering <strong>of</strong> water level in western pit to NAP‐3,8 m and<br />
<strong>excavation</strong> to NAP‐2,6m (this dry <strong>excavation</strong> step is necessary due to the <strong>soil</strong> decontamination<br />
in the above layers)<br />
undrained<br />
consolidation 21d consolidation phase, 21 days consolidation<br />
water level -0,8 water level in both pits rises from NAP‐3,8m to NAP‐0,8m undrained<br />
East: <strong>excavation</strong> -7,0; water level ‐0,8 final <strong>excavation</strong> pit east to NAP‐7,0m; water level in pit remains NAP‐0,8m undrained<br />
West: <strong>excavation</strong> -7,7/-7,0; water level ‐0,8 Final <strong>excavation</strong> pit west to depth <strong>of</strong> NAP-7,0m to NAP‐7,7m; water level in pit remains NAP‐0,8m undrained<br />
consolidation 30d consolidation phase, 30 days consolidation<br />
East & West: underwater concrete underwater concrete clusters activated and material set applied undrained<br />
East: pump dry water in pit east is removed undrained<br />
West: pump dry water in pit west is removed undrained<br />
18
<strong>Plaxis</strong> Practice<br />
- modification <strong>of</strong> effective <strong>soil</strong> stresses near pile tips <strong>of</strong> the existing piles <strong>of</strong> the<br />
Rijksmuseum.<br />
Figure 5 shows the de<strong>for</strong>med model and the contourplot <strong>of</strong> the <strong>de<strong>for</strong>mations</strong> in the fully<br />
excavated situation.<br />
Figure 6 shows the lateral deflections <strong>of</strong> the sheet pile wall in different stages <strong>of</strong> the<br />
<strong>excavation</strong>.<br />
Figure 6. Lateral de<strong>for</strong>mation <strong>of</strong> the sheet pile wall<br />
Figure 5. shadings plot <strong>of</strong> total <strong>de<strong>for</strong>mations</strong> in final construction phase<br />
The calculated maximum <strong>de<strong>for</strong>mations</strong> are summarized in Table 3.<br />
These greenfield results are translated to the pile foundations and the adjacent building<br />
<strong>of</strong> the Rijksmuseum in order to quantify the impact on the adjacent structrure. The maximum<br />
cumulative de<strong>for</strong>mation due to the different sources is predicted to be 5mm and<br />
the angular distortion along the building is restricted to be 1/3000. The risk <strong>of</strong> damage<br />
at the masonry structures is negligible and the bending capacity <strong>of</strong> the wooden piles is<br />
sufficient in order to withstand the additional lateral pile loading due to the <strong>excavation</strong>.<br />
Conclusion<br />
In order to predict <strong>soil</strong> <strong>de<strong>for</strong>mations</strong> in the vicinity <strong>of</strong> two <strong>excavation</strong> sites that are located<br />
inside the monumental building <strong>of</strong> the Rijksmuseum in Amsterdam extensive PLAXIS calculations<br />
have been per<strong>for</strong>med. The design <strong>of</strong> the <strong>excavation</strong> <strong>of</strong> the building pits with an<br />
underwater concrete floor is predicted to cause an acceptable influence on the adjacent<br />
structure. The locations and the extent <strong>of</strong> the monitoring <strong>of</strong> the building and the sheet<br />
pile wall was derived from these risk analysis. The per<strong>for</strong>mance <strong>of</strong> the construction work<br />
on the adjacent building will be frequently compared with the predicted <strong>de<strong>for</strong>mations</strong> in<br />
order to be able to anticipate in time with regard to unexpected de<strong>for</strong>mation trends <strong>during</strong><br />
the construction process.<br />
References:<br />
[1] A.M. De Roo, H.D. Netzel, P.J.M. Den Nijs; “Omgaan met risico’s bij de renovatie van<br />
Het Nieuwe Rijksmuseum”; in Dutch; journal GEOTECHNIEK edition 3, juli 2006.<br />
Acknowledgments:<br />
The project organisation “Het Nieuwe Rijkmuseum” is greatfully acknowledged <strong>for</strong> providing<br />
the permittion to publish this article.<br />
Table 3: maximum de<strong>for</strong>mation<br />
Type and location<br />
Value<br />
Maximum horizontal <strong>soil</strong> displacement at surface level at the location <strong>of</strong> the piles <strong>of</strong> the existing building (at closest distance to the sheet pile wall)<br />
17mm<br />
Maximum surface settlement at the location <strong>of</strong> the piles <strong>of</strong> the existing building (at closest distance to the sheet pile wall)<br />
12mm<br />
Maximum settlement on pile toe level at the location <strong>of</strong> the piles <strong>of</strong> the existing building (at closest distance to the sheet pile wall)<br />
mm<br />
Maximum lateral wall deflection <strong>of</strong> the sheet pile wall<br />
9mm<br />
Reduction <strong>of</strong> vertical effective <strong>soil</strong> stress at at the location <strong>of</strong> the pile toes <strong>of</strong> the existing building (at closest distance to the sheet pile wall) 15%<br />
19