Learning Targets: o I can interpret and label supply and demand ...
Learning Targets: o I can interpret and label supply and demand ...
Learning Targets: o I can interpret and label supply and demand ...

Create successful ePaper yourself
Turn your PDF publications into a flip-book with our unique Google optimized e-Paper software.
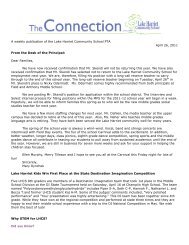
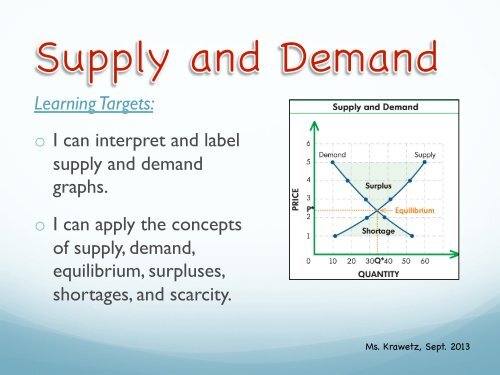
<strong>Learning</strong> <strong>Targets</strong>:<br />
o I <strong>can</strong> <strong>interpret</strong> <strong>and</strong> <strong>label</strong><br />
<strong>supply</strong> <strong>and</strong> dem<strong>and</strong><br />
graphs. <br />
o I <strong>can</strong> apply the concepts<br />
of <strong>supply</strong>, dem<strong>and</strong>,<br />
equilibrium, surpluses,<br />
shortages, <strong>and</strong> scarcity. <br />
Ms. Krawetz, Sept. 2013
Supply <strong>and</strong> Dem<strong>and</strong>
In economics… <br />
1. What does the term “<strong>supply</strong>” mean? <br />
2. What does the term “dem<strong>and</strong>” mean? <br />
3. What do you think the concept of “<strong>supply</strong><br />
<strong>and</strong> dem<strong>and</strong>” is about?
1. FREE MARKET ECONOMY<br />
o A completely “FREE” Market Economy is an economy<br />
when buyers <strong>and</strong> sellers are allowed to transact freely<br />
(buy/sell/trade) based on a mutual agreement on price<br />
without or government intervention such as taxes,<br />
subsidies or regulations<br />
o In a FREE Market Economy, consumers determine the<br />
dem<strong>and</strong> of a product, <strong>and</strong> sellers see the dem<strong>and</strong> <strong>and</strong><br />
make more of the product.
2. What Is SUPPLY…<br />
When producers are willing to<br />
<strong>supply</strong> or provide a good or service<br />
at different prices. <br />
When business people hope to<br />
make a profit from items or<br />
services produced or provided.<br />
E.g. General Mills makes makes<br />
Cheerios, <strong>and</strong> Market Pantry produces<br />
a similar cereal.
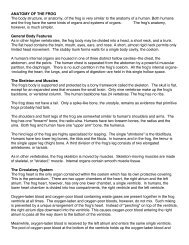
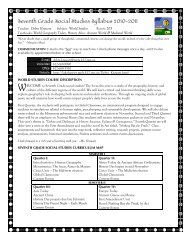
Definition: Law of Supply <br />
The Law of Supply demonstrates the quantities sold at a certain<br />
price. The <strong>supply</strong> relationship in blue shows an upward slope. This<br />
means the higher the price, the higher the quantity supplied. <br />
Producers <strong>supply</strong> more at a higher price because selling a higher<br />
quantity at a higher price increases profit. P=Price Q= Quantity <br />
A, B <strong>and</strong> C are points on the <strong>supply</strong><br />
curve. Each point reflects a direct<br />
correlation between the quantity<br />
supplied (Q) <strong>and</strong> the price (P). <br />
• At point A, the quantity will be Q1<br />
• At point B , Q2 <br />
• At point C, Q3
3. WHAT IS DEMAND? <br />
An individual’s need or desire for a good or service at<br />
a given price. <br />
Individuals are willing to consume more of a product or<br />
service at a lower price.<br />
When the dem<strong>and</strong> is high, competitors see opportunity<br />
in the market to make a profit. <br />
E.g. Flip flops <strong>and</strong> iPhones are popular items in dem<strong>and</strong> <strong>and</strong><br />
consumers desire them.
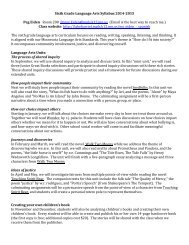
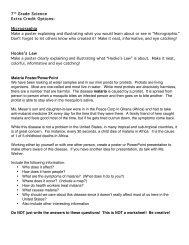
Definition: Law of Dem<strong>and</strong> <br />
The law of dem<strong>and</strong> states that, if all other factors remain equal,<br />
the higher the price of a good, the less people will dem<strong>and</strong> that<br />
good. As price increase, consumer dem<strong>and</strong> decreases. The dem<strong>and</strong><br />
relationship in green shows a downward slope <br />
A, B <strong>and</strong> C, points on the dem<strong>and</strong> curve<br />
downward slope, show the negative<br />
relationship between price <strong>and</strong> quantity<br />
dem<strong>and</strong>ed. A, C & C reflect a direct<br />
correlation between quantity dem<strong>and</strong>ed<br />
(Q) <strong>and</strong> price (P).<br />
• At point A, the quantity dem<strong>and</strong>ed will<br />
be Q1 <strong>and</strong> the price will be P1 at B, Q2.<br />
• The higher the price, the lower the<br />
quantity dem<strong>and</strong>ed E.g. (A) <br />
• The lower the price, the more the good<br />
will be in dem<strong>and</strong> E.g. (C)
LAW OF SUPPLY & DEMAND<br />
Definition: The Law of Supply <strong>and</strong> Dem<strong>and</strong> explains<br />
the interaction between the <strong>supply</strong> of a resource<br />
<strong>and</strong> the dem<strong>and</strong> for that resource. <br />
o The law of <strong>supply</strong> & dem<strong>and</strong> define the effect the <strong>supply</strong><br />
of a product <strong>and</strong> the dem<strong>and</strong> for it has on price.<br />
o If there is a low <strong>supply</strong> <strong>and</strong> a high dem<strong>and</strong>, the price will<br />
be high. <br />
o The greater the <strong>supply</strong> <strong>and</strong> the lower the dem<strong>and</strong>, the<br />
lower the price will be. <br />
o Questions?
THINK ABOUT IT… <br />
When the Nintendo Wii first came out, it was highly sought<br />
after. The dem<strong>and</strong> was high, but the <strong>supply</strong> was low. <br />
1) Was the price high or low, when Nintendo Wii first<br />
came out? A. High B. Low <br />
2) Why? Explain your answer above <br />
3) Six months later infer what happened to Wii’s price. <br />
• Think individually <strong>and</strong> write your answers <br />
• Table Talk --- Share ideas w/table <br />
• Share out --- Share out w/class
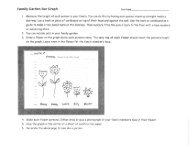
4. SUPPLY AND DEMAND GRAPHS <br />
People draw <strong>supply</strong> <strong>and</strong> dem<strong>and</strong> graphs<br />
to see the relationship between <strong>supply</strong><br />
<strong>and</strong> dem<strong>and</strong>.<br />
This graph is a visual representation of<br />
<strong>supply</strong> <strong>and</strong> dem<strong>and</strong>. <br />
The graph shows changes in a<br />
product’s dem<strong>and</strong> or <strong>supply</strong>. <br />
Graphs <strong>can</strong> predict the performance of<br />
the product over time. <br />
Price goes on the LEFT<br />
Quantity is on the BOTTOM
The Daily Dem<strong>and</strong><br />
Curve for Pizza in Chicago<br />
A Supply Curve shows a<br />
good/service a producer<br />
is willing & able to produce<br />
at different prices. <br />
A Dem<strong>and</strong> Curve shows<br />
an individual’s need/<br />
desire for a good or<br />
service at a given price. <br />
Slide 12
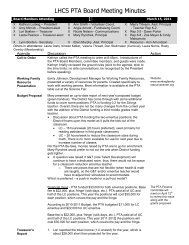
5. WHAT IS EQUILIBRIUM? <br />
o The point that the <strong>supply</strong> <strong>and</strong><br />
dem<strong>and</strong> curve meet or intersect is<br />
known as the equilibrium price.<br />
o Equilibrium is the point of balance<br />
between price <strong>and</strong> quantity when<br />
there are enough buyers for goods<br />
sold. <br />
o Equilibrium occurs when buyers &<br />
sellers are satisfied with their<br />
respective quantities at the market<br />
price
EQUILIBRIUM: SUPPLY & DEMAND MEET <br />
When a price is above the equilibrium price,<br />
fewer people are willing to buy because the<br />
price is too high.<br />
• When a price is below equilibrium price, many<br />
people are willing to buy the product because<br />
the price is too low. Suppliers may not be able<br />
to make enough money to cover costs.<br />
• DISEQUILIBRIUM is when quantity supplied is not<br />
equal to quantity dem<strong>and</strong>ed.
Equilibrium Price (Market Price)
6. PRICES<br />
A price is what we pay when we purchase a<br />
good or service.<br />
Market prices are determined by the buying <strong>and</strong> selling<br />
decisions of consumers <strong>and</strong> producers. <br />
The prices of goods <strong>and</strong> services dictate what products<br />
are developed, made or improved. <br />
When the price is high, dem<strong>and</strong> falls <strong>and</strong> businesses<br />
START producing fewer goods. <br />
When the price is low, dem<strong>and</strong> rises <strong>and</strong> businesses<br />
produce more goods to meet the dem<strong>and</strong>.
7. PROFIT<br />
Profit = the difference between the money people<br />
make when they produce <strong>and</strong> sell a good or<br />
service, <strong>and</strong> all their costs of production. <br />
People/businesses enter the marketplace in hopes<br />
of making a profit (money). <br />
This ‘profit motive’ encourages people to enter the<br />
marketplace. <br />
The hope of making a profit is the reward for<br />
people who take risks by entering the marketplace.
8. COMPETITION <br />
Competition is good for consumers <strong>and</strong> business. It keeps<br />
prices low, <strong>and</strong> the quality <strong>and</strong> choice of products <strong>and</strong><br />
services high. <br />
It promotes innovation to make products different <strong>and</strong><br />
better, in ways that consumers want.<br />
Sellers compete to make a profit. If sellers feel they <strong>can</strong> meet<br />
a need/want, they enter the marketplace. <br />
When sellers make products <strong>and</strong> competition follows when<br />
others enter the marketplace. <br />
When competition is controlled, prices are higher <strong>and</strong> there<br />
are fewer choices E.g. -Canada has a few choices for<br />
consumers for cell phone service.
9. SURPLUS <br />
o A SURPLUS is the amount by which the quantity<br />
supplied is higher than the quantity dem<strong>and</strong>ed. <br />
o A Surplus signals a price is too high. Consumers<br />
will not buy all of the product suppliers are willing<br />
to <strong>supply</strong>.<br />
o In a competitive market, a surplus will not last<br />
because sellers will lower their price to sell their<br />
goods. E.g. Sales <strong>and</strong> clearance items!
9. SURPLUSES AND SHORTAGES
10. SHORTAGES <br />
o A shortage is the amount by which the quantity<br />
dem<strong>and</strong>ed is higher than the quantity supplied <br />
o A shortage signals that the price is too low.<br />
o At that price, suppliers will not <strong>supply</strong> all of<br />
the product that consumers are willing to buy.<br />
o In a competitive market, a shortage will not<br />
last long; sellers will raise their price.
11. SCARCITY *REVISED! <br />
o Scarcity is when something is rare or hard to find like<br />
diamonds, caviar, or oranges in a growing season when a<br />
deep freeze in Florida ruins an entire orange crop.<br />
o When something is scarce, it is available in amounts less<br />
than the total amount wanted to satisfy everyone. <br />
o Oil, gold, diamonds, & iron are tangible scarce items.<br />
Happiness, hope, health & love are intangible scarce<br />
items <br />
o Producers <strong>can</strong> withhold items to make them “appear”<br />
scarce, to create a “fake” shortage to drive up the price.
12. EXCESS DEMAND <strong>and</strong> EXCESS SUPPLY<br />
Excess Dem<strong>and</strong><br />
o When the quantity<br />
dem<strong>and</strong>ed is more than the<br />
quantity supplied.<br />
o At excess dem<strong>and</strong><br />
consumers will have to wait<br />
in long lines or not get the<br />
product they want <br />
o At excess dem<strong>and</strong>, business<br />
should raise the price.<br />
Excess Supply <br />
o When quantity supplied<br />
exceeds the quantity<br />
dem<strong>and</strong>ed caused by over<br />
production.<br />
o Producers hoping for a<br />
profit make more in the<br />
hope of selling more at a<br />
higher price? <br />
o We will buy less or buy an<br />
alternative
13. THINK ABOUT IT? <br />
Psychological research suggests that in the long<br />
run, experiences make people happier than<br />
material possessions. Do you agree with this?<br />
Yes or No? Explain your thinking… <br />
• Think individually <strong>and</strong> write 2-3 sentences <br />
• Table Talk --- Share ideas w/table <br />
• Share out --- Share out w/class