Vodafone Group Plc Annual Report for the year ended 31 March 2012
Vodafone Group Plc Annual Report for the year ended 31 March 2012 Vodafone Group Plc Annual Report for the year ended 31 March 2012
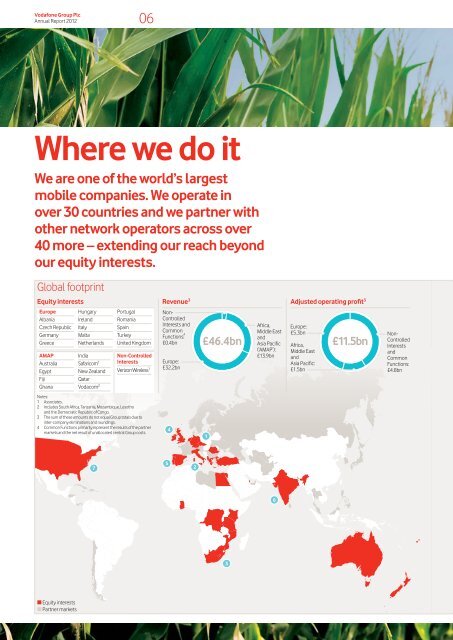
Vodafone Group Plc Annual Report 2012 06 Where we do it We are one of the world’s largest mobile companies. We operate in over 30 countries and we partner with other network operators across over 40 more – extending our reach beyond our equity interests. Global footprint Equity interests Revenue 3 Adjusted operating profit 3 Europe Albania Czech Republic Germany Greece AMAP Australia Egypt Fiji Ghana Hungary Ireland Italy Malta Netherlands India Safaricom 1 New Zealand Qatar Vodacom 2 Portugal Romania Spain Turkey United Kingdom Non-Controlled Interests Verizon Wireless 1 Non- Controlled Interests and Common Functions: 4 £0.4bn Europe: £32.2bn £46.4bn Africa, Middle East and Asia Pacific (‘AMAP’): £13.9bn Europe: £5.3bn Africa, Middle East and Asia Pacific: £1.5bn £11.5bn Non- Controlled Interests and Common Functions: £4.8bn Notes: 1 Associates. 2 Includes South Africa, Tanzania, Mozambique, Lesotho and the Democratic Republic of Congo. 3 The sum of these amounts do not equal Group totals due to inter-company eliminations and roundings. 4 Common Functions primarily represent the results of the partner markets and the net result of unallocated central Group costs. 4 1 7 5 2 6 3 n Equity interests n Partner markets
Vodafone Group Plc Annual Report 2012 07 Business review 1 Germany 36m mobile customers Our largest market by revenue We are the leading mobile operator in Germany, with a revenue market share of 35%. In 2010 we became the first operator in Germany to launch super fast 4G mobile data services with peak data download speeds of up to 50 Mbps. Germany is our largest market for fixed broadband customers with 3.4 million users. 5 Spain 18m mobile customers Challenging market conditions The economic recession is extremely harsh in Spain, with unemployment at 24% leading to significant declines in organic revenue as customers cut back on spending. We remain confident of Spain’s longer term prospects and therefore we recently invested around £500 million in new spectrum which will be used to rollout 4G services. 2 Italy 30m 1 mobile customers We are the largest mobile operator in Italy We acquired operations in Italy in 2000. In 2011 we became the largest mobile operator and now have a 37% revenue market share. While the economic recession led to a fall in revenue during the year, our flexible cost structure, due to low handset subsidies, has ensured that overall profitability remains high. 6 India 150m mobile customers Our largest market by customers We acquired a controlling stake in India in 2007. Since then we have grown the customer base from 28 million to over 150 million and increased our revenue market share from 16% to 21%. Through our investments in 3G technology and low cost handsets we are bringing mobile internet services to this fast growing market. 3 Vodacom 57m mobile customers Growing strongly in Africa We own 65% of Vodacom which covers five countries in Southern Africa – including South Africa which is the largest business, accounting for about 85% of revenue, Tanzania, Lesotho, Mozambique and the Democratic Republic of Congo. In South Africa we are the market leader and continue to deliver strong revenue growth due to the rapid take up of mobile data services. 7 Verizon Wireless 93m 1 mobile customers A leading US operator We own 45% of Verizon Wireless, the largest mobile operator in the United States measured by revenue. During last year Verizon Wireless achieved 7.3% * service revenue growth driven by good customer growth and the strong take-up of mobile data services. Its leading 4G network now covers two-thirds of the US population. 4 UK 19m mobile customers Our first market We made the first UK mobile phone call in 1985 and we were the first UK mobile network operator to launch commercial 3G services in 2001. Our business has expanded rapidly and today we account for 26% of the UK market (measured by revenue) and have a market leading 37% share of the mobile enterprise market. Note: 1 Represents 100%. The Group’s share based on its equity interests are 23 million in Italy and 42 million in Verizon Wireless. Performance Governance Financials Additional information
- Page 1 and 2: Vodafone Group Plc Annual Report fo
- Page 3 and 4: Vodafone Group Plc Annual Report 20
- Page 5 and 6: Vodafone Group Plc Annual Report 20
- Page 7: Vodafone Group Plc Annual Report 20
- Page 11 and 12: Vodafone Group Plc Annual Report 20
- Page 13 and 14: Vodafone Group Plc Annual Report 20
- Page 15 and 16: Vodafone Group Plc Annual Report 20
- Page 17 and 18: Vodafone Group Plc Annual Report 20
- Page 19 and 20: Vodafone Group Plc Annual Report 20
- Page 21 and 22: Vodafone Group Plc Annual Report 20
- Page 23 and 24: Vodafone Group Plc Annual Report 20
- Page 25 and 26: Vodafone Group Plc Annual Report 20
- Page 27 and 28: Vodafone Group Plc Annual Report 20
- Page 29 and 30: Vodafone Group Plc Annual Report 20
- Page 31 and 32: Vodafone Group Plc Annual Report 20
- Page 33 and 34: Vodafone Group Plc Annual Report 20
- Page 35 and 36: Vodafone Group Plc Annual Report 20
- Page 37 and 38: Vodafone Group Plc Annual Report 20
- Page 39 and 40: Vodafone Group Plc Annual Report 20
- Page 41 and 42: Risk overview Vodafone Group Plc An
- Page 43 and 44: Vodafone Group Plc Annual Report 20
- Page 45 and 46: Vodafone Group Plc Annual Report 20
- Page 47 and 48: Vodafone Group Plc Annual Report 20
- Page 49 and 50: Vodafone Group Plc Annual Report 20
- Page 51 and 52: Vodafone Group Plc Annual Report 20
- Page 53 and 54: Principal risk factors and uncertai
- Page 55 and 56: Vodafone Group Plc Annual Report 20
- Page 57 and 58: Vodafone Group Plc Annual Report 20
<strong>Vodafone</strong> <strong>Group</strong> <strong>Plc</strong><br />
<strong>Annual</strong> <strong>Report</strong> <strong>2012</strong><br />
06<br />
Where we do it<br />
We are one of <strong>the</strong> world’s largest<br />
mobile companies. We operate in<br />
over 30 countries and we partner with<br />
o<strong>the</strong>r network operators across over<br />
40 more – extending our reach beyond<br />
our equity interests.<br />
Global footprint<br />
Equity interests<br />
Revenue 3<br />
Adjusted operating profit 3<br />
Europe<br />
Albania<br />
Czech Republic<br />
Germany<br />
Greece<br />
AMAP<br />
Australia<br />
Egypt<br />
Fiji<br />
Ghana<br />
Hungary<br />
Ireland<br />
Italy<br />
Malta<br />
Ne<strong>the</strong>rlands<br />
India<br />
Safaricom 1<br />
New Zealand<br />
Qatar<br />
Vodacom 2<br />
Portugal<br />
Romania<br />
Spain<br />
Turkey<br />
United Kingdom<br />
Non-Controlled<br />
Interests<br />
Verizon Wireless 1<br />
Non-<br />
Controlled<br />
Interests and<br />
Common<br />
Functions: 4<br />
£0.4bn<br />
Europe:<br />
£32.2bn<br />
£46.4bn<br />
Africa,<br />
Middle East<br />
and<br />
Asia Pacific<br />
(‘AMAP’):<br />
£13.9bn<br />
Europe:<br />
£5.3bn<br />
Africa,<br />
Middle East<br />
and<br />
Asia Pacific:<br />
£1.5bn<br />
£11.5bn<br />
Non-<br />
Controlled<br />
Interests<br />
and<br />
Common<br />
Functions:<br />
£4.8bn<br />
Notes:<br />
1 Associates.<br />
2 Includes South Africa, Tanzania, Mozambique, Lesotho<br />
and <strong>the</strong> Democratic Republic of Congo.<br />
3 The sum of <strong>the</strong>se amounts do not equal <strong>Group</strong> totals due to<br />
inter-company eliminations and roundings.<br />
4 Common Functions primarily represent <strong>the</strong> results of <strong>the</strong> partner<br />
markets and <strong>the</strong> net result of unallocated central <strong>Group</strong> costs.<br />
4<br />
1<br />
7<br />
5<br />
2<br />
6<br />
3<br />
n Equity interests<br />
n Partner markets


