Vodafone Group Plc Annual Report for the year ended 31 March 2012
Vodafone Group Plc Annual Report for the year ended 31 March 2012 Vodafone Group Plc Annual Report for the year ended 31 March 2012
Vodafone Group Plc Annual Report 2012 54 Financial position and resources Consolidated statement of financial position 2012 2011 £m £m Non-current assets Intangible assets 59,514 68,558 Property, plant and equipment 18,655 20,181 Investments in associates 35,108 38,105 Other non-current assets 6,274 7,373 119,551 134,217 Current assets 20,025 17,003 Total assets 139,576 151,220 Total equity shareholders’ funds 76,935 87,555 Total non-controlling interests 1,267 6 Total equity 78,202 87,561 Liabilities Borrowings Long-term 28,362 28,375 Short-term 6,258 9,906 Taxation liabilities Deferred tax liabilities 6,597 6,486 Current taxation liabilities 2,148 2,262 Other non-current liabilities 2,140 1,373 Other current liabilities 15,869 15,257 Total liabilities 61,374 63,659 Total equity and liabilities 139,576 151,220 Assets Intangible assets At 31 March 2012 our intangible assets were £59.5 billion (2011: £68.6 billion) with goodwill comprising the largest element at £38.4 billion (2011: £45.2 billion). The decrease primarily resulted from impairment losses of £3.9 billion, amortisation of £3.5 billion and unfavourable foreign exchange rate movements of £4.2 billion partially offset by £2.9 billion of additions. Refer to note 10 to the consolidated financial statements for further information on the impairment charge. Property, plant and equipment Property, plant and equipment decreased to £18.7 billion at 31 March 2012 from £20.2 billion at 31 March 2011 predominantly as a result of £4.4 billion of depreciation charges and unfavourable foreign exchange rate movements of £1.3 billion partially offset by £4.7 billion of additions. Investments in associates Investments in associates decreased to £35.1 billion at 31 March 2012 from £38.1 billion at 31 March 2011 primarily due to a reduction of £4.0 billion in relation to the sale of our 44% interest in SFR and £4.0 billion of dividends received partially offset by our share of the results of associates, after deductions of interest, tax and non-controlling interest, which contributed £5.0 billion, mainly arising from our investment in Verizon Wireless. Other non-current assets Other non-current assets decreased to £6.3 billion at 31 March 2012 (2011: £7.4 billion) mainly due to other investments which totalled £0.8 billion at 31 March 2012 compared to £1.4 billion at 31 March 2011. Current assets Current assets increased to £20.0 billion at 31 March 2012 from £17.0 billion at 31 March 2011 due to an increase in cash and short-term investments resulting from the element of the proceeds from the disposal of our 44% interest in SFR not yet utilised for the share buyback programme, and an increase in other receivables due to the second tranche of the proceeds from the sale of our interest in SoftBank Mobile Corp. Limited which was received in April 2012. Total equity and liabilities Total equity Total equity decreased to £78.2 billion at 31 March 2012 from £87.6 billion at 31 March 2011. The profit for the year of £7.0 billion was more than offset by equity dividends of £6.7 billion, other comprehensive loss of £4.7 billion, share buyback of £4.7 billion and £1.9 billion in relation to the acquisition of non-controlling interests, primarily in India. Total non-controlling interests have increased by £1.3 billion primarily as a result of the exercise of put options over non-controlling interests during the year. Borrowings Long-term borrowings and short-term borrowings decreased to £34.6 billion at 31 March 2012 from £38.3 billion at 31 March 2011 mainly as a result of foreign exchange rate movements, bond repayments during the year and settlement of certain put options held by the Essar Group. Taxation liabilities Current tax liabilities decreased to £2.1 billion at 31 March 2012 from £2.3 billion at 31 March 2011 mainly as a result of the resolution and payment of longstanding tax disputes. Other current liabilities Other current liabilities increased to £15.9 billion at 31 March 2012 from £15.3 billion at 31 March 2011. Trade payables at 31 March 2012 were equivalent to 43 days (2011: 37 days) outstanding, calculated by reference to the amount owed to suppliers as a proportion of the amounts invoiced by suppliers during the year. It is our policy to agree terms of transactions, including payment terms, with suppliers and it is our normal practice that payment is made accordingly. Contractual obligations and contingencies A summary of our principal contractual financial obligations is shown below. Further details on the items included can be found in the notes to the consolidated financial statements. Details of the Group’s contingent liabilities are included in note 29 to the consolidated financial statements. Payments due by period £m Contractual obligations 1 Total 5 years Borrowings 2 42,079 6,266 11,419 10,400 13,994 Operating lease commitments 3 6,141 1,110 1,633 1,152 2,246 Capital commitments 3 4 2,018 1,798 195 25 – Purchase commitments 5,138 3,237 1,081 446 374 Total 55,376 12,411 14,328 12,023 16,614 Notes: 1 The above table of contractual obligations includes commitments in respect of options over interests in Group businesses held by non-controlling shareholders (see “Option agreements and similar arrangements”) and obligations to pay dividends to non-controlling shareholders (see “Dividends from associates and to non-controlling shareholders”). The table excludes current and deferred tax liabilities and obligations under post employment benefit schemes, details of which are provided in notes 6 and 23 to the consolidated financial statements respectively. The table also excludes the contractual obligations of associates. 2 See note 22 to the consolidated financial statements. 3 See note 28 to the consolidated financial statements. 4 Primarily related to network infrastructure. Equity dividends The table below sets out the amounts of interim, final and total cash dividends paid or, in the case of the final dividend for the 2012 financial year, proposed, in respect of each financial year. Pence per ordinary share Year ended 31 March Interim Final Total 2008 2.49 5.02 7.51 2009 2.57 5.20 7.77 2010 2.66 5.65 8.31 2011 2.85 6.05 8.90 2012 7.05 1 6.47 2 13.52 Notes: 1 Includes the 4.0 pence special dividend paid in February 2012. 2 The final dividend for the year ended 31 March 2012 was proposed on 22 May 2012 and is payable on 1 August 2012 to holders on record as of 8 June 2012. For American depositary share (‘ADS’) holders the dividend will be payable in US dollars under the terms of the ADS depositary agreement. Dividend payments on ordinary shares will be paid by direct credit into a nominated bank or building society account or, alternatively, into the Company’s dividend reinvestment plan.
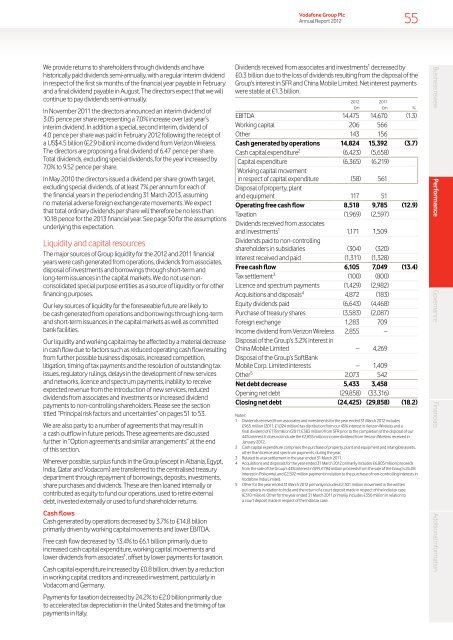
Vodafone Group Plc Annual Report 2012 55 We provide returns to shareholders through dividends and have historically paid dividends semi-annually, with a regular interim dividend in respect of the first six months of the financial year payable in February and a final dividend payable in August. The directors expect that we will continue to pay dividends semi-annually. In November 2011 the directors announced an interim dividend of 3.05 pence per share representing a 7.0% increase over last year’s interim dividend. In addition a special, second interim, dividend of 4.0 pence per share was paid in February 2012 following the receipt of a US$4.5 billion (£2.9 billion) income dividend from Verizon Wireless. The directors are proposing a final dividend of 6.47 pence per share. Total dividends, excluding special dividends, for the year increased by 7.0% to 9.52 pence per share. In May 2010 the directors issued a dividend per share growth target, excluding special dividends, of at least 7% per annum for each of the financial years in the period ending 31 March 2013, assuming no material adverse foreign exchange rate movements. We expect that total ordinary dividends per share will therefore be no less than 10.18 pence for the 2013 financial year. See page 50 for the assumptions underlying this expectation. Liquidity and capital resources The major sources of Group liquidity for the 2012 and 2011 financial years were cash generated from operations, dividends from associates, disposal of investments and borrowings through short-term and long-term issuances in the capital markets. We do not use nonconsolidated special purpose entities as a source of liquidity or for other financing purposes. Our key sources of liquidity for the foreseeable future are likely to be cash generated from operations and borrowings through long-term and short-term issuances in the capital markets as well as committed bank facilities. Our liquidity and working capital may be affected by a material decrease in cash flow due to factors such as reduced operating cash flow resulting from further possible business disposals, increased competition, litigation, timing of tax payments and the resolution of outstanding tax issues, regulatory rulings, delays in the development of new services and networks, licence and spectrum payments, inability to receive expected revenue from the introduction of new services, reduced dividends from associates and investments or increased dividend payments to non-controlling shareholders. Please see the section titled “Principal risk factors and uncertainties” on pages 51 to 53. We are also party to a number of agreements that may result in a cash outflow in future periods. These agreements are discussed further in “Option agreements and similar arrangements” at the end of this section. Wherever possible, surplus funds in the Group (except in Albania, Egypt, India, Qatar and Vodacom) are transferred to the centralised treasury department through repayment of borrowings, deposits, investments, share purchases and dividends. These are then loaned internally or contributed as equity to fund our operations, used to retire external debt, invested externally or used to fund shareholder returns. Cash flows Cash generated by operations decreased by 3.7% to £14.8 billion primarily driven by working capital movements and lower EBITDA. Free cash flow decreased by 13.4% to £6.1 billion primarily due to increased cash capital expenditure, working capital movements and lower dividends from associates 1 , offset by lower payments for taxation. Cash capital expenditure increased by £0.8 billion, driven by a reduction in working capital creditors and increased investment, particularly in Vodacom and Germany. Payments for taxation decreased by 24.2% to £2.0 billion primarily due to accelerated tax depreciation in the United States and the timing of tax payments in Italy. Dividends received from associates and investments 1 decreased by £0.3 billion due to the loss of dividends resulting from the disposal of the Group’s interest in SFR and China Mobile Limited. Net interest payments were stable at £1.3 billion. 2012 2011 £m £m % EBITDA 14,475 14,670 (1.3) Working capital 206 566 Other 143 156 Cash generated by operations 14,824 15,392 (3.7) Cash capital expenditure 2 (6,423) (5,658) Capital expenditure (6,365) (6,219) Working capital movement in respect of capital expenditure (58) 561 Disposal of property, plant and equipment 117 51 Operating free cash flow 8,518 9,785 (12.9) Taxation (1,969) (2,597) Dividends received from associates and investments 1 1,171 1,509 Dividends paid to non-controlling shareholders in subsidiaries (304) (320) Interest received and paid (1,311) (1,328) Free cash flow 6,105 7,049 (13.4) Tax settlement 3 (100) (800) Licence and spectrum payments (1,429) (2,982) Acquisitions and disposals 4 4,872 (183) Equity dividends paid (6,643) (4,468) Purchase of treasury shares (3,583) (2,087) Foreign exchange 1,283 709 Income dividend from Verizon Wireless 2,855 – Disposal of the Group’s 3.2% interest in China Mobile Limited – 4,269 Disposal of the Group’s SoftBank Mobile Corp. Limited interests – 1,409 Other 5 2,073 542 Net debt decrease 5,433 3,458 Opening net debt (29,858) (33,316) Closing net debt (24,425) (29,858) (18.2) Notes: 1 Dividends received from associates and investments for the year ended 31 March 2012 includes £965 million (2011: £1,024 million) tax distribution from our 45% interest in Verizon Wireless and a final dividend of £178 million (2011: £383 million) from SFR prior to the completion of the disposal of our 44% interest. It does not include the £2,855 million income dividend from Verizon Wireless received in January 2012. 2 Cash capital expenditure comprises the purchase of property, plant and equipment and intangible assets, other than licence and spectrum payments, during the year. 3 Related to a tax settlement in the year ended 31 March 2011. 4 Acquisitions and disposals for the year ended 31 March 2012 primarily includes £6,805 million proceeds from the sale of the Group’s 44% interest in SFR, £784 million proceeds from the sale of the Group’s 24.4% interest in Polkomtel and £2,592 million payment in relation to the purchase of non-controlling interests in Vodafone India Limited. 5 Other for the year ended 31 March 2012 primarily includes £2,301 million movement in the written put options in relation to India and the return of a court deposit made in respect of the India tax case (£310 million). Other for the year ended 31 March 2011 primarily includes £356 million in relation to a court deposit made in respect of the India tax case. Business review Performance Governance Financials Additional information
- Page 5 and 6: Vodafone Group Plc Annual Report 20
- Page 7 and 8: Vodafone Group Plc Annual Report 20
- Page 9 and 10: Vodafone Group Plc Annual Report 20
- Page 11 and 12: Vodafone Group Plc Annual Report 20
- Page 13 and 14: Vodafone Group Plc Annual Report 20
- Page 15 and 16: Vodafone Group Plc Annual Report 20
- Page 17 and 18: Vodafone Group Plc Annual Report 20
- Page 19 and 20: Vodafone Group Plc Annual Report 20
- Page 21 and 22: Vodafone Group Plc Annual Report 20
- Page 23 and 24: Vodafone Group Plc Annual Report 20
- Page 25 and 26: Vodafone Group Plc Annual Report 20
- Page 27 and 28: Vodafone Group Plc Annual Report 20
- Page 29 and 30: Vodafone Group Plc Annual Report 20
- Page 31 and 32: Vodafone Group Plc Annual Report 20
- Page 33 and 34: Vodafone Group Plc Annual Report 20
- Page 35 and 36: Vodafone Group Plc Annual Report 20
- Page 37 and 38: Vodafone Group Plc Annual Report 20
- Page 39 and 40: Vodafone Group Plc Annual Report 20
- Page 41 and 42: Risk overview Vodafone Group Plc An
- Page 43 and 44: Vodafone Group Plc Annual Report 20
- Page 45 and 46: Vodafone Group Plc Annual Report 20
- Page 47 and 48: Vodafone Group Plc Annual Report 20
- Page 49 and 50: Vodafone Group Plc Annual Report 20
- Page 51 and 52: Vodafone Group Plc Annual Report 20
- Page 53 and 54: Principal risk factors and uncertai
- Page 55: Vodafone Group Plc Annual Report 20
- Page 59 and 60: Vodafone Group Plc Annual Report 20
- Page 61 and 62: Vodafone Group Plc Annual Report 20
- Page 63 and 64: Vodafone Group Plc Annual Report 20
- Page 65 and 66: Corporate governance Vodafone Group
- Page 67 and 68: Vodafone Group Plc Annual Report 20
- Page 69 and 70: Vodafone Group Plc Annual Report 20
- Page 71 and 72: Vodafone Group Plc Annual Report 20
- Page 73 and 74: Vodafone Group Plc Annual Report 20
- Page 75 and 76: Vodafone Group Plc Annual Report 20
- Page 77 and 78: Vodafone Group Plc Annual Report 20
- Page 79 and 80: Vodafone Group Plc Annual Report 20
- Page 81 and 82: Vodafone Group Plc Annual Report 20
- Page 83 and 84: Vodafone Group Plc Annual Report 20
- Page 85 and 86: Vodafone Group Plc Annual Report 20
- Page 87 and 88: Vodafone Group Plc Annual Report 20
- Page 89 and 90: Vodafone Group Plc Annual Report 20
- Page 91 and 92: Directors’ statement of responsib
- Page 93 and 94: Critical accounting estimates Vodaf
- Page 95 and 96: Vodafone Group Plc Annual Report 20
- Page 97 and 98: Consolidated statement of financial
- Page 99 and 100: Consolidated statement of cash flow
- Page 101 and 102: Vodafone Group Plc Annual Report 20
- Page 103 and 104: Vodafone Group Plc Annual Report 20
- Page 105 and 106: Vodafone Group Plc Annual Report 20
<strong>Vodafone</strong> <strong>Group</strong> <strong>Plc</strong><br />
<strong>Annual</strong> <strong>Report</strong> <strong>2012</strong><br />
55<br />
We provide returns to shareholders through dividends and have<br />
historically paid dividends semi-annually, with a regular interim dividend<br />
in respect of <strong>the</strong> first six months of <strong>the</strong> financial <strong>year</strong> payable in February<br />
and a final dividend payable in August. The directors expect that we will<br />
continue to pay dividends semi-annually.<br />
In November 2011 <strong>the</strong> directors announced an interim dividend of<br />
3.05 pence per share representing a 7.0% increase over last <strong>year</strong>’s<br />
interim dividend. In addition a special, second interim, dividend of<br />
4.0 pence per share was paid in February <strong>2012</strong> following <strong>the</strong> receipt of<br />
a US$4.5 billion (£2.9 billion) income dividend from Verizon Wireless.<br />
The directors are proposing a final dividend of 6.47 pence per share.<br />
Total dividends, excluding special dividends, <strong>for</strong> <strong>the</strong> <strong>year</strong> increased by<br />
7.0% to 9.52 pence per share.<br />
In May 2010 <strong>the</strong> directors issued a dividend per share growth target,<br />
excluding special dividends, of at least 7% per annum <strong>for</strong> each of<br />
<strong>the</strong> financial <strong>year</strong>s in <strong>the</strong> period ending <strong>31</strong> <strong>March</strong> 2013, assuming<br />
no material adverse <strong>for</strong>eign exchange rate movements. We expect<br />
that total ordinary dividends per share will <strong>the</strong>re<strong>for</strong>e be no less than<br />
10.18 pence <strong>for</strong> <strong>the</strong> 2013 financial <strong>year</strong>. See page 50 <strong>for</strong> <strong>the</strong> assumptions<br />
underlying this expectation.<br />
Liquidity and capital resources<br />
The major sources of <strong>Group</strong> liquidity <strong>for</strong> <strong>the</strong> <strong>2012</strong> and 2011 financial<br />
<strong>year</strong>s were cash generated from operations, dividends from associates,<br />
disposal of investments and borrowings through short-term and<br />
long-term issuances in <strong>the</strong> capital markets. We do not use nonconsolidated<br />
special purpose entities as a source of liquidity or <strong>for</strong> o<strong>the</strong>r<br />
financing purposes.<br />
Our key sources of liquidity <strong>for</strong> <strong>the</strong> <strong>for</strong>eseeable future are likely to<br />
be cash generated from operations and borrowings through long-term<br />
and short-term issuances in <strong>the</strong> capital markets as well as committed<br />
bank facilities.<br />
Our liquidity and working capital may be affected by a material decrease<br />
in cash flow due to factors such as reduced operating cash flow resulting<br />
from fur<strong>the</strong>r possible business disposals, increased competition,<br />
litigation, timing of tax payments and <strong>the</strong> resolution of outstanding tax<br />
issues, regulatory rulings, delays in <strong>the</strong> development of new services<br />
and networks, licence and spectrum payments, inability to receive<br />
expected revenue from <strong>the</strong> introduction of new services, reduced<br />
dividends from associates and investments or increased dividend<br />
payments to non-controlling shareholders. Please see <strong>the</strong> section<br />
titled “Principal risk factors and uncertainties” on pages 51 to 53.<br />
We are also party to a number of agreements that may result in<br />
a cash outflow in future periods. These agreements are discussed<br />
fur<strong>the</strong>r in “Option agreements and similar arrangements” at <strong>the</strong> end<br />
of this section.<br />
Wherever possible, surplus funds in <strong>the</strong> <strong>Group</strong> (except in Albania, Egypt,<br />
India, Qatar and Vodacom) are transferred to <strong>the</strong> centralised treasury<br />
department through repayment of borrowings, deposits, investments,<br />
share purchases and dividends. These are <strong>the</strong>n loaned internally or<br />
contributed as equity to fund our operations, used to retire external<br />
debt, invested externally or used to fund shareholder returns.<br />
Cash flows<br />
Cash generated by operations decreased by 3.7% to £14.8 billion<br />
primarily driven by working capital movements and lower EBITDA.<br />
Free cash flow decreased by 13.4% to £6.1 billion primarily due to<br />
increased cash capital expenditure, working capital movements and<br />
lower dividends from associates 1 , offset by lower payments <strong>for</strong> taxation.<br />
Cash capital expenditure increased by £0.8 billion, driven by a reduction<br />
in working capital creditors and increased investment, particularly in<br />
Vodacom and Germany.<br />
Payments <strong>for</strong> taxation decreased by 24.2% to £2.0 billion primarily due<br />
to accelerated tax depreciation in <strong>the</strong> United States and <strong>the</strong> timing of tax<br />
payments in Italy.<br />
Dividends received from associates and investments 1 decreased by<br />
£0.3 billion due to <strong>the</strong> loss of dividends resulting from <strong>the</strong> disposal of <strong>the</strong><br />
<strong>Group</strong>’s interest in SFR and China Mobile Limited. Net interest payments<br />
were stable at £1.3 billion.<br />
<strong>2012</strong> 2011<br />
£m £m %<br />
EBITDA 14,475 14,670 (1.3)<br />
Working capital 206 566<br />
O<strong>the</strong>r 143 156<br />
Cash generated by operations 14,824 15,392 (3.7)<br />
Cash capital expenditure 2 (6,423) (5,658)<br />
Capital expenditure (6,365) (6,219)<br />
Working capital movement<br />
in respect of capital expenditure (58) 561<br />
Disposal of property, plant<br />
and equipment 117 51<br />
Operating free cash flow 8,518 9,785 (12.9)<br />
Taxation (1,969) (2,597)<br />
Dividends received from associates<br />
and investments 1 1,171 1,509<br />
Dividends paid to non-controlling<br />
shareholders in subsidiaries (304) (320)<br />
Interest received and paid (1,<strong>31</strong>1) (1,328)<br />
Free cash flow 6,105 7,049 (13.4)<br />
Tax settlement 3 (100) (800)<br />
Licence and spectrum payments (1,429) (2,982)<br />
Acquisitions and disposals 4 4,872 (183)<br />
Equity dividends paid (6,643) (4,468)<br />
Purchase of treasury shares (3,583) (2,087)<br />
Foreign exchange 1,283 709<br />
Income dividend from Verizon Wireless 2,855 –<br />
Disposal of <strong>the</strong> <strong>Group</strong>’s 3.2% interest in<br />
China Mobile Limited – 4,269<br />
Disposal of <strong>the</strong> <strong>Group</strong>’s SoftBank<br />
Mobile Corp. Limited interests – 1,409<br />
O<strong>the</strong>r 5 2,073 542<br />
Net debt decrease 5,433 3,458<br />
Opening net debt (29,858) (33,<strong>31</strong>6)<br />
Closing net debt (24,425) (29,858) (18.2)<br />
Notes:<br />
1 Dividends received from associates and investments <strong>for</strong> <strong>the</strong> <strong>year</strong> <strong>ended</strong> <strong>31</strong> <strong>March</strong> <strong>2012</strong> includes<br />
£965 million (2011: £1,024 million) tax distribution from our 45% interest in Verizon Wireless and a<br />
final dividend of £178 million (2011: £383 million) from SFR prior to <strong>the</strong> completion of <strong>the</strong> disposal of our<br />
44% interest. It does not include <strong>the</strong> £2,855 million income dividend from Verizon Wireless received in<br />
January <strong>2012</strong>.<br />
2 Cash capital expenditure comprises <strong>the</strong> purchase of property, plant and equipment and intangible assets,<br />
o<strong>the</strong>r than licence and spectrum payments, during <strong>the</strong> <strong>year</strong>.<br />
3 Related to a tax settlement in <strong>the</strong> <strong>year</strong> <strong>ended</strong> <strong>31</strong> <strong>March</strong> 2011.<br />
4 Acquisitions and disposals <strong>for</strong> <strong>the</strong> <strong>year</strong> <strong>ended</strong> <strong>31</strong> <strong>March</strong> <strong>2012</strong> primarily includes £6,805 million proceeds<br />
from <strong>the</strong> sale of <strong>the</strong> <strong>Group</strong>’s 44% interest in SFR, £784 million proceeds from <strong>the</strong> sale of <strong>the</strong> <strong>Group</strong>’s 24.4%<br />
interest in Polkomtel and £2,592 million payment in relation to <strong>the</strong> purchase of non-controlling interests in<br />
<strong>Vodafone</strong> India Limited.<br />
5 O<strong>the</strong>r <strong>for</strong> <strong>the</strong> <strong>year</strong> <strong>ended</strong> <strong>31</strong> <strong>March</strong> <strong>2012</strong> primarily includes £2,301 million movement in <strong>the</strong> written<br />
put options in relation to India and <strong>the</strong> return of a court deposit made in respect of <strong>the</strong> India tax case<br />
(£<strong>31</strong>0 million). O<strong>the</strong>r <strong>for</strong> <strong>the</strong> <strong>year</strong> <strong>ended</strong> <strong>31</strong> <strong>March</strong> 2011 primarily includes £356 million in relation to<br />
a court deposit made in respect of <strong>the</strong> India tax case.<br />
Business review Per<strong>for</strong>mance Governance Financials Additional in<strong>for</strong>mation


