Vodafone Group Plc Annual Report for the year ended 31 March 2012
Vodafone Group Plc Annual Report for the year ended 31 March 2012 Vodafone Group Plc Annual Report for the year ended 31 March 2012
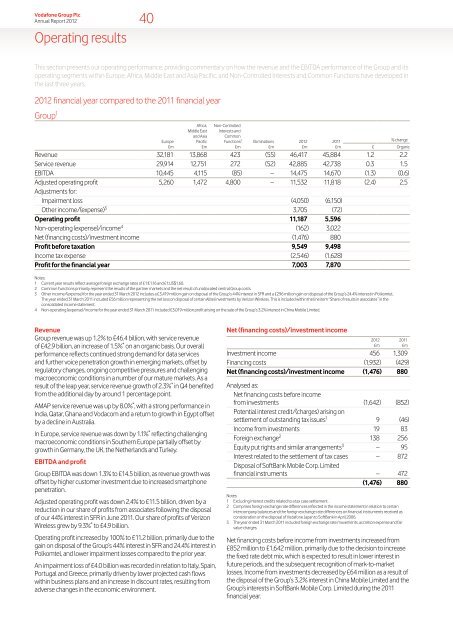
Vodafone Group Plc Annual Report 2012 Operating results 40 This section presents our operating performance, providing commentary on how the revenue and the EBITDA performance of the Group and its operating segments within Europe, Africa, Middle East and Asia Pacific, and Non-Controlled Interests and Common Functions have developed in the last three years. 2012 financial year compared to the 2011 financial year Group 1 Europe £m Africa, Middle East and Asia Pacific £m Non-Controlled Interests and Common Functions 2 £m Eliminations £m 2012 £m 2011 £m % change £ Organic Revenue 32,181 13,868 423 (55) 46,417 45,884 1.2 2.2 Service revenue 29,914 12,751 272 (52) 42,885 42,738 0.3 1.5 EBITDA 10,445 4,115 (85) – 14,475 14,670 (1.3) (0.6) Adjusted operating profit 5,260 1,472 4,800 – 11,532 11,818 (2.4) 2.5 Adjustments for: Impairment loss (4,050) (6,150) Other income/(expense) 3 3,705 (72) Operating profit 11,187 5,596 Non-operating (expense)/income 4 (162) 3,022 Net (financing costs)/investment income (1,476) 880 Profit before taxation 9,549 9,498 Income tax expense (2,546) (1,628) Profit for the financial year 7,003 7,870 Notes: 1 Current year results reflect average foreign exchange rates of £1:€1.16 and £1:US$1.60. 2 Common Functions primarily represent the results of the partner markets and the net result of unallocated central Group costs. 3 Other income/(expense) for the year ended 31 March 2012 includes a £3,419 million gain on disposal of the Group’s 44% interest in SFR and a £296 million gain on disposal of the Group’s 24.4% interest in Polkomtel. The year ended 31 March 2011 included £56 million representing the net loss on disposal of certain Alltel investments by Verizon Wireless. This is included within the line item “Share of results in associates” in the consolidated income statement. 4 Non-operating (expense)/income for the year ended 31 March 2011 included £3,019 million profit arising on the sale of the Group’s 3.2% interest in China Mobile Limited. Revenue Group revenue was up 1.2% to £46.4 billion, with service revenue of £42.9 billion, an increase of 1.5% * on an organic basis. Our overall performance reflects continued strong demand for data services and further voice penetration growth in emerging markets, offset by regulatory changes, ongoing competitive pressures and challenging macroeconomic conditions in a number of our mature markets. As a result of the leap year, service revenue growth of 2.3% * in Q4 benefited from the additional day by around 1 percentage point. AMAP service revenue was up by 8.0% * , with a strong performance in India, Qatar, Ghana and Vodacom and a return to growth in Egypt offset by a decline in Australia. In Europe, service revenue was down by 1.1% * reflecting challenging macroeconomic conditions in Southern Europe partially offset by growth in Germany, the UK, the Netherlands and Turkey. EBITDA and profit Group EBITDA was down 1.3% to £14.5 billion, as revenue growth was offset by higher customer investment due to increased smartphone penetration. Adjusted operating profit was down 2.4% to £11.5 billion, driven by a reduction in our share of profits from associates following the disposal of our 44% interest in SFR in June 2011. Our share of profits of Verizon Wireless grew by 9.3% * to £4.9 billion. Operating profit increased by 100% to £11.2 billion, primarily due to the gain on disposal of the Group’s 44% interest in SFR and 24.4% interest in Polkomtel, and lower impairment losses compared to the prior year. An impairment loss of £4.0 billion was recorded in relation to Italy, Spain, Portugal and Greece, primarily driven by lower projected cash flows within business plans and an increase in discount rates, resulting from adverse changes in the economic environment. Net (financing costs)/investment income 2012 £m 2011 £m Investment income 456 1,309 Financing costs (1,932) (429) Net (financing costs)/investment income (1,476) 880 Analysed as: Net financing costs before income from investments (1,642) (852) Potential interest credit/(charges) arising on settlement of outstanding tax issues 1 9 (46) Income from investments 19 83 Foreign exchange 2 138 256 Equity put rights and similar arrangements 3 – 95 Interest related to the settlement of tax cases – 872 Disposal of SoftBank Mobile Corp. Limited financial instruments – 472 (1,476) 880 Notes: 1 Excluding interest credits related to a tax case settlement. 2 Comprises foreign exchange rate differences reflected in the income statement in relation to certain intercompany balances and the foreign exchange rate differences on financial instruments received as consideration on the disposal of Vodafone Japan to SoftBank in April 2006. 3 The year ended 31 March 2011 included foreign exchange rate movements, accretion expense and fair value charges. Net financing costs before income from investments increased from £852 million to £1,642 million, primarily due to the decision to increase the fixed rate debt mix, which is expected to result in lower interest in future periods, and the subsequent recognition of mark-to-market losses. Income from investments decreased by £64 million as a result of the disposal of the Group’s 3.2% interest in China Mobile Limited and the Group’s interests in SoftBank Mobile Corp. Limited during the 2011 financial year.
Vodafone Group Plc Annual Report 2012 41 Taxation 2012 £m 2011 £m Income tax expense 2,546 1,628 Tax on adjustments to derive adjusted profit before tax (242) (232) Tax benefit related to settlement of tax cases – 929 Adjusted income tax expense 2,304 2,325 Share of associates’ tax 302 519 Adjusted income tax expense for purposes of calculating adjusted tax rate 2,606 2,844 Profit before tax 9,549 9,498 Adjustments to derive adjusted profit before tax 1 369 1,505 Adjusted profit before tax 9,918 11,003 Add: Share of associates’ tax and non-controlling interest 382 604 Adjusted profit before tax for the purpose of calculating adjusted effective tax rate 10,300 11,607 Adjusted effective tax rate 25.3% 24.5% Note: 1 See “Earnings per share”. The adjusted effective tax rate for the year ended 31 March 2012 was 25.3%. This is in line with our mid 20s adjusted effective tax rate guidance range. The Group’s share of associates’ tax declined due to the absence of the tax related to SFR following the disposal of our 44% interest in June 2011. Income tax expense has increased in the year ended 31 March 2012 largely due to the favourable impact of a tax settlement in the 2011 financial year. Europe Germany £m Italy £m Spain £m Earnings per share Adjusted earnings per share was 14.91 pence, a decline of 11.0% year-on-year, reflecting the loss of our 44% interest in SFR and Polkomtel’s profits, the loss of interest income from investment disposals and mark-to-market items charged through finance costs, partially offset by a reduction in shares arising from the Group’s share buyback programme. Basic earnings per share was 13.74 pence (2011: 15.20 pence), reflecting the profit on disposal of our 44% interest in SFR and 24.4% interest in Polkomtel and lower impairment charges compared to the prior financial year, all of which are excluded from adjusted earnings per share. 2012 £m Profit attributable to equity shareholders 6,957 7,968 2011 £m Pre-tax adjustments: Impairment loss 1 4,050 6,150 Other income and expense 1 2 (3,705) 72 Non-operating income and expense 1 3 162 (3,022) Investment income and financing costs 4 (138) (1,695) 369 1,505 Taxation 1 242 (697) Non-controlling interests (18) – Adjusted profit attributable to equity shareholders 7,550 8,776 Million Million Weighted average number of shares outstanding Basic 50,644 52,408 Diluted 50,958 52,748 Notes: 1 Taxation for the 2012 financial year includes a £206 million charge in respect of the disposal of the Group’s 24.4% interest in Polkomtel. The 2011 financial year included £929 million credit in respect of a tax settlement and a £208 million charge in respect of the disposal of the Group’s 3.2% interest in China Mobile Limited. The impairment charges of £4,050 million and £6,150 million in the 2012 and 2011 financial years respectively do not result in any tax consequences. The disposal of our 44% interest in SFR did not give rise to a tax charge. 2 Other income and expense for the 2012 financial year includes a £3,419 million gain on disposal of the Group’s 44% interest in SFR and a £296 million gain on disposal of the Group’s 24.4% interest in Polkomtel. The 2011 financial year includes £56 million representing the net loss on disposal of certain Alltel investments by Verizon Wireless. This is included within the line item “Share of results in associates” in the consolidated income statement. 3 Non-operating income and expense for the 2011 financial year includes £3,019 million profit arising on the sale of the Group’s 3.2% interest in China Mobile Limited. 4 See notes 2 and 3 in “Net (financing costs)/investment income” on page 40. UK £m Other £m Eliminations £m Europe £m % change £m Organic Year ended 31 March 2012 Revenue 8,233 5,658 4,763 5,397 8,352 (222) 32,181 0.5 (0.1) Service revenue 7,669 5,329 4,357 4,996 7,780 (217) 29,914 (0.6) (1.1) EBITDA 2,965 2,514 1,193 1,294 2,479 – 10,445 (3.5) (4.5) Adjusted operating profit 1,491 1,735 566 402 1,066 – 5,260 (8.1) (9.6) EBITDA margin 36.0% 44.4% 25.0% 24.0% 29.7% 32.5% Year ended 31 March 2011 Revenue 7,900 5,722 5,133 5,271 8,253 (264) 32,015 (2.5) 0.6 Service revenue 7,471 5,432 4,735 4,931 7,787 (259) 30,097 (3.4) (0.4) EBITDA 2,952 2,643 1,562 1,233 2,433 – 10,823 (7.1) (3.7) Adjusted operating profit 1,548 1,903 915 348 1,012 – 5,726 (9.8) (6.1) EBITDA margin 37.4% 46.2% 30.4% 23.4% 29.5% – 33.8% Business review Performance Governance Financials Additional information
- Page 1 and 2: Vodafone Group Plc Annual Report fo
- Page 3 and 4: Vodafone Group Plc Annual Report 20
- Page 5 and 6: Vodafone Group Plc Annual Report 20
- Page 7 and 8: Vodafone Group Plc Annual Report 20
- Page 9 and 10: Vodafone Group Plc Annual Report 20
- Page 11 and 12: Vodafone Group Plc Annual Report 20
- Page 13 and 14: Vodafone Group Plc Annual Report 20
- Page 15 and 16: Vodafone Group Plc Annual Report 20
- Page 17 and 18: Vodafone Group Plc Annual Report 20
- Page 19 and 20: Vodafone Group Plc Annual Report 20
- Page 21 and 22: Vodafone Group Plc Annual Report 20
- Page 23 and 24: Vodafone Group Plc Annual Report 20
- Page 25 and 26: Vodafone Group Plc Annual Report 20
- Page 27 and 28: Vodafone Group Plc Annual Report 20
- Page 29 and 30: Vodafone Group Plc Annual Report 20
- Page 31 and 32: Vodafone Group Plc Annual Report 20
- Page 33 and 34: Vodafone Group Plc Annual Report 20
- Page 35 and 36: Vodafone Group Plc Annual Report 20
- Page 37 and 38: Vodafone Group Plc Annual Report 20
- Page 39 and 40: Vodafone Group Plc Annual Report 20
- Page 41: Risk overview Vodafone Group Plc An
- Page 45 and 46: Vodafone Group Plc Annual Report 20
- Page 47 and 48: Vodafone Group Plc Annual Report 20
- Page 49 and 50: Vodafone Group Plc Annual Report 20
- Page 51 and 52: Vodafone Group Plc Annual Report 20
- Page 53 and 54: Principal risk factors and uncertai
- Page 55 and 56: Vodafone Group Plc Annual Report 20
- Page 57 and 58: Vodafone Group Plc Annual Report 20
- Page 59 and 60: Vodafone Group Plc Annual Report 20
- Page 61 and 62: Vodafone Group Plc Annual Report 20
- Page 63 and 64: Vodafone Group Plc Annual Report 20
- Page 65 and 66: Corporate governance Vodafone Group
- Page 67 and 68: Vodafone Group Plc Annual Report 20
- Page 69 and 70: Vodafone Group Plc Annual Report 20
- Page 71 and 72: Vodafone Group Plc Annual Report 20
- Page 73 and 74: Vodafone Group Plc Annual Report 20
- Page 75 and 76: Vodafone Group Plc Annual Report 20
- Page 77 and 78: Vodafone Group Plc Annual Report 20
- Page 79 and 80: Vodafone Group Plc Annual Report 20
- Page 81 and 82: Vodafone Group Plc Annual Report 20
- Page 83 and 84: Vodafone Group Plc Annual Report 20
- Page 85 and 86: Vodafone Group Plc Annual Report 20
- Page 87 and 88: Vodafone Group Plc Annual Report 20
- Page 89 and 90: Vodafone Group Plc Annual Report 20
- Page 91 and 92: Directors’ statement of responsib
<strong>Vodafone</strong> <strong>Group</strong> <strong>Plc</strong><br />
<strong>Annual</strong> <strong>Report</strong> <strong>2012</strong><br />
Operating results<br />
40<br />
This section presents our operating per<strong>for</strong>mance, providing commentary on how <strong>the</strong> revenue and <strong>the</strong> EBITDA per<strong>for</strong>mance of <strong>the</strong> <strong>Group</strong> and its<br />
operating segments within Europe, Africa, Middle East and Asia Pacific, and Non-Controlled Interests and Common Functions have developed in<br />
<strong>the</strong> last three <strong>year</strong>s.<br />
<strong>2012</strong> financial <strong>year</strong> compared to <strong>the</strong> 2011 financial <strong>year</strong><br />
<strong>Group</strong> 1<br />
Europe<br />
£m<br />
Africa,<br />
Middle East<br />
and Asia<br />
Pacific<br />
£m<br />
Non-Controlled<br />
Interests and<br />
Common<br />
Functions 2<br />
£m<br />
Eliminations<br />
£m<br />
<strong>2012</strong><br />
£m<br />
2011<br />
£m<br />
% change<br />
£ Organic<br />
Revenue 32,181 13,868 423 (55) 46,417 45,884 1.2 2.2<br />
Service revenue 29,914 12,751 272 (52) 42,885 42,738 0.3 1.5<br />
EBITDA 10,445 4,115 (85) – 14,475 14,670 (1.3) (0.6)<br />
Adjusted operating profit 5,260 1,472 4,800 – 11,532 11,818 (2.4) 2.5<br />
Adjustments <strong>for</strong>:<br />
Impairment loss (4,050) (6,150)<br />
O<strong>the</strong>r income/(expense) 3 3,705 (72)<br />
Operating profit 11,187 5,596<br />
Non-operating (expense)/income 4 (162) 3,022<br />
Net (financing costs)/investment income (1,476) 880<br />
Profit be<strong>for</strong>e taxation 9,549 9,498<br />
Income tax expense (2,546) (1,628)<br />
Profit <strong>for</strong> <strong>the</strong> financial <strong>year</strong> 7,003 7,870<br />
Notes:<br />
1 Current <strong>year</strong> results reflect average <strong>for</strong>eign exchange rates of £1:€1.16 and £1:US$1.60.<br />
2 Common Functions primarily represent <strong>the</strong> results of <strong>the</strong> partner markets and <strong>the</strong> net result of unallocated central <strong>Group</strong> costs.<br />
3 O<strong>the</strong>r income/(expense) <strong>for</strong> <strong>the</strong> <strong>year</strong> <strong>ended</strong> <strong>31</strong> <strong>March</strong> <strong>2012</strong> includes a £3,419 million gain on disposal of <strong>the</strong> <strong>Group</strong>’s 44% interest in SFR and a £296 million gain on disposal of <strong>the</strong> <strong>Group</strong>’s 24.4% interest in Polkomtel.<br />
The <strong>year</strong> <strong>ended</strong> <strong>31</strong> <strong>March</strong> 2011 included £56 million representing <strong>the</strong> net loss on disposal of certain Alltel investments by Verizon Wireless. This is included within <strong>the</strong> line item “Share of results in associates” in <strong>the</strong><br />
consolidated income statement.<br />
4 Non-operating (expense)/income <strong>for</strong> <strong>the</strong> <strong>year</strong> <strong>ended</strong> <strong>31</strong> <strong>March</strong> 2011 included £3,019 million profit arising on <strong>the</strong> sale of <strong>the</strong> <strong>Group</strong>’s 3.2% interest in China Mobile Limited.<br />
Revenue<br />
<strong>Group</strong> revenue was up 1.2% to £46.4 billion, with service revenue<br />
of £42.9 billion, an increase of 1.5% * on an organic basis. Our overall<br />
per<strong>for</strong>mance reflects continued strong demand <strong>for</strong> data services<br />
and fur<strong>the</strong>r voice penetration growth in emerging markets, offset by<br />
regulatory changes, ongoing competitive pressures and challenging<br />
macroeconomic conditions in a number of our mature markets. As a<br />
result of <strong>the</strong> leap <strong>year</strong>, service revenue growth of 2.3% * in Q4 benefited<br />
from <strong>the</strong> additional day by around 1 percentage point.<br />
AMAP service revenue was up by 8.0% * , with a strong per<strong>for</strong>mance in<br />
India, Qatar, Ghana and Vodacom and a return to growth in Egypt offset<br />
by a decline in Australia.<br />
In Europe, service revenue was down by 1.1% * reflecting challenging<br />
macroeconomic conditions in Sou<strong>the</strong>rn Europe partially offset by<br />
growth in Germany, <strong>the</strong> UK, <strong>the</strong> Ne<strong>the</strong>rlands and Turkey.<br />
EBITDA and profit<br />
<strong>Group</strong> EBITDA was down 1.3% to £14.5 billion, as revenue growth was<br />
offset by higher customer investment due to increased smartphone<br />
penetration.<br />
Adjusted operating profit was down 2.4% to £11.5 billion, driven by a<br />
reduction in our share of profits from associates following <strong>the</strong> disposal<br />
of our 44% interest in SFR in June 2011. Our share of profits of Verizon<br />
Wireless grew by 9.3% * to £4.9 billion.<br />
Operating profit increased by 100% to £11.2 billion, primarily due to <strong>the</strong><br />
gain on disposal of <strong>the</strong> <strong>Group</strong>’s 44% interest in SFR and 24.4% interest in<br />
Polkomtel, and lower impairment losses compared to <strong>the</strong> prior <strong>year</strong>.<br />
An impairment loss of £4.0 billion was recorded in relation to Italy, Spain,<br />
Portugal and Greece, primarily driven by lower projected cash flows<br />
within business plans and an increase in discount rates, resulting from<br />
adverse changes in <strong>the</strong> economic environment.<br />
Net (financing costs)/investment income<br />
<strong>2012</strong><br />
£m<br />
2011<br />
£m<br />
Investment income 456 1,309<br />
Financing costs (1,932) (429)<br />
Net (financing costs)/investment income (1,476) 880<br />
Analysed as:<br />
Net financing costs be<strong>for</strong>e income<br />
from investments (1,642) (852)<br />
Potential interest credit/(charges) arising on<br />
settlement of outstanding tax issues 1 9 (46)<br />
Income from investments 19 83<br />
Foreign exchange 2 138 256<br />
Equity put rights and similar arrangements 3 – 95<br />
Interest related to <strong>the</strong> settlement of tax cases – 872<br />
Disposal of SoftBank Mobile Corp. Limited<br />
financial instruments – 472<br />
(1,476) 880<br />
Notes:<br />
1 Excluding interest credits related to a tax case settlement.<br />
2 Comprises <strong>for</strong>eign exchange rate differences reflected in <strong>the</strong> income statement in relation to certain<br />
intercompany balances and <strong>the</strong> <strong>for</strong>eign exchange rate differences on financial instruments received as<br />
consideration on <strong>the</strong> disposal of <strong>Vodafone</strong> Japan to SoftBank in April 2006.<br />
3 The <strong>year</strong> <strong>ended</strong> <strong>31</strong> <strong>March</strong> 2011 included <strong>for</strong>eign exchange rate movements, accretion expense and fair<br />
value charges.<br />
Net financing costs be<strong>for</strong>e income from investments increased from<br />
£852 million to £1,642 million, primarily due to <strong>the</strong> decision to increase<br />
<strong>the</strong> fixed rate debt mix, which is expected to result in lower interest in<br />
future periods, and <strong>the</strong> subsequent recognition of mark-to-market<br />
losses. Income from investments decreased by £64 million as a result of<br />
<strong>the</strong> disposal of <strong>the</strong> <strong>Group</strong>’s 3.2% interest in China Mobile Limited and <strong>the</strong><br />
<strong>Group</strong>’s interests in SoftBank Mobile Corp. Limited during <strong>the</strong> 2011<br />
financial <strong>year</strong>.


