sustainable development 20 years on from the ... - José Eli da Veiga
sustainable development 20 years on from the ... - José Eli da Veiga sustainable development 20 years on from the ... - José Eli da Veiga
73 Table I.7 LATIN AMERICA AND THE CARIBBEAN: STATUS OF ENERGY EFFICIENCY PROGRAMMES Programme Executing agencies / donors Argentina Energy Efficiency Programme Energy Secretariat / National budget and other agencies such as the Global Environment Fund and the World Bank / Brazil Chile Colombia Costa Rica (1) National Electricity Conservation Programme (PROCEL);( 2) Oil and Oil Products Conservation Programme (CONPET) (1) Energy Efficiency Division (2) Chilean Energy Efficiency Agency Programme for Rational and Efficient Energy Use and Non- Traditional Sources (PROURE) National Energy Conservation Programme (PRONACE) (1) Eletrobras: Corporate funds and Global Reversion Reserve (RGR);; and international entities ; (2) PETROBRAS: Corporate funds (1) Ministry of Mining/Ministry budget fund; (2) Board of directors made up of representatives of the ministries of energy and finance and of the Confederation of Production and Commerce Ministry of Mines and Energy/public budget fund
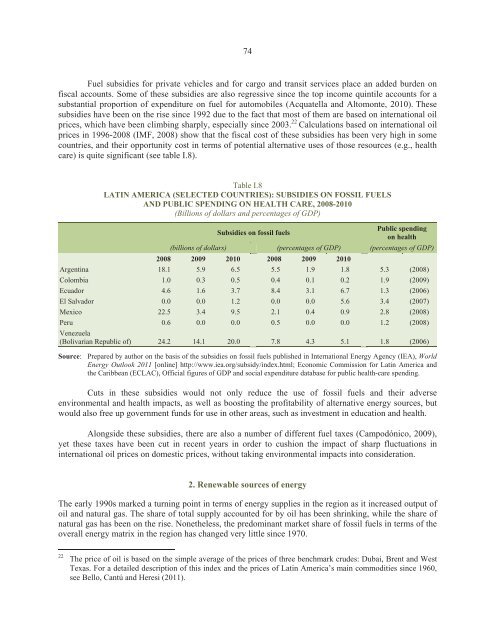
74 Fuel subsidies for private vehicles and for cargo and transit services place an added burden on fiscal accounts. Some of these subsidies are also regressive since the top income quintile accounts for a substantial proportion of expenditure on fuel for automobiles (Acquatella and Altomonte,
- Page 24: 23 Bibliography Acquatella, J. and
- Page 27 and 28: 26 inequality, access to basic serv
- Page 29 and 30: 28 Figure I.3 LATIN AMERICA AND THE
- Page 31 and 32: 30 air (see the section on health),
- Page 33 and 34: 32 Figure I.7 LATIN AMERICA AND THE
- Page 35 and 36: 34 Figure I.9 LATIN AMERICA AND THE
- Page 37 and 38: 36 The problem of unreliable servic
- Page 39 and 40: 38 Figure I.11 LATIN AMERICA AND TH
- Page 41 and 42: 40 Concerning tenure, certain struc
- Page 43 and 44: 42 Thanks to the improvements in wa
- Page 45 and 46: 44 One of the greatest health risks
- Page 47 and 48: 46 In Latin America and the Caribbe
- Page 49 and 50: 48 Figure I.14 UNDERNUTRITION AND O
- Page 51 and 52: 50 Generally speaking, national hea
- Page 53 and 54: 52 covered by existing retirement s
- Page 55 and 56: 54 Box I.3 MAINSTREAMING DISASTER-R
- Page 57 and 58: 56 patterns in Latin America, with
- Page 59 and 60: 58 In fact, despite achievements ma
- Page 61 and 62: 60 The second productivity feature
- Page 63 and 64: 62 for groups that are usually bypa
- Page 65 and 66: 64 Figure I.18 LATIN AMERICA AND TH
- Page 67 and 68: 66 2009). In addit
- Page 69 and 70: 68 production will, however, height
- Page 71 and 72: 70 Lastly, climate factors are also
- Page 73: 72 C. ENERGY: ENERGY INTENSITY, EFF
- Page 77 and 78: 76 Table I.9 LAWS FOR THE PROMOTION
- Page 79 and 80: 78 reduction must also be mainstrea
- Page 81 and 82: 80 Box I.7 URBAN SUSTAINABILITY IN
- Page 83 and 84: 82 Box I.8 THE ECO-EFFICIENCY OF UR
- Page 85 and 86: 84 Figure I.21 SELECTED COUNTRIES:
- Page 87 and 88: 86 E. STRENGTHENING THE STATE AND A
- Page 89 and 90: 88 Bibliography Acquatella, Jean (<
- Page 91 and 92: 90 Fresco, Louise (20</stro
- Page 93 and 94: 92 Perroti, D.E. and R. Sánchez (<
- Page 95 and 96: 94 (2010b), Achiev
- Page 97 and 98: 96 Table II.1 RATIFICATION OF MULTI
- Page 99 and 100: 98 Box II.1 (concluded) Union of So
- Page 101 and 102: 100 Table II.3 LATIN AMERICA AND TH
- Page 103 and 104: 102 The same applies to the incenti
- Page 105 and 106: 104 Figure II.1 LATIN AMERICA AND T
- Page 107 and 108: 106 Box II.2 LATIN AMERICA AND THE
- Page 109 and 110: 108 Figure II.3 SHARE OF GLOBAL GRE
- Page 111 and 112: 110 Figure II.7 PER CAPITA CO 2 EMI
- Page 113 and 114: 112 Figure II.10 CARBON INTENSITY O
- Page 115 and 116: 114 Table II.4 LATIN AMERICA AND TH
- Page 117 and 118: 116 coast and in marine areas, the
- Page 119 and 120: 118 Box II.4 CENTRAL AMERICA: BIODI
- Page 121 and 122: 120 25 Figure II.1
- Page 123 and 124: 122 The valuable assets related to
74<br />
Fuel subsidies for private vehicles and for cargo and transit services place an added burden <strong>on</strong><br />
fiscal accounts. Some of <strong>the</strong>se subsidies are also regressive since <strong>the</strong> top income quintile accounts for a<br />
substantial proporti<strong>on</strong> of expenditure <strong>on</strong> fuel for automobiles (Acquatella and Altom<strong>on</strong>te, <str<strong>on</strong>g>20</str<strong>on</strong>g>10). These<br />
subsidies have been <strong>on</strong> <strong>the</strong> rise since 1992 due to <strong>the</strong> fact that most of <strong>the</strong>m are based <strong>on</strong> internati<strong>on</strong>al oil<br />
prices, which have been climbing sharply, especially since <str<strong>on</strong>g>20</str<strong>on</strong>g>03. 22 Calculati<strong>on</strong>s based <strong>on</strong> internati<strong>on</strong>al oil<br />
prices in 1996-<str<strong>on</strong>g>20</str<strong>on</strong>g>08 (IMF, <str<strong>on</strong>g>20</str<strong>on</strong>g>08) show that <strong>the</strong> fiscal cost of <strong>the</strong>se subsidies has been very high in some<br />
countries, and <strong>the</strong>ir opportunity cost in terms of potential alternative uses of those resources (e.g., health<br />
care) is quite significant (see table I.8).<br />
Table I.8<br />
LATIN AMERICA (SELECTED COUNTRIES): SUBSIDIES ON FOSSIL FUELS<br />
AND PUBLIC SPENDING ON HEALTH CARE, <str<strong>on</strong>g>20</str<strong>on</strong>g>08-<str<strong>on</strong>g>20</str<strong>on</strong>g>10<br />
(Billi<strong>on</strong>s of dollars and percentages of GDP)<br />
Subsidies <strong>on</strong> fossil fuels<br />
Public spending<br />
<strong>on</strong> health<br />
(billi<strong>on</strong>s of dollars) (percentages of GDP) (percentages of GDP)<br />
<str<strong>on</strong>g>20</str<strong>on</strong>g>08 <str<strong>on</strong>g>20</str<strong>on</strong>g>09 <str<strong>on</strong>g>20</str<strong>on</strong>g>10 <str<strong>on</strong>g>20</str<strong>on</strong>g>08 <str<strong>on</strong>g>20</str<strong>on</strong>g>09 <str<strong>on</strong>g>20</str<strong>on</strong>g>10<br />
Argentina 18.1 5.9 6.5 5.5 1.9 1.8 5.3 (<str<strong>on</strong>g>20</str<strong>on</strong>g>08)<br />
Colombia 1.0 0.3 0.5 0.4 0.1 0.2 1.9 (<str<strong>on</strong>g>20</str<strong>on</strong>g>09)<br />
Ecuador 4.6 1.6 3.7 8.4 3.1 6.7 1.3 (<str<strong>on</strong>g>20</str<strong>on</strong>g>06)<br />
El Salvador 0.0 0.0 1.2 0.0 0.0 5.6 3.4 (<str<strong>on</strong>g>20</str<strong>on</strong>g>07)<br />
Mexico 22.5 3.4 9.5 2.1 0.4 0.9 2.8 (<str<strong>on</strong>g>20</str<strong>on</strong>g>08)<br />
Peru 0.6 0.0 0.0 0.5 0.0 0.0 1.2 (<str<strong>on</strong>g>20</str<strong>on</strong>g>08)<br />
Venezuela<br />
(Bolivarian Republic of) 24.2 14.1 <str<strong>on</strong>g>20</str<strong>on</strong>g>.0 7.8 4.3 5.1 1.8 (<str<strong>on</strong>g>20</str<strong>on</strong>g>06)<br />
Source: Prepared by author <strong>on</strong> <strong>the</strong> basis of <strong>the</strong> subsidies <strong>on</strong> fossil fuels published in Internati<strong>on</strong>al Energy Agency (IEA), World<br />
Energy Outlook <str<strong>on</strong>g>20</str<strong>on</strong>g>11 [<strong>on</strong>line] http://www.iea.org/subsidy/index.html; Ec<strong>on</strong>omic Commissi<strong>on</strong> for Latin America and<br />
<strong>the</strong> Caribbean (ECLAC), Official figures of GDP and social expenditure <strong>da</strong>tabase for public health-care spending.<br />
Cuts in <strong>the</strong>se subsidies would not <strong>on</strong>ly reduce <strong>the</strong> use of fossil fuels and <strong>the</strong>ir adverse<br />
envir<strong>on</strong>mental and health impacts, as well as boosting <strong>the</strong> profitability of alternative energy sources, but<br />
would also free up government funds for use in o<strong>the</strong>r areas, such as investment in educati<strong>on</strong> and health.<br />
Al<strong>on</strong>gside <strong>the</strong>se subsidies, <strong>the</strong>re are also a number of different fuel taxes (Campodónico, <str<strong>on</strong>g>20</str<strong>on</strong>g>09),<br />
yet <strong>the</strong>se taxes have been cut in recent <str<strong>on</strong>g>years</str<strong>on</strong>g> in order to cushi<strong>on</strong> <strong>the</strong> impact of sharp fluctuati<strong>on</strong>s in<br />
internati<strong>on</strong>al oil prices <strong>on</strong> domestic prices, without taking envir<strong>on</strong>mental impacts into c<strong>on</strong>siderati<strong>on</strong>.<br />
2. Renewable sources of energy<br />
The early 1990s marked a turning point in terms of energy supplies in <strong>the</strong> regi<strong>on</strong> as it increased output of<br />
oil and natural gas. The share of total supply accounted for by oil has been shrinking, while <strong>the</strong> share of<br />
natural gas has been <strong>on</strong> <strong>the</strong> rise. N<strong>on</strong>e<strong>the</strong>less, <strong>the</strong> predominant market share of fossil fuels in terms of <strong>the</strong><br />
overall energy matrix in <strong>the</strong> regi<strong>on</strong> has changed very little since 1970.<br />
22<br />
The price of oil is based <strong>on</strong> <strong>the</strong> simple average of <strong>the</strong> prices of three benchmark crudes: Dubai, Brent and West<br />
Texas. For a detailed descripti<strong>on</strong> of this index and <strong>the</strong> prices of Latin America’s main commodities since 1960,<br />
see Bello, Cantú and Heresi (<str<strong>on</strong>g>20</str<strong>on</strong>g>11).


