NCC Ltd (NAGCON) - ICICI Direct
NCC Ltd (NAGCON) - ICICI Direct
NCC Ltd (NAGCON) - ICICI Direct

Create successful ePaper yourself
Turn your PDF publications into a flip-book with our unique Google optimized e-Paper software.
Result Update<br />
Rating matrix<br />
Rating : Buy<br />
Target : | 48<br />
Target Period : 12-15 months<br />
Potential Upside : 22%<br />
Key Financials<br />
| crore FY11 FY12 FY13E FY14E<br />
Net sales 5073.7 5248.5 5995.5 6917.4<br />
EBITDA 487.6 397.3 471.6 558.5<br />
Net profit 163.4 36.0 81.4 100.8<br />
Valuation summary<br />
FY11 FY12E FY13E FY14E<br />
EPS (|) 6.4 1.4 3.2 3.9<br />
Adj. PE(x) 1.2 5.5 2.4 2.0<br />
Target PE(x) 2.6 12.0 5.3 4.3<br />
EV/EBITDA(x) 6.9 8.0 7.2 6.7<br />
P/BV(x) 0.4 0.4 0.4 0.4<br />
RoNW(%) 7.1 1.5 3.3 4.0<br />
RoCE(%) 9.7 6.6 7.8 8.7<br />
Stock data<br />
Market Capitalisation<br />
Debt<br />
Cash<br />
| 1005 crore<br />
| 2571 crore<br />
| 64 crore<br />
EV<br />
| 3512 crore<br />
52 week H/L 74/28<br />
Equity capital<br />
| 51 Crore<br />
Face value | 2<br />
DII Holding (%) 6.8<br />
FII Holding (%) 41.5<br />
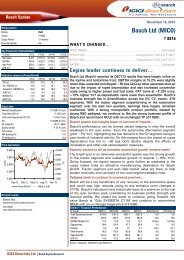
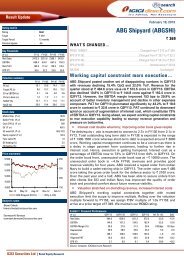
Price movement<br />
6,100<br />
4,900<br />
3,700<br />
2,500<br />
Aug-11<br />
Analyst’s name<br />
Nov-11<br />
Price (R.H.S)<br />
Feb-12<br />
Deepak Purswani, CFA<br />
deepak.purswani@icicisecurities.com<br />
Bhupendra Tiwary<br />
bhupendra.tiwary@icicisecurities.com<br />
May-12<br />
Nifty (L.H.S)<br />
90<br />
60<br />
30<br />
0<br />
Aug-12<br />
WHAT’S CHANGED…<br />
August 10, 2012<br />
<strong>NCC</strong> <strong>Ltd</strong> (<strong>NAGCON</strong>)<br />
| 39<br />
PRICE TARGET........................................................................... Changed from | 36 to | 48<br />
EPS (FY13E)............................................................................. Changed from | 2.6 to | 3.2<br />
EPS (FY14E)............................................................................. Changed from | 3.3 to | 3.9<br />
RATING....................................................................................... Changed from Hold to Buy<br />
Focuses on debt paring through asset sale…<br />
<strong>NCC</strong> continued its superior execution in Q1FY13 reporting a topline of<br />
| 1472.1 crore vs. our estimate of | 1200 crore (also aided by booking of<br />
revenues from the Krishnapatnam power project EPC of | 82 crore).<br />
Consequently, the company posted a PAT of | 16.6 crore vs. our estimate<br />
of | 6.6 crore. The order currently stands at | 20,520 crore (order inflows<br />
of | 2000 crore in Q1FY13) implying TTM order book to bill of 3.7x. The<br />
management has guided for 10-15% topline growth in FY13, which<br />
seems achievable considering the pace of execution. Furthermore, the<br />
company is looking to bring down its debt levels by | 500 crore through<br />
stake sale in BOT projects. If this materialises, that would be a key trigger<br />
for the performance of the stock. Comforted by a pick-up in execution<br />
and management plan to pare debts, we assign BUY on the stock, which<br />
is available at attractive valuation of 0.4x FY13 P/BV.<br />
Strong execution; guidance of 10-15% topline growth achievable…<br />
<strong>NCC</strong>’s topline grew 29% YoY | 1472.1 crore (our estimate: - | 1200 crore)<br />
led by superior execution and booking of revenues from the<br />
Krishnapatnam power project EPC (| 82 crore). The EBITDA margin at<br />
7.9% was largely in line with our estimate of 7.8%. The company,<br />
consequently, posted a net profit of | 16.6 crore (our estimate: | 6.6<br />
crore). The management has guided for 10-15% topline growth in FY13,<br />
which seems achievable considering the pace of execution.<br />
Healthy order book, order inflows worth | 2000 crore during Q1FY13<br />
<strong>NCC</strong> secured orders worth ~| 2000 crore during the quarter to close the<br />
order book at | 20,520 crore, implying TTM order book to bill of 3.7x. We<br />
highlight that for FY13 while the management has guided for order inflow<br />
of | 8,500 crore, we have built in order inflows worth | 7000 crore given<br />
the challenging environment.<br />
Upgrade to BUY led by improved execution and focus on debt paring…<br />
<strong>NCC</strong>’s execution has shown a major improvement in the last couple of<br />
quarters. Given the pick-up in execution, no further equity commitment<br />
towards subsidiaries (it has already invested | 370 crore and does not<br />
expect further outflow in the next 12 months) and the management’s<br />
focus on paring its net debt from | 2507 crore to | 2000 crore (through<br />
stake sale in BOT project particularly in power project stake sale) along<br />
with an attractive valuation of 0.4x FY13 P/BV and 2.4x FY13 adjusted P/E,<br />
we assign a BUY rating with an SoTP target price of | 48/share.<br />
Exhibit 1: Financial Performance<br />
| crore Q1FY13 Q1FY13E Q1FY12 Q4FY12 YoY Gr (%) QoQ Gr (%)<br />
Net sales 1472.1 1200.0 1140.9 1753.8 29.0 -16.1<br />
EBITDA 116.7 94.1 115.8 101.1 0.8 15.4<br />
EBITDA Margin (%) 7.9 7.8 10.2 5.8 - 222 bps 216 bps<br />
Depreciation 22.5 23.4 19.7 21.7 14.1 3.7<br />
Net Interest 71.1 63.3 64.0 68.4 11.2 4.0<br />
PAT 16.6 6.6 23.3 10.8 -28.6 54.0<br />
Source: Company, <strong>ICICI</strong>direct.com Research<br />
<strong>ICICI</strong> Securities <strong>Ltd</strong> | Retail Equity Research
Key Assumptions…<br />
Exhibit 2: Key assumptions<br />
| crore FY12 FY13E FY14E<br />
Order inflow 10,116 7,000 7,750<br />
Order Book 20,196 20,761 20,767<br />
Execution rate- Average (%) 28.9 29.3 33.3<br />
Source: Company, <strong>ICICI</strong>direct.com Research<br />
The topline came at | 1472.1 crore vs. our estimate of<br />
| 1200 crore led by superior execution and booking of<br />
revenues from power project EPC (| 82 crore)<br />
Strong execution leads to better show…<br />
• <strong>NCC</strong>’s topline came at | 1472.1 crore vs. our estimate of | 1200<br />
crore led by superior execution and booking of revenues from the<br />
power project EPC (| 82 crore)<br />
• The EBITDA margin at 7.9% was largely in line with our estimates of<br />
7.8%<br />
• The company, consequently, posted a net profit of | 16.6 crore vs.<br />
our estimate of net profit of | 6.6 crore<br />
Order book strong...inflows worth | 2000 crore in Q1FY13<br />
• <strong>NCC</strong> secured orders worth ~| 2000 crore during the quarter to<br />
close the order book at | 20,520 crore at the end of the quarter,<br />
implying TTM order book to bill of 3.7x<br />
• We highlight that for FY13 while the management has guided for<br />
order inflow of | 8,500 crore, we have built in order inflows worth<br />
| 7000 crore<br />
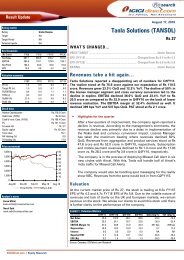
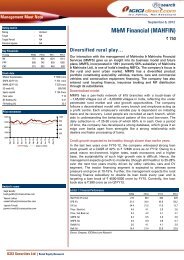
Exhibit 3: Order book strong, execution pick-up a positive…<br />
22,000<br />
4.4<br />
21990<br />
4.5<br />
<strong>NCC</strong> secured orders worth ~| 2000 crore during the<br />
quarter to close the order book at | 20,520 crore at the end<br />
of the quarter, implying TTM order book to bill of 3.7x<br />
(| crore)<br />
20,000<br />
18,000<br />
20196<br />
3.8<br />
20520<br />
3.7<br />
4.1<br />
3.7<br />
(x)<br />
16,000<br />
161803.2 161893.2<br />
165703.3<br />
3.3<br />
14,000<br />
Q4FY11 Q1FY12 Q2FY12 Q3FY12 Q4FY12 Q1FY13<br />
2.9<br />
Order Book (| crore)<br />
Order book-to-bill ratio (RHS)<br />
Source: Company, <strong>ICICI</strong>direct.com Research<br />
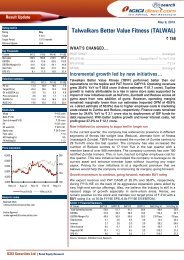
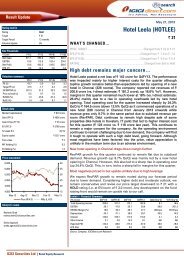
Exhibit 4: Buildings, new divisions contribute ~64% of order book<br />
Buildings and new divisions (including power orders<br />
worth~| 5200 crore) contributed ~64% of the order book<br />
100<br />
75<br />
(%)<br />
50<br />
25<br />
0<br />
13 11 8 8 9<br />
19 18<br />
10 12<br />
36 38 33<br />
13 11<br />
9 10<br />
10<br />
4 4<br />
12<br />
2<br />
11 15<br />
2<br />
38 39<br />
30 28 31<br />
Q1FY12 Q2FY12 Q3FY12 Q4FY12 Q1FY13<br />
Buildings Transportation Water Electrical<br />
Irrigation New Divisions * International<br />
Source: Company, <strong>ICICI</strong>direct.com Research * includes power, metals and mining<br />
<strong>ICICI</strong> Securities <strong>Ltd</strong> | Retail Equity Research Page 2
<strong>NCC</strong> has been short-listed by the Government of Andhra<br />
Pradesh for ~ 500 MW at ~| 3.7 per unit. Currently, it is<br />
also looking to participate in case 1 bidding by various<br />
state governments like Tamil Nadu and Karnataka to tie up<br />
70% of the power generated<br />
Subsidiaries’ Performance<br />
Subsidiaries (| crore) Revenues PAT<br />
<strong>NCC</strong> International (Muscat) 206.9 3.7<br />
<strong>NCC</strong> Dubai 5.5 1.7<br />
<strong>NCC</strong> Urban 54.4 0.8<br />
<strong>NCC</strong> Infrastructure 0.2 -2.3<br />
<strong>NCC</strong> Infra Mauritius 6.0 2.0<br />
BOT projects Revenues PAT<br />
OB Infra 22.5 0.5<br />
Western UP 22.4 -1.1<br />
Bangalore Elevated 7.9 -3.2<br />
Pondicherry 1.5 -2.2<br />
Brindavan Infrastructure 5.0 1.4<br />
Krishnapatnam power project update<br />
After the financial closure of the Krishnapatnam Project, <strong>NCC</strong> booked<br />
revenues worth | 82 crore in Q1FY13. In terms of coal linkage, <strong>NCC</strong> has<br />
also transferred the Sompeta project coal linkages for ~70% of coal<br />
requirement to the Krishnapatnam project, the LoI for which has been<br />
received by the company from Coal India. Furthermore, the company<br />
has also taken a stake in a greenfield Indonesian coal mine with capacity<br />
of ~ 30 MT, which should suffice for coal requirement of 10 years. The<br />
same would entail an investment of ~ US$10 million out of which ~<br />
US$2 million has already been invested by <strong>NCC</strong>.<br />
In terms of PPA, <strong>NCC</strong> has been short-listed by the Government of<br />
Andhra Pradesh for ~ 500 MW at ~| 3.7/unit. Currently, it is also looking<br />
to participate in case 1 bidding by various state governments like Tamil<br />
Nadu and Karnataka to tie up 70% of the power generated within the<br />
next one year, which is a pre-requisite as per the terms with lenders.<br />
The total project cost of 1,320 MW project is ~ | 7000 with debt to equity<br />
in the ratio of 3:1. <strong>NCC</strong>’s share of equity contribution is ~ | 970 crore<br />
over four years. The company has so far infused | 370 crore of equity as<br />
required for financial closure and would not require any equity infusion<br />
over one year. <strong>NCC</strong> is also looking for a stake sale in the project in order<br />
to meet its equity contribution further.<br />
Himachal Sorang power project update<br />
The completion of the Himachal Sorang Hydro power project has been<br />
delayed due to local issues. It is now expected to commence operation<br />
from December 2012 vs. end of FY12 guided earlier. The company is<br />
also looking to dilute its stake in the project to some PE players (as<br />
reported in the media).<br />
Debtor days improve…<br />
The net working capital days (ex-cash) stood at 177 days in Q1FY13 vs.<br />
182 days in Q4FY12 aided by an improvement in debtor days, which<br />
have come down to 88 days in Q1FY13 against 91 days in Q4FY12. The<br />
gross debt level, however, at | 2571 crore vs. | 2234 crore has risen by<br />
| 337 crore sequentially. The company hopes to reduce it by | 500 crore<br />
by FY13 by a stake sale in BOT projects and real estate.<br />
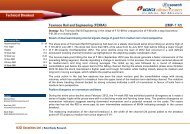
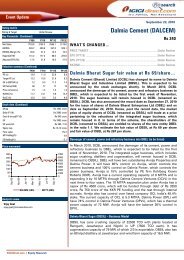
Exhibit 5: Working capital, net debt to equity trend<br />
240<br />
1.5<br />
There has been an improvement in debtor days, which<br />
180<br />
1.0<br />
1.0<br />
1.2<br />
have come down to 88 days in Q1FY13 as against 91 days<br />
in Q4FY12<br />
(days)<br />
120<br />
204<br />
1.0<br />
206<br />
0.9<br />
182 177<br />
0.9<br />
0.6<br />
(x)<br />
60<br />
0.3<br />
0<br />
FY11 M9FY12 FY12 Q1FY13<br />
0.0<br />
Net working capital (ex cash)<br />
Debt/Equity (RHS)<br />
Source: Company, <strong>ICICI</strong>direct.com Research<br />
<strong>ICICI</strong> Securities <strong>Ltd</strong> | Retail Equity Research Page 3
Valuations<br />
We have incorporated the Q1FY13 results and, therefore, built in superior<br />
execution driven by power segment execution and comfort from last few<br />
quarters’ execution. Consequently, we have upgraded our FY13E and<br />
FY14E earnings by ~21% and 20%, respectively.<br />
Exhibit 6: Change in estimates<br />
Particulars<br />
FY13E<br />
FY14E<br />
Old New % Change Old New % Change<br />
Revenue 5,714.1 5995.5 4.9 6,600.2 6917.4 4.8<br />
EBITDA 448.1 471.6 5.2 558.5 558.5 (0.0)<br />
EBITDA Margin % 7.8 7.9 2 bps 8.5 8.1 -39 bps<br />
PAT 67.5 81.4 20.6 84.0 100.8 20.0<br />
EPS 2.6 3.2 20.6 3.3 3.9 20.0<br />
Source: Company, <strong>ICICI</strong>direct.com Research<br />
<strong>NCC</strong>’s execution has shown a major improvement in the last couple of<br />
quarters. Given the pick-up in execution, no further equity commitment<br />
towards subsidiaries (it has already invested | 370 crore and does not<br />
expect further outflow in the next 12 months) and the management’s<br />
focus on paring its net debt from | 2507 crore to | 2000 crore (through<br />
stake sale in BOT project particularly in power project stake sale) along<br />
with an attractive valuation of 0.4x FY13 P/B and 2.4x FY13 adjusted P/E,<br />
we have assigned a BUY rating with a SoTP target price of | 48/share.<br />
Exhibit 7: SOTP Valuation - <strong>NCC</strong><br />
Entity<br />
Value<br />
(| crore)<br />
Per share<br />
(|)<br />
Comment<br />
Our target price for <strong>NCC</strong> is | 48/share based on the SOTP<br />
methodology<br />
Domestic Construction Business 2,829 110 6x FY13 EV/EBITDA<br />
International Construction Business 120 5 5x FY13 Earning estimates<br />
BOT Road 298 12<br />
Brindavan Infrastructure 11 0.4<br />
Bangalore Elevated 80 3.1<br />
OB Infra 52 2.0<br />
Western UP Expressway 105 4.1<br />
Pondicherry-Trindivanam 50 1.9<br />
Value BOT projects based on FCFE<br />
metholdogy. We have assumed CoE of<br />
13% for annuity & 14% for toll based<br />
projects.<br />
Investment in real estate 90 4<br />
Value at 0.5x P/BV due to lack of<br />
clarity on <strong>NCC</strong> Harmony<br />
Investment in power 300 12 At .8x P/BV<br />
Less:Net Debt (2,397) (93) FY13 net debt<br />
Fair Value 48<br />
Source: Company, <strong>ICICI</strong>direct.com Research<br />
Exhibit 8: Valuation metrics<br />
Sales<br />
(| crore)<br />
Sales Gr<br />
(%)<br />
EPS<br />
(Rs)<br />
EPS Gr<br />
(%)<br />
Adj P/E<br />
(x)<br />
P/BV<br />
(x)<br />
RoNW<br />
(%)<br />
FY11 5073.7 6.2 6.4 -15.0 1.2 0.4 7.1 9.7<br />
FY12 5248.5 3.4 1.4 -78.0 5.5 0.4 1.5 6.6<br />
FY13E 5995.5 14.2 3.2 126.1 2.4 0.4 3.3 7.8<br />
FY14E 6917.4 15.4 3.9 23.9 2.0 0.4 4.0 8.7<br />
Source: Company, <strong>ICICI</strong>direct.com Research<br />
RoCE<br />
(%)<br />
<strong>ICICI</strong> Securities <strong>Ltd</strong> | Retail Equity Research Page 4
Financial summary<br />
Profit and loss statement<br />
(| Crore) FY11 FY12 FY13E FY14E<br />
Total operating Income 5,073.7 5,248.5 5,995.5 6,917.4<br />
Growth (%) 6.2 3.4 14.2 15.4<br />
Op. Expenditure 4,586.1 4,851.1 5,523.9 6,359.0<br />
EBITDA 487.6 397.3 471.6 558.5<br />
Growth (%) 0.7 -18.5 18.7 18.4<br />
Depreciation 68.5 83.0 97.3 108.0<br />
EBIT 419.1 314.3 374.3 450.5<br />
Interest 168.2 272.7 270.7 313.9<br />
Other Income 14.6 11.3 18.1 14.6<br />
Extraordinary Item 0.0 0.0 0.0 0.0<br />
PBT 265.6 52.9 121.6 151.1<br />
Tax 102.1 16.9 40.3 50.3<br />
Rep. PAT before MI 163.4 36.0 81.4 100.8<br />
Minority Interest (MI) 0.0 0.0 0.0 0.0<br />
Rep. PAT after MI 163.4 36.0 81.4 100.8<br />
Adjustments 0.0 0.0 0.0 0.0<br />
Adj. Net Profit 163.4 36.0 81.4 100.8<br />
Growth (%) -15.0 -78.0 126.1 23.9<br />
EPS (|) 6.4 1.4 3.2 3.9<br />
Source: Company, <strong>ICICI</strong>direct.com Research<br />
Cash flow statement<br />
(| Crore) FY11 FY12P FY13E FY14E<br />
Net Profit before Tax 265.6 52.9 121.6 151.1<br />
Other Non Cash Exp 0.0 0.0 0.0 0.0<br />
Depreciation 68.5 83.0 97.3 108.0<br />
<strong>Direct</strong> Tax Paid 160.0 16.9 40.3 50.3<br />
Other Items 159.6 284.1 290.4 328.4<br />
CF before change in WC 333.7 380.3 429.7 508.1<br />
Inc./Dec. In WC -567.8 267.6 -160.4 -379.8<br />
CF from Operations -234.0 647.8 269.3 128.4<br />
Pur. of Fix Assets -190.4 -183.0 -160.6 -100.6<br />
Pur. of Inv -247.3 -50.0 -50.0 -50.0<br />
Others -56.7 11.4 19.7 14.6<br />
CF from Investing -494.4 -221.5 -190.9 -136.0<br />
Inc./(Dec.) in Debt 953.2 -250.0 250.0 300.0<br />
Inc./(Dec.) in Net Worth 0.0 0.0 0.0 0.0<br />
Others -284.7 -275.2 -282.4 -328.3<br />
CF from Financing 668.5 -525.2 -32.4 -28.3<br />
Net Cash Flow -60.0 -98.9 46.0 -36.0<br />
Opening Cash 199.7 139.7 40.8 86.8<br />
Closing Cash 139.7 40.8 86.8 50.8<br />
Source: Company, <strong>ICICI</strong>direct.com Research<br />
Balance sheet<br />
(| Crore) FY11 FY12P FY13E FY14E<br />
Liabilities<br />
Equity Capital 51.3 51.3 51.3 51.3<br />
Reserves & Surplus 2,327.4 2,367.8 2,448.1 2,534.4<br />
Shareholder's Fund 2,378.7 2,419.1 2,499.4 2,585.7<br />
Borrowings 1,212.1 1,212.1 1,212.1 1,212.1<br />
Unsecured Loans 1,272.0 1,022.0 1,272.0 1,572.0<br />
Deferred Tax Liability 30.8 30.8 30.8 30.8<br />
Source of Funds 4,893.5 4,683.9 5,014.2 5,400.6<br />
Assets<br />
Gross Block 921.2 1,103.5 1,263.5 1,363.5<br />
Less: Acc. Depreciation 247.4 332.1 429.8 537.2<br />
Net Block 673.7 771.4 833.7 826.3<br />
Capital WIP 46.9 46.9 46.9 46.9<br />
Net Fixed Assets 720.6 818.3 880.6 873.3<br />
Intangible Assets 0.8 1.0 1.0 1.0<br />
Investments 1,200.8 1,250.8 1,300.8 1,350.8<br />
Cash 139.7 40.8 86.8 50.8<br />
Trade Receivables 1,453.6 1,307.0 1,577.6 1,749.6<br />
Loans & Advances 2,446.9 3,450.0 3,837.5 4,314.1<br />
Inventory 896.0 1,234.0 1,436.7 1,606.5<br />
Total Current Asset 4,945.5 6,040.8 6,947.6 7,730.0<br />
Current Liab. & Prov. 1,974.3 3,436.0 4,136.4 4,575.1<br />
Net Current Asset 2,971.2 2,604.8 2,811.2 3,154.9<br />
P&L Account 0.0 0.0 0.0 0.0<br />
Application of Funds 4,893.5 4,674.9 4,993.6 5,380.0<br />
Source: Company, <strong>ICICI</strong>direct.com Research<br />
Key ratios<br />
FY11 FY12P FY13E FY14E<br />
Per share data (|)<br />
EPS 6.4 1.4 3.2 3.9<br />
Cash EPS 9.2 4.8 7.2 8.3<br />
BV 92.7 94.3 97.4 100.8<br />
DPS 1.0 0.1 0.4 0.5<br />
Cash Per Share 5.4 1.6 3.4 2.0<br />
Operating Ratios (%)<br />
EBITDA Margin 9.6 7.6 7.9 8.1<br />
PBT / Total Operating income 5.2 1.0 2.0 2.2<br />
PAT Margin 3.2 0.7 1.4 1.5<br />
Inventory days 64 86 87 85<br />
Debtor days 105 91 96 92<br />
Creditor days 99 96 88 88<br />
Return Ratios (%)<br />
RoE 7.1 1.5 3.3 4.0<br />
RoCE 9.7 6.6 7.8 8.7<br />
RoIC 10.0 6.7 7.8 8.8<br />
Valuation Ratios (x)<br />
Adjusted P/E 1.2 5.5 2.4 2.0<br />
EV / EBITDA 6.9 8.0 7.2 6.7<br />
EV / Net Sales 0.7 0.6 0.6 0.5<br />
Price to Book Value 0.4 0.4 0.4 0.4<br />
Solvency Ratios<br />
Debt/EBITDA 5.1 5.6 5.3 5.0<br />
Debt / Equity 1.0 0.9 1.0 1.1<br />
Current Ratio 2.5 1.8 1.7 1.7<br />
Source: Company, <strong>ICICI</strong>direct.com Research<br />
<strong>ICICI</strong> Securities <strong>Ltd</strong> | Retail Equity Research Page 5
<strong>ICICI</strong>direct.com coverage universe<br />
CMP<br />
M Cap<br />
EPS (|) P/E (x) EV/EBITDA (x) P/B (x) RoE (%)<br />
Sector / Company (|) TP(|) Rating (| Cr) FY12 FY13E FY14E FY12 FY13E FY14E FY12 FY13E FY14E FY12 FY13E FY14E FY12 FY13E FY14E<br />
Construction<br />
HCC (HINCON) 17 15 Sell 1,047 -1.9 -2.5 -0.2 NA NA NA 12.4 14.4 10.8 0.9 1.0 1.1 -15.7 -9.8 -1.0<br />
IVRCL (IVRINF) 44 44 Hold 1,184 0.9 2.4 4.0 52.0 19.6 11.7 10.1 7.9 2.2 0.6 0.6 0.6 1.2 3.1 5.0<br />
<strong>NCC</strong> (<strong>NAGCON</strong>) 39 48 Buy 1,005 1.4 3.2 3.9 5.5 2.4 2.0 8.0 7.2 6.7 0.4 0.4 0.4 1.5 3.3 4.0<br />
Simplex Infra (SIMCON) 201 301 Buy 998 18.0 21.9 27.6 13.3 10.9 8.7 6.1 5.6 5.1 1.0 0.9 0.8 7.8 8.6 9.8<br />
Supreme Infra (SUPINF) 292 316 Buy 488 55.3 59.3 76.3 4.1 3.2 3.2 4.9 4.1 3.7 1.3 1.0 0.8 25.0 21.3 21.7<br />
Unity Infra (UNIINF) 45 64 Buy 334 14.0 14.4 16.9 3.5 3.4 2.9 3.6 3.6 3.5 0.5 0.5 0.5 14.8 13.4 13.9<br />
Exhibit 9: Recommendation History<br />
80<br />
60<br />
40<br />
20<br />
0<br />
Aug-11<br />
Oct-11<br />
Nov-11<br />
Jan-12<br />
Feb-12<br />
Apr-12<br />
May-12<br />
Jun-12<br />
Aug-12<br />
Price<br />
Target Price<br />
Source: Reuters, <strong>ICICI</strong>direct.com Research<br />
Exhibit 10: Recent Releases<br />
Date Event CMP Target Price Rating<br />
1-Jun-11 Q4FY11 Result Update 87 98 Buy<br />
17-Aug-11 Q1FY12 Result Update 55 74 Buy<br />
9-Nov-11 Q2FY12 Result Update 55 64 Buy<br />
6-Feb-12 Q3FY12 Result Update 62 55 Sell<br />
30-May-12 Q4FY12 Result Update 32 36 Buy<br />
6-Jul-12 Q1FY13 Result Preview 45 36 Hold<br />
Source: Company, <strong>ICICI</strong>direct.com Research<br />
<strong>ICICI</strong> Securities <strong>Ltd</strong> | Retail Equity Research Page 6
RATING RATIONALE<br />
<strong>ICICI</strong>direct.com endeavours to provide objective opinions and recommendations. <strong>ICICI</strong>direct.com assigns<br />
ratings to its stocks according to their notional target price vs. current market price and then categorises them<br />
as Strong Buy, Buy, Hold and Sell. The performance horizon is two years unless specified and the notional<br />
target price is defined as the analysts' valuation for a stock.<br />
Strong Buy: >15%/20% for large caps/midcaps, respectively, with high conviction;<br />
Buy: > 10%/ 15% for large caps/midcaps, respectively;<br />
Hold: Up to +/-10%;<br />
Sell: -10% or more;<br />
Pankaj Pandey Head – Research pankaj.pandey@icicisecurities.com<br />
<strong>ICICI</strong>direct.com Research Desk,<br />
<strong>ICICI</strong> Securities Limited,<br />
1 st Floor, Akruti Trade Centre,<br />
Road No. 7, MIDC,<br />
Andheri (East)<br />
Mumbai – 400 093<br />
research@icicidirect.com<br />
ANALYST CERTIFICATION<br />
We /I, Deepak Purswani CFA, PGDM (FINANCE) Bhupendra Tiwary MBA (FINANCE) research analysts, authors and the names subscribed to this report, hereby certify that all of the views expressed in this<br />
research report accurately reflect our personal views about any and all of the subject issuer(s) or securities. We also certify that no part of our compensation was, is, or will be directly or indirectly related to<br />
the specific recommendation(s) or view(s) in this report. Analysts aren't registered as research analysts by FINRA and might not be an associated person of the <strong>ICICI</strong> Securities Inc.<br />
Disclosures:<br />
<strong>ICICI</strong> Securities Limited (<strong>ICICI</strong> Securities) and its affiliates are a full-service, integrated investment banking, investment management and brokerage and financing group. We along with affiliates are leading<br />
underwriter of securities and participate in virtually all securities trading markets in India. We and our affiliates have investment banking and other business relationship with a significant percentage of<br />
companies covered by our Investment Research Department. Our research professionals provide important input into our investment banking and other business selection processes. <strong>ICICI</strong> Securities<br />
generally prohibits its analysts, persons reporting to analysts and their dependent family members from maintaining a financial interest in the securities or derivatives of any companies that the analysts<br />
cover.<br />
The information and opinions in this report have been prepared by <strong>ICICI</strong> Securities and are subject to change without any notice. The report and information contained herein is strictly confidential and<br />
meant solely for the selected recipient and may not be altered in any way, transmitted to, copied or distributed, in part or in whole, to any other person or to the media or reproduced in any form, without<br />
prior written consent of <strong>ICICI</strong> Securities. While we would endeavour to update the information herein on reasonable basis, <strong>ICICI</strong> Securities, its subsidiaries and associated companies, their directors and<br />
employees (“<strong>ICICI</strong> Securities and affiliates”) are under no obligation to update or keep the information current. Also, there may be regulatory, compliance or other reasons that may prevent <strong>ICICI</strong> Securities<br />
from doing so. Non-rated securities indicate that rating on a particular security has been suspended temporarily and such suspension is in compliance with applicable regulations and/or <strong>ICICI</strong> Securities<br />
policies, in circumstances where <strong>ICICI</strong> Securities is acting in an advisory capacity to this company, or in certain other circumstances.<br />
This report is based on information obtained from public sources and sources believed to be reliable, but no independent verification has been made nor is its accuracy or completeness guaranteed. This<br />
report and information herein is solely for informational purpose and may not be used or considered as an offer document or solicitation of offer to buy or sell or subscribe for securities or other financial<br />
instruments. Though disseminated to all the customers simultaneously, not all customers may receive this report at the same time. <strong>ICICI</strong> Securities will not treat recipients as customers by virtue of their<br />
receiving this report. Nothing in this report constitutes investment, legal, accounting and tax advice or a representation that any investment or strategy is suitable or appropriate to your specific<br />
circumstances. The securities discussed and opinions expressed in this report may not be suitable for all investors, who must make their own investment decisions, based on their own investment<br />
objectives, financial positions and needs of specific recipient. This may not be taken in substitution for the exercise of independent judgment by any recipient. The recipient should independently evaluate<br />
the investment risks. The value and return of investment may vary because of changes in interest rates, foreign exchange rates or any other reason. <strong>ICICI</strong> Securities and affiliates accept no liabilities for any<br />
loss or damage of any kind arising out of the use of this report. Past performance is not necessarily a guide to future performance. Investors are advised to see Risk Disclosure Document to understand the<br />
risks associated before investing in the securities markets. Actual results may differ materially from those set forth in projections. Forward-looking statements are not predictions and may be subject to<br />
change without notice.<br />
<strong>ICICI</strong> Securities and its affiliates might have managed or co-managed a public offering for the subject company in the preceding twelve months. <strong>ICICI</strong> Securities and affiliates might have received<br />
compensation from the companies mentioned in the report during the period preceding twelve months from the date of this report for services in respect of public offerings, corporate finance, investment<br />
banking or other advisory services in a merger or specific transaction. It is confirmed that Deepak Purswani CFA, PGDM (FINANCE) Bhupendra Tiwary MBA (FINANCE) research analysts and the authors of<br />
this report have not received any compensation from the companies mentioned in the report in the preceding twelve months. Our research professionals are paid in part based on the profitability of <strong>ICICI</strong><br />
Securities, which include earnings from Investment Banking and other business.<br />
<strong>ICICI</strong> Securities or its subsidiaries collectively do not own 1% or more of the equity securities of the Company mentioned in the report as of the last day of the month preceding the publication of the<br />
research report.<br />
It is confirmed that Deepak Purswani CFA, PGDM (FINANCE) Bhupendra Tiwary MBA (FINANCE) research analysts and the authors of this report or any of their family members does not serve as an<br />
officer, director or advisory board member of the companies mentioned in the report.<br />
<strong>ICICI</strong> Securities may have issued other reports that are inconsistent with and reach different conclusion from the information presented in this report. <strong>ICICI</strong> Securities and affiliates may act upon or make use<br />
of information contained in the report prior to the publication thereof.<br />
This report is not directed or intended for distribution to, or use by, any person or entity who is a citizen or resident of or located in any locality, state, country or other jurisdiction, where such distribution,<br />
publication, availability or use would be contrary to law, regulation or which would subject <strong>ICICI</strong> Securities and affiliates to any registration or licensing requirement within such jurisdiction. The securities<br />
described herein may or may not be eligible for sale in all jurisdictions or to certain category of investors. Persons in whose possession this document may come are required to inform themselves of and<br />
to observe such restriction.<br />
<strong>ICICI</strong> Securities <strong>Ltd</strong> | Retail Equity Research Page 7