Outlier Detection Using k-Nearest Neighbour Graph - Joensuu
Outlier Detection Using k-Nearest Neighbour Graph - Joensuu
Outlier Detection Using k-Nearest Neighbour Graph - Joensuu

You also want an ePaper? Increase the reach of your titles
YUMPU automatically turns print PDFs into web optimized ePapers that Google loves.
¥<br />
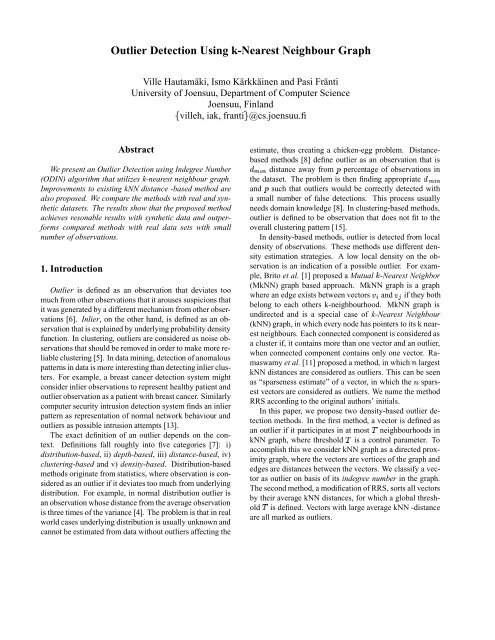
<strong>Outlier</strong> <strong>Detection</strong> <strong>Using</strong> k-<strong>Nearest</strong> <strong>Neighbour</strong> <strong>Graph</strong><br />
Ville Hautamäki, Ismo Kärkkäinen and Pasi Fränti<br />
University of <strong>Joensuu</strong>, Department of Computer Science<br />
<strong>Joensuu</strong>, Finland<br />
villeh, iak, franti¡ @cs.joensuu.fi<br />
Abstract<br />
We present an <strong>Outlier</strong> <strong>Detection</strong> using Indegree Number<br />
(ODIN) algorithm that utilizes k-nearest neighbour graph.<br />
Improvements to existing kNN distance -based method are<br />
also proposed. We compare the methods with real and synthetic<br />
datasets. The results show that the proposed method<br />
achieves resonable results with synthetic data and outperforms<br />
compared methods with real data sets with small<br />
number of observations.<br />
1. Introduction<br />
<strong>Outlier</strong> is defined as an observation that deviates too<br />
much from other observations that it arouses suspicions that<br />
it was generated by a different mechanism from other observations<br />
[6]. Inlier, on the other hand, is defined as an observation<br />
that is explained by underlying probability density<br />
function. In clustering, outliers are considered as noise observations<br />
that should be removed in order to make more reliable<br />
clustering [5]. In data mining, detection of anomalous<br />
patterns in data is more interesting than detecting inlier clusters.<br />
For example, a breast cancer detection system might<br />
consider inlier observations to represent healthy patient and<br />
outlier observation as a patient with breast cancer. Similarly<br />
computer security intrusion detection system finds an inlier<br />
pattern as representation of normal network behaviour and<br />
outliers as possible intrusion attempts [13].<br />
The exact definition of an outlier depends on the context.<br />
Definitions fall roughly into five categories [7]: i)<br />
distribution-based, ii) depth-based, iii) distance-based, iv)<br />
clustering-based and v) density-based. Distribution-based<br />
methods originate from statistics, where observation is considered<br />
as an outlier if it deviates too much from underlying<br />
distribution. For example, in normal distribution outlier is<br />
an observation whose distance from the average observation<br />
is three times of the variance [4]. The problem is that in real<br />
world cases underlying distribution is usually unknown and<br />
cannot be estimated from data without outliers affecting the<br />
estimate, thus creating a chicken-egg problem. Distancebased<br />
methods [8] define outlier as an observation that is<br />
¢¤£¦¥¨§<br />
distance away © from percentage of observations in<br />
the dataset. The problem is then finding appropriate<br />
and ¢£¦¥§<br />
such that outliers would be correctly detected with<br />
©<br />
a small number of false detections. This process usually<br />
needs domain knowledge [8]. In clustering-based methods,<br />
outlier is defined to be observation that does not fit to the<br />
overall clustering pattern [15].<br />
In density-based methods, outlier is detected from local<br />
density of observations. These methods use different density<br />
estimation strategies. A low local density on the observation<br />
is an indication of a possible outlier. For example,<br />
Brito et al. [1] proposed a Mutual -<strong>Nearest</strong> Neighbor<br />
(MkNN) graph based approach. MkNN graph is a graph<br />
where an edge exists between vectors and if they both<br />
belong to each others k-neighbourhood. MkNN graph is<br />
undirected and is a special case of k-<strong>Nearest</strong> <strong>Neighbour</strong><br />
(kNN) graph, in which every node has pointers to its k nearest<br />
neighbours. Each connected component is considered as<br />
a cluster if, it contains more than one vector and an outlier,<br />
when connected component contains only one vector. Ramaswamy<br />
et al. [11] proposed a method, in which largest<br />
kNN distances are considered as outliers. This can be seen<br />
as “sparseness estimate” of a vector, in which the sparsest<br />
vectors are considered as outliers. We name the method<br />
RRS according to the original authors’ initials.<br />
In this paper, we propose two density-based outlier detection<br />
methods. In the first method, a vector is defined as<br />
an outlier if it participates in at most neighbourhoods in<br />
kNN graph, where threshold is a control parameter. To<br />
accomplish this we consider kNN graph as a directed proximity<br />
graph, where the vectors are vertices of the graph and<br />
edges are distances between the vectors. We classify a vector<br />
as outlier on basis of its indegree number in the graph.<br />
The second method, a modification of RRS, sorts all vectors<br />
by their average kNN distances, for which a global threshold<br />
is defined. Vectors with large average kNN -distance<br />
<br />
are all marked as outliers.
¥<br />
¥<br />
¥<br />
¥<br />
<br />
<br />
<br />
¥<br />
<br />
<br />
<br />
&<br />
2. <strong>Outlier</strong> <strong>Detection</strong> with kNN <strong>Graph</strong><br />
2.1. kNN <strong>Graph</strong><br />
We define -nearest neighbour (kNN) graph as a<br />
<br />
weighted directed graph, in which every vertex represents a<br />
single vector, and the edges correspond to pointers to neighbour<br />
vectors. Every vertex has exactly edges to the nearest<br />
vectors according to a given distance function. Weight<br />
¥<br />
of the edge is the distance <br />
between vectors and .<br />
The problem of creating kNN graph is known in computational<br />
all- geometry as -nearest neighbours problem [2].<br />
The graph can be constructed by exhaustive search considering<br />
all pairwise distances at the cost of time.<br />
Callahan and Kosaraju [2] have shown ¡£¢¥¤§¦©¨ that all-<br />
¤¤¤¨<br />
-nearest<br />
neighbour problem can be solved in time.<br />
The kNN graph can be used for solving clustering problem<br />
as in [3].<br />
¡£¢<br />
2.2. Detecting <strong>Outlier</strong>s with kNN <strong>Graph</strong><br />
The kNN graph can also be used for detecting outliers<br />
[1]. Mutual k-<strong>Nearest</strong> <strong>Neighbour</strong> (MkNN) uses a special<br />
case of kNN graph. It defines an undirected proximity<br />
graph, which has an edge between vertices and if kNN<br />
graph has an edge both from to and from to . Connected<br />
components form clusters in the data and connected<br />
component with just one vertex is defined as an outlier. Potential<br />
problem with this definition is that, an outlier that is<br />
too close to an inlier, can be missclassified. For example in<br />
Fig. 1, where 13 and 16 are neighbours of each other, and<br />
not outliers according to MkNN algorithm. Thus we need<br />
more flexibility in the outlier definition.<br />
the distance from a vector to ¥ its neighbour. <strong>Outlier</strong>s<br />
are defined as the last vectors in the ordered list. The<br />
intuitive idea is that when the distance to ¥ the vector is<br />
large, vector is in sparse region, and is very likely to be an<br />
outlier. A drawback of the RRS is that user has to know in<br />
advance how many outliers there are in the dataset.<br />
2.3. Proposed Methods<br />
We propose the following definition of outlier using kNN<br />
graph:<br />
Definition 1 Given kNN graph for dataset , outlier is a<br />
vertex, whose indegree is less than equal to . <br />
First, a kNN graph is created for datset . Then, if vertex<br />
has an indegree of or less, mark it as an outlier and<br />
<br />
otherwise mark it as an inlier. The proposed method has<br />
two control parameters: the number of outgoing edges<br />
and the indegree threshold .<br />
Algorithm 1 ODIN<br />
is indegree threshold<br />
Calculate kNN graph of<br />
for <br />
to do<br />
if indegree of ¥!<br />
then<br />
<br />
Mark as outlier<br />
end if<br />
end for<br />
Fig. 1 shows results of ODIN with indegree threshold<br />
#"<br />
set<br />
to applied on the dataset Hertzsprung-Russell [12]<br />
%$<br />
<br />
#&<br />
with and . The algorithm detects star 6 correctly<br />
as an ('<br />
outlier with , but star 13 is not<br />
<br />
detected<br />
6.5<br />
6<br />
5.5<br />
5<br />
4.5<br />
4<br />
33<br />
29<br />
19<br />
10<br />
6<br />
13<br />
13<br />
8 39<br />
35<br />
44<br />
115<br />
12<br />
4342<br />
4 0 32 37<br />
7 38<br />
9 3631<br />
24 41<br />
2<br />
45<br />
27<br />
23<br />
26 4025<br />
15<br />
46<br />
28 20 3022<br />
34<br />
14<br />
18 21 17<br />
16<br />
<strong>Outlier</strong><br />
Detected outlier k = 4<br />
Detected outlier k = 3<br />
with any <br />
value. However, when using threshold <br />
+*<br />
we detect stars 6 and 13 correctly as outliers.<br />
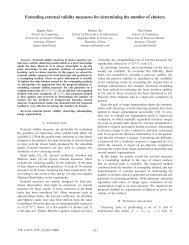
We extend the RRS method to specify cut point in the<br />
sorted list by considering adjacent differences as shown<br />
in Fig. 2. We consider two different variants of the RRS<br />
method, mean of kNN distances (MeanDIST) and maximun<br />
of kNN distances (KDIST). When scanning the ordered list<br />
from smaller to larger distances, we check if difference between<br />
adjancent distances is larger than a given threshold.<br />
We then define vectors after the cut point as outliers. We<br />
define the threshold as:<br />
)<br />
3.4 3.6 3.8 4 4.2 4.4 4.6 4.8 5<br />
(1)<br />
Figure 1. <strong>Outlier</strong>s in HR dataset detected with<br />
ODIN, with threshold T = 0<br />
Ramaswamy et al. [11] presented RRS method, which<br />
calculates kNN sparseness estimate for all vectors in dataset<br />
. Vectors are sorted in an ascending order according to<br />
where is the KDIST or MeanDIST of ¥ vector, and<br />
¥ 2 : ?> " 89
'<br />
<br />
Differences<br />
0.012<br />
0.01<br />
0.008<br />
0.006<br />
0.004<br />
0.002<br />
0<br />
5.9 5.92 5.94 5.96 5.98 6 6.02<br />
Vectors<br />
x 10 4<br />
Figure 2. Differencies of distances for KDD dataset<br />
Algorithm 2 MeanDIST<br />
Compute using Eq. 1 with 8<br />
Calculate kNN graph of <br />
2¡<br />
Sort vectors in ascending order by kNN density<br />
Find smallest for which 3 2 ¥45<br />
Mark as outliers<br />
¥<br />
¥ :£¢¤¢£¢ : 2¦¥ §¨¥ 2<br />
2 <br />
3. Experiments<br />
3.1. Description of Datasets<br />
Experiments were run on HR, KDD, NHL1, NHL2 and<br />
synthetic datasets, see Table 1. HR dataset in Fig. 1 is<br />
Hertzsprung-Russell diagram of the star cluster CYG OB1,<br />
where the first attribute is the logarithm effective temperature<br />
of the surface and the second the logarithm of light<br />
intensity.<br />
¤ ¢<br />
Table 1. Datasets used in the experiments<br />
Name<br />
<strong>Outlier</strong>s<br />
HR [12] 47 2 2<br />
KDD [9] 60318 3 486<br />
NHL1 [8] 681 3 2<br />
NHL2 [8] 731 3 1<br />
synthetic 5165 2 165<br />
KDD dataset was extracted from KDD Cup 1999 network<br />
intrusion dataset 1 . It was intended to be used as a<br />
training set for a supervised learning method. We follow<br />
the methodology described by Yaminishi et al. [14].<br />
NHL1 and NHL2 dataset were selected from National<br />
Hockey League 96 player performance statistics [8]. In<br />
dataset NHL1, we selected attributes games played, goals<br />
scored and shooting percentage, and in NHL2 dataset points<br />
scored, plus-minus statistics and the number of penalty minutes.<br />
In NHL1, Chris Osgood and Mario Lemieux have<br />
been considered as outliers and Vladimir Konstantinov in<br />
NHL2 [8].<br />
1 Original data can be found from (http://kdd.ics.uci.edu/).<br />
The synthetic dataset was made by generating cluster<br />
centers randomly so that they were not closer to each other<br />
than a predefined limit. Data points were then generated for<br />
each cluster with the limitation that points were not allowed<br />
to be farther than the given distance from the cluster center<br />
they belong to. We generated a GMM and using it computed<br />
minimum probability density for the points in data.<br />
<strong>Outlier</strong>s were sampled from uniform distribution so that the<br />
probability density according to the GMM was at most half<br />
of the minimum of that of the data points. This ensured that<br />
the outliers were not inside the clusters.<br />
3.2. Results<br />
We use Receiver Operating Characteristics (ROC) as<br />
an evaluation method. It consists of False Rejection (FR)<br />
and False Acceptance (FA) rates. FR is number of detected<br />
outliers divided by all detections and FA is number<br />
of inliers detected as outliers divided by all detections. To<br />
combine FR and FA values we calculate Half Total Error<br />
Rate (HTER), defined as (FR + FA) / 2. Similar evaluation<br />
methodology has been used in [10].<br />
HTER<br />
12<br />
11<br />
10<br />
9<br />
8<br />
7<br />
6<br />
5<br />
4<br />
3<br />
2<br />
Minimum error<br />
KDIST<br />
MeanDIST<br />
20 40 60 80 100<br />
k<br />
Figure 3. Error rate as a function of neighbourhood<br />
size for synthetic dataset<br />
Table 2 summarizes parameters that give minimum error<br />
rate for each algorithm. HTER is used as the error rate<br />
and the values in the parenthesis are and . ODIN performs<br />
well on all datasets, but for synthetic dataset Mean-<br />
DIST and KDIST perform better. Good performance can be<br />
explained by the generation method of data: outliers were<br />
drawn from uniform distribution and made sure that they lie<br />
far enough from normally distributed clusters. On the other<br />
hand, results for KDD dataset show that ODIN, MeanDIST<br />
and KDIST achieve practically the same error rate. For<br />
HR, NHL1 and NHL2 datasets ODIN achieves zero error,<br />
whereas other methods perform considerably worse. Reason<br />
for large HTER values is that given a small number of<br />
outliers even a few false acceptances increases the error rate<br />
greatly.<br />
In Fig. 3, HTER is shown as a function of neighbourhood<br />
size for synthetic dataset. MeanDIST achieves lowest error
Table 2. Summary of results as error rate (k, threshold)<br />
Method synthetic KDD HR NHL1 NHL2<br />
MkNN [1] 50.0 (13) 77.0 (1) 25.0 (5) 25.0 (29) 44.4 (28)<br />
ODIN 9.0 (190,26) 49.6 (1,2) 0.0 (7, 1) 0.0 (87, 9) 0.0 (36, 2)<br />
MeanDIST 4.9 (21, 0.05) 49.6 (232, 0.19) 30.0 (1, 0.15) 16.7 (20, 0.05) 43.8 (1, 0.57)<br />
KDIST [11] 5.7 (12, 0.06) 48.6 (72, 0.40) 30.0 (1, 0.15) 30.0 (1, 0.02) 41.7 (7, 0.75)<br />
and in general has lower error rate than KDIST for synthetic<br />
data.<br />
HTER<br />
100<br />
75<br />
50<br />
120<br />
100<br />
k<br />
80<br />
60<br />
40<br />
20<br />
0<br />
0<br />
0.1<br />
0.2<br />
Threshold<br />
Figure 4. Error rate as a function of k and threshold<br />
for KDD dataset<br />
Table 2 shows that optimal parameters for each dataset<br />
vary greatly, this leads to a problem of how to find the optimal<br />
parameter combiunation in the 2d parameter space. On<br />
the other hand, Fig. 4 shows the error rate as a function of<br />
and for MeanDIST with the KDD dataset. We can see<br />
<br />
that when is below 0.1, the selection of the neighbourhood<br />
degree is not critical. The problem of how to find<br />
the correct parameters is then just finding the best .<br />
4. Conclusions<br />
We proposed a graph based outlier detection algorithm,<br />
which works well for the tested data sets. While MeanDIST<br />
and KDIST outperform the ODIN with the synthetic data,<br />
they give worse results for real data sets. This may be due<br />
to the small size of the data sets, in which case the density<br />
based methods may not obtain a reliable estimate. The proposed<br />
variant of RRS (MeanDIST) performs much better<br />
than KDIST with one dataset while the differences between<br />
the two are small in other cases.<br />
References<br />
[1] M. R. Brito, E. L. Chávez, A. J. Quiroz, and J. E. Yukich.<br />
Connectivity of the mutual -nearest-neighbor graph in clustering<br />
and outlier detection. Statistics & Probability Letters,<br />
35(1):33–42, August 1997.<br />
0.3<br />
0.4<br />
[2] P. B. Callahan and S. R. Kosaraju. A decomposition of<br />
multidimensional point sets with applications to k-nearestneighbors<br />
and n-body potential fields. Journal of the Association<br />
for Computing Machinery, 42(1):67–90, 1995.<br />
[3] P. Fr änti, O. Virmajoki, and V. Hautam äki. <strong>Graph</strong>-based agglomerative<br />
clustering. In Proceedings of The Third IEEE<br />
Int. Conf. on Data Mining, pages 525–528, Melbourne,<br />
Florida, November 2003.<br />
[4] D. Freedman, R. Purves, and R. Pisani. Statistics. W.W.<br />
Norton, New York, 1978.<br />
[5] S. Guha, R. Rastogi, and K. Shim. CURE an efficient clustering<br />
algorithm for large databases. In Proceedings of the<br />
1998 ACM SIGMOD Int. Conf. on Management of Data,<br />
pages 73–84, Seattle, Washington, June 1998.<br />
[6] D. M. Hawkins. Identification of <strong>Outlier</strong>s. Chapman and<br />
Hall, London, 1980.<br />
[7] W. Jin, A. K. H. Tung, and J. Han. Finding top-n local<br />
outliers in large database. In 7th ACM SIGKDD Int. Conf.<br />
on Knowledge Discovery and Data Mining, pages 293–298,<br />
2001.<br />
[8] E. M. Knorr and R. T. Ng. Algorithms for mining distancebased<br />
outliers in large datasets. In Proceedings 24th Int.<br />
Conf. Very Large Data Bases, pages 392–403, New York,<br />
USA, 1998.<br />
[9] W. Lee, S. J. Stolfo, and K. W. Mok. A data mining framework<br />
for building intrusion detection models. In IEEE Symposium<br />
on Security and Privacy, pages 120–132, May 1999.<br />
[10] J. Liu and P. Gader. <strong>Outlier</strong> rejection with mlps and variants<br />
of RBF networks. In Proceedings of The 15th Int. Conf. on<br />
Pattern Recognition, pages 680–683, 2000.<br />
[11] S. Ramaswamy, R. Rastogi, and K. Shim. Efficient algorithms<br />
for mining outliers from large data sets. In Proceedings<br />
of the 2000 ACM SIGMOD Int. Conf. on Management<br />
of Data, pages 427–438, Dallas, Texas, May 2000.<br />
[12] P. J. Rousseeuw and A. M. Leroy. Robust Regression and<br />
<strong>Outlier</strong> <strong>Detection</strong>. John Wiley and Sons, New York, October<br />
1987.<br />
[13] G. Williams, R. Baxter, H. He, S. Hawkings, and L. Gu.<br />
A comparative study of RNN for outlier detection in data<br />
mining. In Proceedings of the 2nd IEEE Int. Conf. on Data<br />
Mining, Maebashi City, Japan, December 2002.<br />
[14] K. Yamanishi, J. Takeuchi, G. Williams, and P. Milne. Online<br />
unsupervised outlier detection using finite mixtures with<br />
discounting learning algorithm. In Proceedings The Sixth<br />
ACM SIGKDD Int. Conf. on Knowledge Discovery and Data<br />
Mining, pages 320–324, August 2000.<br />
[15] T. Zhang, R. Ramakrishnan, and M. Livny. BIRCH: A new<br />
data clustering algorithm and its applications. Data Mining<br />
and Knowledge Discovery, 1(2):141–182, 1997.