Multivariate Calculus - Bruce E. Shapiro
Multivariate Calculus - Bruce E. Shapiro
Multivariate Calculus - Bruce E. Shapiro

You also want an ePaper? Increase the reach of your titles
YUMPU automatically turns print PDFs into web optimized ePapers that Google loves.
LECTURE 8. FUNCTIONS OF TWO VARIABLES 55<br />
described by the equation<br />
z = xye −(x2 +y 2 )<br />
It can be represented by a surface something like the one illustrated in figure 8.2.<br />
In addition to the surface plant, another useful tool is the contour plot, illustrated<br />
in the fight-hand illustration of figure 8.2. If we take a surface plot and slice it<br />
along planes parallel to the xy plane we will obtain a series of sections that can be<br />
represented by curves in the xy plane. Each curve, called a countour, represents a<br />
particular slice, or height, above the xy plane. Countour plots are commonly used<br />
by geographers, for example, to draw topographic (e.g., figure 8.3) or weather maps<br />
( see figure 8.4), among other things. Each curve in a contour plot is called a level<br />
curve.<br />
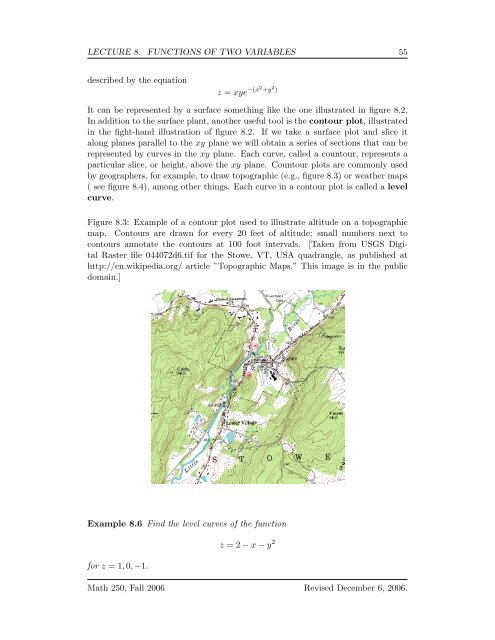
Figure 8.3: Example of a contour plot used to illustrate altitude on a topographic<br />
map. Contours are drawn for every 20 feet of altitude; small numbers next to<br />
contours annotate the contours at 100 foot intervals. [Taken from USGS Digital<br />
Raster file 044072d6.tif for the Stowe, VT, USA quadrangle, as published at<br />
http://en.wikipedia.org/ article ”Topographic Maps.” This image is in the public<br />
domain.]<br />
Example 8.6 Find the level curves of the function<br />
z = 2 − x − y 2<br />
for z = 1, 0, −1.<br />
Math 250, Fall 2006 Revised December 6, 2006.