st grd osmosis & Diffusion homework.pdf
st grd osmosis & Diffusion homework.pdf st grd osmosis & Diffusion homework.pdf
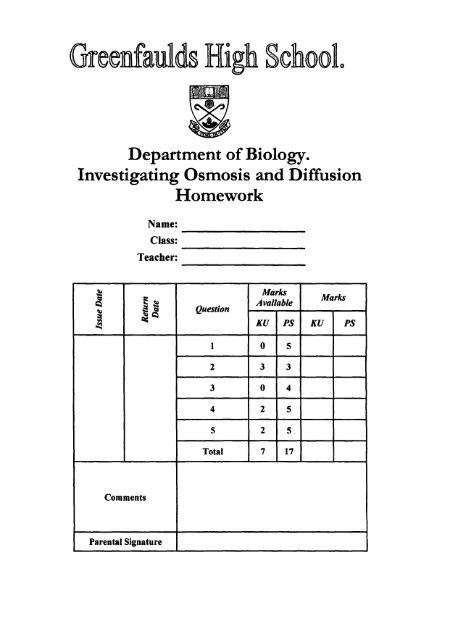
Greenfaulds High School. Department ofBiology. Investigating Osmosis and Diffusion Homework Name: Class: Teacher: -------- -------- e ~ Marks Marks Available ~ l:::l \\) Question a ~~ ~ xu PS xu PS ~ 1 0 5 2 3 3 3 0 4 4 2 5 5 2 5 Total 7 17 Comments Parental Signature
- Page 2 and 3: Standard Grade Biology Sub-topic 2
- Page 4 and 5: Standard Grade Biology Sub-topic 2
- Page 6 and 7: Standard Grade Biology Sub-topic 2
- Page 8 and 9: Standard Grade Biology Sub-topic 2
Greenfaulds High School.<br />
Department ofBiology.<br />
Inve<strong>st</strong>igating Osmosis and <strong>Diffusion</strong><br />
Homework<br />
Name:<br />
Class:<br />
Teacher:<br />
--------<br />
--------<br />
e ~<br />
Marks<br />
Marks<br />
Available<br />
~<br />
l:::l<br />
\\)<br />
Que<strong>st</strong>ion<br />
a ~~<br />
~<br />
xu PS xu PS<br />
~<br />
1 0 5<br />
2 3 3<br />
3 0 4<br />
4 2 5<br />
5 2 5<br />
Total 7 17<br />
Comments<br />
Parental Signature
Standard Grade Biology Sub-topic 2 Osmosis Greenfaulds High School KU PS<br />
1. A group ofpupils was asked to inve<strong>st</strong>igate the effect of<strong>osmosis</strong> on the diameter 0 discs of<br />
potato tissue.<br />
The procedure followed is outlined below:<br />
1. A large diameter cork borer was used to cut a cylinder oftissue from a peeled potato.<br />
2. Five discs, each 2mm thick, were cut from the cylinder.<br />
3. Four discs were transferred to separate Petri dishes.<br />
4. The diameter ofeach disc was measured from graph paper placed underneath the dish.<br />
5. 20 cm 3 ofglucose solution, ofdifferent concentrations, was poured into each ofthree<br />
dishes. 20 cm 3 ofwater was poured into a fourth dish.<br />
6. The apparatus was left for 30 minutes and the diameter ofeach disc was re-measured.<br />
Diagram 1 below shows the apparatus and Diagram 2 shows how the diameter ofa disc was<br />
measured<br />
DIAGRAM 1 - SIDE VIEW<br />
DIAGRAM 2 - TOP VIEW<br />
Glucose solution<br />
Petri dish~'"'*.<br />
Potato disc<br />
The results are shown in the table below.<br />
Solution Concentration oj Ditlf'Mter oj disc (mm)<br />
glucosf: solution<br />
At <strong>st</strong>art<br />
After 30 minutes<br />
A 0·0% 14·0 16·2<br />
B 0·5% 14·0 15·4<br />
C 1·0% 14·0 14·0<br />
0 1'5% 14·0 12·6<br />
(a) Identify the variable which was altered and two variables which were kept con<strong>st</strong>ant in<br />
the inve<strong>st</strong>igation.<br />
Altered variable<br />
Variables kept Con<strong>st</strong>ant 1.<br />
-------------------<br />
2.:- _<br />
(1)<br />
Page 2 of9
Standard Grade Biology Sub-topic 2 Osmosis Greenfaulds High School<br />
(b) Identify the solution which has a water concentration higher than that present in the<br />
potato tissue.<br />
KU<br />
PS<br />
Solution<br />
(1)<br />
(c) The fifth disc, ofinitial diameter 14.0 mm, was placed in a solution ofunknown<br />
glucose concentration.<br />
The diagram below shows the size ofthis disc after 30 minutes.<br />
'ri"<br />
DISC<br />
~<br />
- 10mm<br />
(i) Calculate the change in diameter ofthis disc.<br />
Space for calculation<br />
Change in diameter _____mm (1)<br />
(ii) The concentration ofthe unknown glucose solution lies within one ofthe following<br />
concentration ranges.<br />
Tick the correct box.<br />
0%-0.5%<br />
0.5%-1.0%<br />
1.0% - 1.5%<br />
1.5%- 2.0%<br />
D<br />
D<br />
DD<br />
(d) Water can enter or leave the discs by <strong>osmosis</strong>.<br />
Describe the overall movement ofwater for the discs immersed in the t -0%<br />
glucose solution.<br />
(1)<br />
______________________(1)<br />
Page 3 0(9
Standard Grade Biology Sub-topic 2 Osmosis Greenfaulds High School<br />
---------""'---------"--------------=-------IKU PS<br />
2. (a) The <strong>st</strong>atements in the table describe the movement ofsub<strong>st</strong>ances into or out ofcells.<br />
Number<br />
J<br />
Statement<br />
glucose moves from the small inte<strong>st</strong>ine into the blood<br />
2 water enters root cells from the soil<br />
3 carbon dioxide passes from the blood into the lungs<br />
(i) Which <strong>st</strong>atement is an example of<strong>osmosis</strong>?<br />
Statement number -----<br />
(ii) What term could be used to describe the movement ofsub<strong>st</strong>ances in all ofthe<br />
examples?<br />
(1)<br />
(b) Pieces ofpotato were weighed, placed in sugar solutions ofdifferent concentrations for<br />
one hour, then reweighed. The graph below shows the percentage change in mass at each<br />
(1)<br />
Gain<br />
30<br />
20<br />
Percentage<br />
change in<br />
mass<br />
10<br />
Sugar concentration<br />
(Molar)<br />
0·1 0·2 0·3 0·+ 0·5<br />
10<br />
20<br />
Loss<br />
30<br />
40<br />
(i) The movement ofwhat sub<strong>st</strong>ance is responsible for the change in mass?<br />
(1)<br />
Page 4 of9
_~_~~ ._<br />
Standard Grade Biology Sub-topic 2 Osmosis Greenfaulds High School<br />
(ii) What was the percentage change in mass of the piece of potato placed in the 0.15<br />
Molar solution<br />
~ (1)<br />
-------.;.<br />
(iii) What was the concentration ofthe solution which caused the potato to lose 30~ of<br />
its original mass?<br />
_____Molar<br />
(iv) At what concentration was there no change in mass ofthe potato?<br />
----- Molar<br />
(1)<br />
3. Several pieces ofpotato were blotted dry and weighed. Each was then placed in a different<br />
concentration ofsalt solution.<br />
After 2 hours the pieces ofpotato were removed, blotted dry and reweighed. The percentage<br />
change in mass was calculated and the results plotted on a graph.<br />
30 ~--..-------,.---r---..-------r--...,<br />
(1)<br />
KU<br />
PS<br />
Percentage<br />
change in mass<br />
._a.' 'j ...: __ • __ .~ _ .• _- ....' "••• ,•• ~ •• _ •• _<br />
-20-+--.-J--I----+---+----f-.........-+--~<br />
_.. - ~ ... -.-<br />
- -~ .... . - ~.. ,-' - .... _.<br />
_. __• ...! ~_I-- ........ -- -' _ ...... _0_1-. _ _ _ _ -- __ ~ .... ':'"' _ _ __--<br />
.... _ -_....l __•__._ •• __ ._._._~ __<br />
- - -,- _. - - _.- -- -..;. - - - - _. --- "" - - - - - - -<br />
-30-1---+----;---+---1-.....;.-.-4----1<br />
o 2 4 6 8 10 12<br />
Salt concentration (gil 00 em 3 )<br />
(a) At which salt concentration did the mass ofthe potato remain the same?<br />
g/100 cm 3<br />
------=-<br />
(1)<br />
(b) State the percentage change in mass ofthe potato at a salt concentration of 7 gllOO cm 3<br />
after two hours.<br />
(1)<br />
Page S of9
Standard Grade Biology Sub-topic 2 Osmosis Greenfaulds High School KU PS<br />
(c) Predict the salt concentration that will produce a 30% decrease in mass.<br />
(1)<br />
(d) Cells from the potato in the 8 gllOO cm 3 solution were examined with a microscope.<br />
Which ofthe following diagrams be<strong>st</strong> represents one cell from the potato?<br />
Tick the correct box.<br />
4. Potato cylinders ofequal mass were placed in separate te<strong>st</strong> tubes, as shown in the diagram.<br />
salt<br />
solution<br />
++__ potato cylinder<br />
The tubes contained salt solutions of0.5%, 1.0%, 1.5%,2.0% and 3.0% concentrations.<br />
After two hours the change in mass ofeach cylinder was measured. The results are shown in<br />
the table.<br />
Tube<br />
Change in mass<br />
A -0.6<br />
B -0.5<br />
Salt solution<br />
(g) (0/0)<br />
C -0.2 1.5<br />
D +0.1<br />
E +0.2<br />
(a) Complete the table by adding the correct concentration ofthe salt solution in each tube.<br />
(1)<br />
(b) Which tube contained a solution with a water concentration close<strong>st</strong> to that ofthe potato<br />
cell sap?<br />
Tube<br />
(1)<br />
------<br />
Page 6 of9
Standard Grade Biology Sub-topic 2 Osmosis Greenfaulds High School KU PS<br />
(c) The original mass ofeach potato cylinder was 5 g.<br />
Calculate the percentage change in mass for the cylinder in tube D.<br />
Spacefor calculation<br />
-----% (1)<br />
(d) Underline one alternative in each bracket to explain the results for Tube C.<br />
Water mo\"ed<br />
{<br />
into }<br />
out of<br />
the potato by <strong>osmosis</strong> from a higher water<br />
concentration {inSide } the potato to a lower water concentration<br />
outside<br />
{<br />
insid.e Ithe potato.<br />
outsIde<br />
(e) Why would it be good experimental technique to blot the potato cylinders dry before<br />
each weighing?<br />
(2)<br />
-----------------------,(1)<br />
(t) How could the results ofthe experiment be made more reliable?<br />
______________________(1)<br />
Page 7 of9
Standard Grade Biology Sub-topic 2 Osmosis Greenfaulds High School KU PS<br />
5. In an experiment, a cylinder ofpotato (cylinder A) was kept in pure water for one hour. An<br />
identical piece ofpotato (cylinder B) was kept in a 10% salt solution for one hour.<br />
(a) Describe the difference you would expect to observe between the potato cylinders when<br />
removed from the liquids.<br />
(b) The diagram below shows cells from the potato cylinder which had been in the 10% salt<br />
solution.<br />
(1)<br />
Cells from potato in 10% salt solution<br />
Explain what has happened to the cell, in tenns ofwater concentrations.<br />
(1)<br />
(c) In another experiment, some <strong>st</strong>rips ofskin from red onions were placed on microscope<br />
slides in sucrose solutions ofvarious concentrations. After IS minutes, the number of<br />
cells with shrunken contents (plasmolysed) was counted.<br />
The results are shown in the table.<br />
Slide A B C D E<br />
Sucrose concentration<br />
(g/litre)<br />
0 40 80 120 160<br />
Total cell number 127 132 117 125 139<br />
Number plasmolysed 0 II 68 139<br />
% plasmolysed 0 8.3 58.1 80 100<br />
(i) Complete the table by calculating the missing value for the number ofcells<br />
plasmolysed in the 120 g/litre sucrose solution.<br />
Space for calculation<br />
(1)<br />
PageS of9
Standard Grade Biology Sub-topic 2 Osmosis Greenfaulds High School KU PS<br />
(ii) Why was it necessary to present the results ofthe inve<strong>st</strong>igation as a percentage?<br />
-----------------------(1)<br />
(iii) Describe the relationship between the concentration ofsucrose solution and the<br />
percentage ofcells plasmolysed.<br />
______________________(1)<br />
(iv) Which solution has the highe<strong>st</strong> water concentration?<br />
----------------------(1)<br />
(v) Explain why the cells were left for I 5 minutes before examining them.<br />
(1)<br />
Page 9 of9


