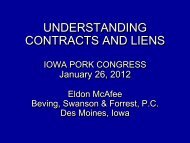
Using Vegetative Environmental Buffers for Odor Mitigation
Using Vegetative Environmental Buffers for Odor Mitigation
Using Vegetative Environmental Buffers for Odor Mitigation

Create successful ePaper yourself
Turn your PDF publications into a flip-book with our unique Google optimized e-Paper software.
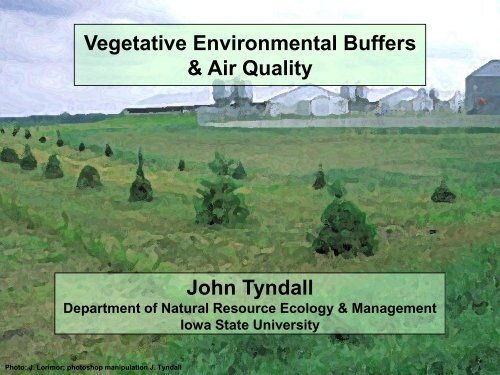
<strong>Vegetative</strong> <strong>Environmental</strong> <strong>Buffers</strong><br />
& Air Quality<br />
John Tyndall<br />
Department of Natural Resource Ecology & Management<br />
Iowa State University<br />
Photo: J. Lorimor; photoshop manipulation J. Tyndall
Presentation Outline<br />
• <strong>Odor</strong> and odor mitigation<br />
• VEB and odor dynamics<br />
• VEB design issues<br />
• Research brief<br />
• Questions…
Common Pollutants<br />
• <strong>Odor</strong> (VOC’s)<br />
• Dust (PM)<br />
• Ammonia (NH 3 )<br />
• Hydrogen sulfide<br />
(H 2 S)<br />
Image: R. Burns, ISU
Primary Emission Sources<br />
• Livestock buildings and lots<br />
• Manure and wastewater storage facilities<br />
• Land application<br />
Photos: R. Burns, ISU
Air Pollution Control Points<br />
<strong>Odor</strong>, Dust, and Chemical Compounds<br />
• Prevent generation<br />
• Capture or destroy<br />
be<strong>for</strong>e releasing to<br />
the atmosphere<br />
• Disperse to reduce<br />
impact<br />
3,000 + Head Finishing Facility<br />
Central, Iowa
Possible Approaches To <strong>Odor</strong><br />
Problems<br />
• Manure Storage Covers<br />
• Manure Composting<br />
• Manure Additives<br />
• Manure Injection<br />
• Application Timing<br />
• Aeration<br />
• Anaerobic Digestion<br />
• Genetic Engineering?<br />
Photo: R. Burns, ISU
Possible Approaches To <strong>Odor</strong><br />
Problems<br />
• Bio-filtration<br />
• Diet Manipulation<br />
• Oil Sprinkling<br />
• Solids Separation<br />
• Air Filtration<br />
• Barriers<br />
• Landscaping<br />
Single Row, 8 yr old Austree<br />
VEB, Eastern IA<br />
Photo: J. Love, ISU
Goals of <strong>Vegetative</strong> <strong>Environmental</strong> Buffer<br />
1.Visual screen<br />
2.<strong>Vegetative</strong> filter<br />
3.Windbreak +<br />
Shade
<strong>Odor</strong> / VEB Dynamics<br />
<strong>Odor</strong><br />
• Ground level emissions<br />
• Limited plume rise<br />
• Spatial & temporal<br />
variability<br />
• Particulates & <strong>Odor</strong><br />
VEB’s (15’ +)<br />
• Dilution<br />
• Particulate Interception<br />
• Deposition<br />
• Aesthetics<br />
Photo: J. Tyndall<br />
Single row, 8 yr old Austree Willow<br />
<strong>Odor</strong> Buffer, Winterset, IA
Unabated <strong>Odor</strong> Plumes (Particulates)<br />
Prevailing winds<br />
Naturally Ventilated<br />
Swine Barn<br />
Computer simulation by Lammers et al., 2001
Simulation of <strong>Odor</strong> Dilution Process<br />
Prevailing Winds<br />
H<br />
Adapted Computer from Raine simulation (1974) by as Lammers used in McNaughton et al., 2001 (1988)<br />
Note: Overlay not to scale
Physical Interception of Dust<br />
• ≈ 90 % of odor particles are in the size range best<br />
captured by trees<br />
• <strong>Odor</strong> particles are irregular in shape = better <strong>for</strong><br />
retention on tree surfaces<br />
• The whole above ground part of tree acts as<br />
surface area <strong>for</strong> filtration<br />
• Precipitation can wash tree surfaces clean<br />
poultry building ventilation<br />
dust on W. Cedar<br />
Photo: J. Tyndall
Aesthetics & <strong>Odor</strong> Perception<br />
Studies have shown that :<br />
As farm “attractiveness” <br />
odor offensiveness <br />
Out of sight out of mind:<br />
Softening visual cues<br />
Photos: J. Lorimor (ISU)
Iowa:<br />
Aesthetic Focus Group Findings:<br />
Iowa Pork Consumers Summer 2004<br />
• High preferences <strong>for</strong> more trees in Iowa<br />
landscape.<br />
• High agreement that shelterbelts improve<br />
aesthetics of confinement production.<br />
• High appreciation <strong>for</strong> “visual” response to<br />
odor issues.
Building, Planned Year 10 5 Facility Year - 15 1 planting Site<br />
• (3-4 year old Red Cedar Stock)<br />
Simulations courtesy of B. Malone, U of Delaware
Other Benefits of VEB’s<br />
• Size Neutral - Large or small producers<br />
• Can help with all sources of odor<br />
• Comparatively very inexpensive.<br />
• In theory – increased effectiveness over time<br />
Photo: TS<br />
USDA
<strong>Odor</strong> <strong>Mitigation</strong> = incremental reductions in odor<br />
Research suggests VEB’s ≈ 6% - 10% ↓ in odor<br />
• “suite” of odor management strategies<br />
FIDO factor reduction<br />
enhancing the<br />
separation distance<br />
Photo: G. Wyatt,<br />
U. of Mn. Extension
Planting Design<br />
Issues
Main summer wind filter zone and winter windbreak<br />
Min 250’<br />
Natural Ventilation<br />
Snow deposition<br />
area<br />
Hog Building<br />
Pit vents<br />
Access road<br />
• Goals of producer<br />
• Functional Zones<br />
• Create no hazards<br />
Minimum of 10 H<br />
between tree row<br />
and building<br />
N<br />
N<br />
Wider spacing between trees (25’ +)<br />
Not to scale<br />
June – Aug Nov – Feb<br />
wind rose <strong>for</strong><br />
Central Iowa
Snow Deposition zone – min 150’<br />
Min 10 x diameter of fans<br />
Tunnel Ventilation<br />
Main Highway<br />
Pit<br />
Vents<br />
Tunnel<br />
Vents<br />
Concrete<br />
Manure Store<br />
100’x15’<br />
• Goals of producer<br />
• Functional Zones<br />
• Create no hazards<br />
100’x15’<br />
N<br />
N<br />
Access Road<br />
Minimum of 10 H<br />
between tree row<br />
and building<br />
Not to scale<br />
June – Aug Nov – Feb<br />
wind rose <strong>for</strong><br />
Central Iowa
Some visual screening from B.Woods Rd N – might cause snow probs<br />
N<br />
1<br />
≈40’ b/w row & building<br />
E. Wind<br />
block<br />
2<br />
Visual<br />
screening<br />
3<br />
≈ 155’ from access rd<br />
≈ 60’ b/w rows<br />
≈ 55’ from access rd<br />
Artificial wind screen can be within about 5-10<br />
times diameter of vent fan without back<br />
pressure.<br />
Winter Snow deposition<br />
Zone & Summer odor filter<br />
= Austree Willow<br />
= E. Red Cedar<br />
= Red Osier Dogwood<br />
5<br />
≈ 55’<br />
from rd.<br />
4<br />
This row is about 8 – 9 H; if summer wind is<br />
needed move back 80 – 100ft
Row Silver closest Maple: to building Near-by - market. Austree High Willow Demand - Visual = Screen; High Stumpage Life span Rates 15-20 years.<br />
Outside 15 - 20 row year – Concolor rotation - or $2,500 Norway - $3,200. Spruce 20 – 30’ in 20 years<br />
20-35’<br />
100’ – 150’
Proper site prep will:<br />
• Tree Mortality<br />
• Tree Growth (upwards of 70%)<br />
• Ultimately time, $, and ef<strong>for</strong>t.<br />
• 1 Yr Be<strong>for</strong>e:<br />
– 4’ Kill strip (e.g. Round Up)<br />
– Disk/cultivate (work soil to 8” depth)<br />
• Yr 1 (Spring – late April/Early May)<br />
– Disk/ cultivate again & if possible rototill<br />
– Soil should have no clumps & minimal residue
www.agr.gc.ca/pfra/ shelterbelt/shbpub13.htm<br />
Tree Care Options: Drip Irrigation<br />
Tree<br />
10 – 12”
Mulching<br />
Source: www.hort.cornell.edu
Weed Control Demo
Economics: Cost Details<br />
• Examining upfront costs <strong>for</strong> site prep, planting<br />
stock, planting & maintenance costs over time:<br />
– Low Cost scenario (≈$0.75/tree) over 20 years:<br />
• Seedling stock ≈ $0.03/pig produced<br />
– High Cost scenario (≈$11/tree) over 20 years:<br />
• Larger (5-6 year old) tree stock ≈ $0.33/pig produced<br />
• With extensive drip irrigation add ≈ $0.008/pig
Current ISU Research<br />
• Field <strong>Odor</strong> Reduction studies:<br />
– Bio-physical & Socio - Economic<br />
• Multi-departmental: Nat Res, Ag Syst<br />
Bio-engineering, Sociology, Animal<br />
Science<br />
• Partners: Penn State University and the<br />
University of Delaware
“Be<strong>for</strong>e & After” VEB Field Study<br />
25’<br />
N<br />
R. Cedar<br />
Willow<br />
Air samples:<br />
• <strong>Odor</strong><br />
• Ammonia<br />
• PM 10<br />
• PM2.5<br />
Mobile Emissions Lab
Sparboe Pullet Facility, Eagle Grove, IA - 2005<br />
Photo: J. Love, ISU
What's next research-wise?<br />
1)National Pork Board funded –More field and wind<br />
tunnel studies with USDA ARS –NTL<br />
2) Expand research to other species: Beef, Dairy<br />
3) More Extension programming…<br />
A<br />
Previous Wind Tunnel Conclusions -<br />
Up to a 56 % reduction in off-farm dust movement<br />
ISU – Laird and Thernelius, 1997<br />
B
VEB Summary<br />
• Biophysical & Social quantification – “incremental”<br />
– More research on the way<br />
• Relatively inexpensive – but it is an expense…<br />
– Cost-share programming may become important<br />
• Fastest growing application<br />
of shelterbelts<br />
• More info becoming<br />
available from ISU
8 Year old Austree Willow<br />
Thank You <strong>for</strong> your time!<br />
Are there any questions?
Contact Info:<br />
Dr. John Tyndall<br />
Phone: 515.294.4912<br />
jtyndall@iastate.edu
Lin et al, 2006
Lin et al, 2006
55% Optical<br />
Porosity<br />
35% Optical<br />
Porosity<br />
Lin et al, 2006
Dollars ($) ($) per per head<br />
VEB Economics<br />
Shelterbelt Cost vs. <strong>Odor</strong> Mgt Expenditures<br />
High Price Scenarios<br />
Seedling Price Scenarios<br />
0.8<br />
0.7<br />
0.6<br />
$ $ 0.69<br />
0.69<br />
0.5<br />
Expenditures<br />
0.4<br />
0.3<br />
0.2<br />
$<br />
$<br />
0.24<br />
0.24<br />
$ 0.24<br />
$ $ 0.37<br />
W/out EQIP<br />
EQIP<br />
0.1<br />
0<br />
Farm A -<br />
Farm B -<br />
Farm C - -<br />
Farm D D - -<br />
10,500 Head<br />
2,025 Head<br />
1,600 Head<br />
1,000 Head<br />
Data: Tyndall, 2007 and USDA, 1996
Willingness to Pay<br />
(cents per head)<br />
Iowa Pork Producer Demand Curve <strong>for</strong> VEB’s<br />
Based on 2005 Iowa<br />
Pork Producer<br />
Survey Data:<br />
75% of Iowa’s<br />
Producers are<br />
Willing To Pay <strong>for</strong><br />
VEB’s<br />
120<br />
100<br />
80<br />
13%<br />
60%<br />
25% of Iowa’s<br />
Producers<br />
WTP = 0<br />
60<br />
40<br />
20<br />
VEB Costs $0.33/ Head<br />
VEB Costs $0.03/ Head<br />
0<br />
3<br />
8<br />
17<br />
36<br />
53<br />
70<br />
74<br />
100<br />
Data: Tyndall, 2007<br />
Percent of Producers
Missouri NRCS Publication<br />
EQIP being used to a high<br />
degree <strong>for</strong> VEB’s<br />
• Our work here at<br />
ISU is the primary<br />
reference.