Oxygen delignification kinetics: CSTR and batch reactor comparison
Oxygen delignification kinetics: CSTR and batch reactor comparison
Oxygen delignification kinetics: CSTR and batch reactor comparison

Create successful ePaper yourself
Turn your PDF publications into a flip-book with our unique Google optimized e-Paper software.
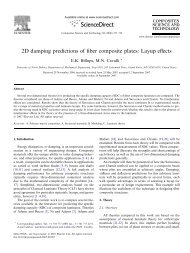
REACTORS, KINETICS, AND CATALYSIS<br />
<strong>Oxygen</strong> Delignification Kinetics: <strong>CSTR</strong><br />
<strong>and</strong> Batch Reactor Comparison<br />
Yun Ji, M. Clayton Wheeler, <strong>and</strong> Adriaan van Heiningen<br />
Dept. of Chemical Engineering, University of Maine, Orono, ME 04469<br />
DOI 10.1002/aic.11277<br />
Published online August 24, 2007 in Wiley InterScience (www.interscience.wiley.com).<br />
In the past, oxygen <strong>delignification</strong> studies were mostly performed in <strong>batch</strong> <strong>reactor</strong>s,<br />
whereby the caustic <strong>and</strong> dissolved oxygen concentrations are changing during the reaction.<br />
Also the lignin content <strong>and</strong> cellulose degradation of the pulp are only established at<br />
the end of an experiment when the sample is removed from the <strong>reactor</strong>. To overcome these<br />
deficiencies, a differential <strong>reactor</strong> system (called Berty <strong>reactor</strong>) has been adopted. In this<br />
continuous stirred-tank <strong>reactor</strong> (<strong>CSTR</strong>), the dissolved oxygen concentration <strong>and</strong> the<br />
alkali concentration in the feed are kept constant, <strong>and</strong> the rate of lignin removal is<br />
determined from the dissolved lignin concentration in the outflow stream measured<br />
by UV–vis spectroscopy. The <strong>delignification</strong> rate is found to be first-order in HexA-free residual<br />
lignin content. The <strong>delignification</strong> rate reaction order in [NaOH] <strong>and</strong> oxygen pressure<br />
are 0.412 6 0.060 <strong>and</strong> 0.305 6 0.260 respectively. The activation energy is 54.5 6<br />
6.8 kJ/mol. Ó 2007 American Institute of Chemical Engineers AIChE J, 53: 2681–2687, 2007<br />
Keywords: oxygen <strong>delignification</strong>, <strong>kinetics</strong>, model<br />
Introduction<br />
Correspondence concerning this article should be addressed to Y. Ji at jiyunserd@<br />
yahoo.com.<br />
Ó 2007 American Institute of Chemical Engineers<br />
<strong>Oxygen</strong> <strong>delignification</strong> is widely used for lignin removal<br />
before bleaching pulp. The well known advantages of oxygen<br />
<strong>delignification</strong> over extended cooking are chemical cost savings,<br />
yield retention <strong>and</strong> improved environmental. 1 Since oxygen<br />
<strong>delignification</strong> is accompanied by undesirable cellulose<br />
degradation, better underst<strong>and</strong>ing of oxygen <strong>delignification</strong><br />
<strong>kinetics</strong> <strong>and</strong> its relation to cellulose degradation may point to<br />
improved operation in industrial practice. Therefore, a kinetic<br />
study of oxygen <strong>delignification</strong> should include the <strong>kinetics</strong> of<br />
both <strong>delignification</strong> <strong>and</strong> cellulose degradation. Normally,<br />
<strong>delignification</strong> is measured by the decrease of Kappa number,<br />
which is an indirect method to measure lignin content of pulps.<br />
Cellulose degradation is monitored by the decrease in intrinsic<br />
viscosity [g] of pulps. However, it is now well known that the<br />
kappa number does not correctly represent the amount of residual<br />
lignin in the pulp, since hexenuronic acid (HexA) <strong>and</strong> other<br />
nonlignin structures also consume KMnO 4 in the kappa number<br />
measurement. 2 In this study, the HexA content was considered<br />
in the reaction modeling. A new <strong>and</strong> significant aspect of<br />
this approach is that the experimental technique allows determination<br />
of the reaction rate dependence on lignin content in<br />
the pulp at constant dissolved oxygen <strong>and</strong> alkali concentrations.<br />
Delignification rates are measured using a differential<br />
continuous stirred-tank <strong>reactor</strong> (<strong>CSTR</strong>), where the dissolved<br />
oxygen concentration <strong>and</strong> the alkali concentration in the feed<br />
are kept constant, <strong>and</strong> the rate of lignin removal is determined<br />
from the dissolved lignin concentration in the outflow stream<br />
measured by UV–vis spectroscopy. 3<br />
Kinetic modeling<br />
The <strong>kinetics</strong> of oxygen <strong>delignification</strong> are usually presented<br />
by a power-law equation which includes the influence of the<br />
process variables, such as reaction temperature, oxygen pressure<br />
<strong>and</strong> caustic concentration 4<br />
r L ¼<br />
dK<br />
dt ¼ k½OH Šm P n O2 K q (1)<br />
where K is the kappa number; [OH 2 ] is the caustic concentration<br />
<strong>and</strong> P O2 is the absolute oxygen pressure. The constants m,<br />
AIChE Journal October 2007 Vol. 53, No. 10 2681
Reference<br />
Table 1. Summary of Kinetics Equations Using the Power-Law Model<br />
[OH 2 ]<br />
Exponent (m)<br />
[O 2 ]orPo 2<br />
Exponent (n)<br />
Kappa Number<br />
Exponent (q)<br />
Activation<br />
Energy (kJ/mol)<br />
Frequency<br />
Factor (A)<br />
Agarwal(1998) – – 7.7 – –<br />
Perng (1997) 0.4 0.5 4.8 60 1.8<br />
Teder (1981) 0.6 0.5 3.2 70 –<br />
Kovasin (1987) 0.13 0.5 1 18.6 –<br />
Iribarne (1997) 0.7 0.7 2.0 51 3 3 10 6<br />
Evans (1979) 1 1.23 1 49.1 10 5<br />
n, <strong>and</strong> q are obtained by fitting of the experimental data. The<br />
reaction-rate coefficient k depends on the temperature, <strong>and</strong> is<br />
assumed to follow the Arrhenius form<br />
<br />
k ¼ A exp<br />
<br />
E A<br />
RT<br />
where E A is the activation energy (J/mol), R is the ideal gas<br />
constant (8.314 J/molK), T is the absolute temperature (K) <strong>and</strong><br />
A is a preexponential factor (min 21 )(g/L) 2m (psia) 2n .<br />
A summary of the different power-law equations reported in<br />
the literature for oxygen <strong>delignification</strong> is given in Table 1.<br />
The reaction orders m, n <strong>and</strong> the activation energy in Table 1<br />
are difficult to compare, because the experiments were done<br />
with different pulps. It can also be seen that reaction order in<br />
kappa number varies from 1 to 7.7, <strong>and</strong> the activation energies<br />
range from less than 20 to 70 kJ/mol. The results in Table 1<br />
were obtained from <strong>batch</strong> <strong>reactor</strong>s, where [NaOH] was changing<br />
during the reaction <strong>and</strong> influenced the rate calculation.<br />
Cellulose degradation<br />
The cleavage of cellulose polymers was modeled by Iribarne<br />
<strong>and</strong> Schroeder 4 as the increase in number-average moles of cellulose<br />
per gram of pulp (m n ). Similarly, cellulose degradation<br />
can be described by the number of cellulose chain scissions<br />
during oxygen <strong>delignification</strong>. Violette <strong>and</strong> van Heiningen 10<br />
calculated the number of cellulose chain scissions from the<br />
average degree of polymerization of cellulose (DP) in the pulp<br />
at time t 5 0, <strong>and</strong> time t 5 t, that is, as 1/DP t 21/DP 0 .<br />
DP can be obtained from the intrinsic viscosity [g]by<br />
DP ¼<br />
(2)<br />
<br />
1:65½gŠ 116H 1:111<br />
(3)<br />
G<br />
Experimental<br />
<strong>Oxygen</strong> <strong>delignification</strong> experiments were performed both in<br />
a <strong>CSTR</strong>, <strong>and</strong> a <strong>batch</strong> Parr <strong>reactor</strong>. The Parr <strong>reactor</strong> is a 2 L horizontal<br />
stainless steel <strong>reactor</strong> obtained from Parr Instruments,<br />
with an anchor rotating device that wipes the inside of the <strong>reactor</strong><br />
with Teflon blades. Figure 1 shows the Parr <strong>reactor</strong> system.<br />
The flow diagram of the <strong>CSTR</strong> system is shown in Figure 2.<br />
<strong>Oxygen</strong> from a gas cylinder is bubbled into a NaOH solution<br />
contained in a pressurized (maximum 130 psig) 12 L stainless<br />
steel container. The container is kept at a controlled temperature<br />
by an external heating blanket. The <strong>CSTR</strong> <strong>reactor</strong> is a<br />
280 mL Berty style <strong>reactor</strong> (Autoclave Engineers) with a<br />
100 mL stationary basket which holds the pulp bed. A rotor<br />
underneath the basket induces flow through the pulp bed. The<br />
entire <strong>reactor</strong> is filled with liquid, <strong>and</strong> any gas inside the <strong>reactor</strong><br />
is vented at the top of the <strong>reactor</strong>. For each experiment, oxygen<br />
was bubbled overnight through the NaOH solution to obtain a<br />
saturated oxygen concentration. Then the reaction was started<br />
by feeding the oxygenated caustic solution at constant flow<br />
rate <strong>and</strong> oxygen pressure. The <strong>reactor</strong> pressure, temperature<br />
<strong>and</strong> outflow rate were recorded every 5 s, <strong>and</strong> the UV–vis<br />
absorption of the outflow stream was recorded every 15 s.<br />
Commercial unbleached softwood pulp sheets were homogenized.<br />
<strong>Oxygen</strong> <strong>delignification</strong> was done at 908C, 75 psig, 3.0%<br />
NaOH (on oven dry pulp), <strong>and</strong> 10% consistency (g of pulp/100<br />
g pulp suspension) in the <strong>batch</strong> <strong>reactor</strong>. In the <strong>CSTR</strong>, the reaction<br />
conditions were 908C, 75 psig, 3.3 g/L NaOH <strong>and</strong> 4.0 g<br />
pulp in the <strong>reactor</strong> basket. The volume of the <strong>CSTR</strong> basket is<br />
100 mL. The pulp consistency in the basket was about 10%,<br />
which is close to the <strong>batch</strong> <strong>reactor</strong> experiment. The reaction<br />
times for <strong>batch</strong> <strong>reactor</strong> <strong>and</strong> <strong>CSTR</strong> experiments were 10, 20, 40,<br />
60 <strong>and</strong> 180 min. Because we used large excess alkali <strong>and</strong> oxygen,<br />
the concentrations in the feed <strong>and</strong> the exit of the <strong>CSTR</strong><br />
where [g] is intrinsic viscosity of the pulp in cm 3 /g, <strong>and</strong> G <strong>and</strong><br />
H are the mass fractions of cellulose <strong>and</strong> hemicelulose in the<br />
pulp. 11 This formula assumes the viscosity depends on the<br />
mass of cellulose rather than the total pulp mass, <strong>and</strong> corrects<br />
for the small contribution of the hemicelluloses to the pulp’s<br />
intrinsic viscosity.<br />
The number of moles of cellulose per gram of pulp m n , can<br />
be calculated by<br />
<br />
<br />
1<br />
m n ¼<br />
162DP n þ 18 ffi 1 Moles Cellulose<br />
(4)<br />
162DP n Gram Pulp<br />
where the factor of 162 is the molecular weight of the anhydroglucose<br />
unit, <strong>and</strong> 18 is the molecular weight of water. 4<br />
Figure 1. Horizontal Parr <strong>reactor</strong> system.<br />
2682 DOI 10.1002/aic Published on behalf of the AIChE October 2007 Vol. 53, No. 10 AIChE Journal
Figure 2. <strong>CSTR</strong> <strong>reactor</strong> system.<br />
were approximately the same. This was verified for the alkali<br />
by comparing the pH of the feed <strong>and</strong> product streams. The<br />
3.3 g/L NaOH concentration used in the <strong>CSTR</strong> was calculated<br />
based on the 3.0% NaOH charge in the <strong>batch</strong> <strong>reactor</strong>, so that<br />
the NaOH concentration in the <strong>CSTR</strong> would be essentially<br />
identical to the initial concentration in the <strong>batch</strong> <strong>reactor</strong>. The<br />
following calculation shows how the concentration in the<br />
<strong>CSTR</strong> was determined:<br />
Batch <strong>reactor</strong> conditions: 10% consistency, 4.0 g pulp, 3%<br />
NaOH<br />
Total NaOH 5 4.0/0.10 3 0.03 5 1.2 g<br />
Total liquid 5 4/0.1024.0 5 36 g<br />
<strong>CSTR</strong> Equivalent: NaOH concentration 5 1.2/36 5 0.033<br />
5 3.3%.<br />
Raw Materials<br />
The oxygen <strong>delignification</strong> rate was studied using a commercial<br />
unbleached southern pine kraft pulp with an initial Kappa<br />
number of 24.4, <strong>and</strong> intrinsic viscosity of 1,189 mL/g.<br />
Measurements<br />
The dissolved lignin concentration was measured using a<br />
flow cell, <strong>and</strong> a HP8453 UV–vis spectrophotometer from<br />
Agilent. The absorption at 280 nm was converted to lignin<br />
concentration using a calibration curve prepared from purified<br />
lignin-Indulin AT from Mead-Westvaco. It is found that<br />
the extinction coefficient of the purified lignin is 24.8 L g 21<br />
cm 21 . Since lignin structures may change during oxygen<br />
<strong>delignification</strong>, the lignin extinction coefficient may be different<br />
over the reaction time. However, we closed the lignin<br />
mass balance using klason lignin <strong>and</strong> UV absorption at 280<br />
nm for the samples at five different reaction times using the<br />
calibration curve. 3 This shows that the lignin extinction coefficient<br />
does not change significantly during oxygen <strong>delignification</strong>.<br />
The work of Camilla Roost et al. also shows that lignin<br />
structure does not change much before <strong>and</strong> after oxygen<br />
<strong>delignification</strong>. 12 Additionally, some other chemicals formed<br />
during oxygen <strong>delignification</strong> may have an absorption at 280<br />
nm, which interferes with the calculation of total removed<br />
lignin amount. However, the amount is negligible at regular<br />
experiment conditions. It should be pointed out that the influence<br />
of other chemicals’ absorption at 280 nm can be<br />
obvious when the experiment is done at very long time, high<br />
alkali concentration, high-temperature <strong>and</strong> high-pressure.<br />
Yun Ji’s PhD thesis shows that the experiment at 6 h, 1158C<br />
<strong>and</strong> 90 psig, the calculated lignin is more than the lignin<br />
present in the original pulp. 13 The kappa numbers of the<br />
pulps were measured using the TAPPI st<strong>and</strong>ard method<br />
T236-cm-85. We also tested the kappa number <strong>and</strong> viscosity<br />
from different locations inside the pulp bed. The results show<br />
that the pulp is uniformly treated. However, since the amount<br />
of pulp in the basket is rather small, the kappa test method<br />
was modified such that all of the chemical dosages were<br />
reduced to one tenth of the amount in the TAPPI method.<br />
Intrinsic viscosities of the pulps were determined following<br />
the A.S.T.M. designation D1795-62 (reapproved 1985). The<br />
HexA group content was determined after acid hydrolysis of<br />
the pulps, <strong>and</strong> UV measurement of the hydrolysis products<br />
(2-furoic acid <strong>and</strong> 5-carboxy-2-furaldehyde), which have a<br />
clear absorption peak at 245 nm. The HexA content of the<br />
final pulp samples generated at 908C, 3.3 g/L NaOH <strong>and</strong> 75<br />
psig in the <strong>CSTR</strong> <strong>reactor</strong> were measured. The HexA content<br />
of all the samples was between 21 <strong>and</strong> 23 lmol/g pulp, confirming<br />
that HexA is stable during oxygen <strong>delignification</strong>.<br />
Because HexA contributes to the kappa number, the residual<br />
lignin content in the pulp was corrected for the HexA content<br />
in the pulp. Typically, 10 lmole HexA corresponds to<br />
between 0.8621.1 kappa units. 14,15 In this study, 10 lmol<br />
HexA is considered as 1 kappa unit, thus, the residual lignin<br />
content in pulp was calculated by<br />
<br />
L c ¼ Kappa<br />
HexA<br />
10<br />
<br />
3 1:5<br />
<br />
mg lignin<br />
g pulp<br />
The pulp in this study contained an average of 22 lmol HexA/g<br />
pulp, which is equivalent to 2.2 kappa units or 3.3 mg (22/<br />
10 3 1.5 5 3.3 mg) lignin/g pulp.<br />
The monosugars were measured by HPAEC with two-stage<br />
hydrolysis. (The first stage is performed in 72% H 2 SO 4 at 308C,<br />
while the second stage is performed in 4% H 2 SO 4 at 1218C.)<br />
(5)<br />
AIChE Journal October 2007 Vol. 53, No. 10 Published on behalf of the AIChE DOI 10.1002/aic 2683
Figure 3. Delignification rate <strong>and</strong> reaction temperature<br />
vs. time.<br />
[Color figure can be viewed in the online issue, which is<br />
available at www.interscience.wiley.com.]<br />
Data Analysis Procedure<br />
The <strong>CSTR</strong> methodology was validated by showing that the<br />
oxygen <strong>delignification</strong> <strong>kinetics</strong> are not influenced by the<br />
amount of pulp in the <strong>reactor</strong>, the feed flow rate, <strong>and</strong> rotor<br />
speed (over 400 rpm). 3 Most experiments were performed<br />
with 4 g (oven dry basis) of pulp, because of the volume of the<br />
basket <strong>and</strong> analysis requirements. The dissolved lignin mass<br />
balance for the well mixed <strong>reactor</strong> during time interval dt, is:<br />
or<br />
Inflow-Outflow þ Dissolved by Reaction<br />
¼ Accumulated in Reactor<br />
0 / v CðtÞdt þ rðtÞm p dt ¼ V r dCðtÞ ð6Þ<br />
or<br />
<br />
dCðtÞ 1<br />
rðtÞ ¼ / v CðtÞþV r ð7Þ<br />
dt m p<br />
where r(t) is the rate of <strong>delignification</strong> (mg lignin/g pulp/min);<br />
Fv is the liquid-flow rate (mL/min); C(t) is the dissolved lignin<br />
concentration (mg lignin/mL); Vr is the <strong>reactor</strong> volume (mL),<br />
<strong>and</strong> mp is the pulp weight (o.d pulp).<br />
The <strong>reactor</strong> volume Vr, was determined by a residence-time<br />
distribution (RTD) experiment using a step-input with methyl<br />
red tracer. Analysis of the RTD determined that the Berty <strong>reactor</strong><br />
<strong>and</strong> piping up to the UV–vis detector could be described by<br />
a <strong>CSTR</strong> of 265 mL, <strong>and</strong> a plug-flow volume of 96 mL. This<br />
closely agrees with our estimate of the free volume in the <strong>reactor</strong><br />
<strong>and</strong> piping, respectively. Therefore, V r 5 265 mL, <strong>and</strong> the<br />
residence time between the Berty <strong>reactor</strong> <strong>and</strong> UV detector t d is<br />
t d ¼ 96<br />
(8)<br />
/ v<br />
Thus, the dissolved lignin concentration inside the Berty <strong>reactor</strong><br />
at time t, C(t), is equal to the concentration measured by<br />
UV at time t 1 t d , C L (t 1 t d )<br />
CðtÞ ¼C L ðt þ t d Þ (9)<br />
<strong>and</strong><br />
rðtÞ ¼ / v<br />
C L ðt þ t d Þþ V r dC L<br />
(10)<br />
m p m p dt tþtd<br />
The amount of lignin removed from the pulp at time t is<br />
/ v<br />
Z tþt d<br />
0<br />
C L ðtÞdt þ V r C L ðt þ t d Þ (11)<br />
A typical <strong>delignification</strong> rate calculated from the UV–vis<br />
results using Eq. 10 is plotted, along with <strong>reactor</strong> temperature<br />
vs. time in Figure 3. The <strong>delignification</strong> rate initially increases<br />
rapidly from 0.25 to about 0.5 mgg pulp 21 min 21 , during the<br />
time in which the water in the <strong>reactor</strong> is replaced by the oxygenated<br />
caustic solution. The time scale of the initial increase<br />
is consistent with the average residence time of 4.5 min for the<br />
liquid in the <strong>reactor</strong> system in this experiment. Because of limitations<br />
in the temperature control (618C), the data show correlated<br />
fluctuations over the reaction time.<br />
Results <strong>and</strong> Discussion<br />
Comparison of <strong>delignification</strong> rates<br />
Figure 4 presents a <strong>comparison</strong> of <strong>delignification</strong> experiments<br />
using the <strong>batch</strong> <strong>and</strong> <strong>CSTR</strong> <strong>reactor</strong>s. The <strong>CSTR</strong> <strong>and</strong> <strong>batch</strong><br />
kappa numbers are almost the same during the first 30 min.<br />
However, the <strong>CSTR</strong> kappa numbers are lower than the <strong>batch</strong><br />
<strong>reactor</strong> kappa numbers after 40 min, which indicates a higher<br />
rate of <strong>delignification</strong> in the <strong>CSTR</strong>. After 3 h reaction, the<br />
<strong>CSTR</strong> kappa number is five points lower. This is because the<br />
<strong>CSTR</strong> is continuously fed with a fresh oxygenated caustic solution,<br />
while the caustic concentration decreases continuously<br />
with time in the <strong>batch</strong> <strong>reactor</strong> due to consumption by acid<br />
Table 2. Summary of Batch Reactor <strong>and</strong> <strong>CSTR</strong> Kappa<br />
Number Power-law Model<br />
908C, 3.3 g/l NaOH, 75 psig (0,10, 20, 40, 60 <strong>and</strong> 180 min)<br />
Figure 4. Kappa number model <strong>and</strong> experimental <strong>CSTR</strong><br />
<strong>and</strong> <strong>batch</strong> <strong>reactor</strong> data.<br />
[Color figure can be viewed in the online issue, which is available<br />
at www.interscience.wiley.com.]<br />
Parameter<br />
Reaction<br />
Order q<br />
Reaction<br />
Constant k (min 21 )<br />
<strong>CSTR</strong> 2.70 9.0327 3 10 25<br />
Batch 4.25 8.918 3 10 27<br />
2684 DOI 10.1002/aic Published on behalf of the AIChE October 2007 Vol. 53, No. 10 AIChE Journal
Table 3. Cellulose <strong>and</strong> Hemicelulose Content, Intrinsic Viscosity <strong>and</strong> Cellulose DP<br />
O 2 Delig Time,<br />
t (min)<br />
Cellulose, G<br />
(g/g od pulp)<br />
Hemicellulose,<br />
H (g/g od pulp)<br />
Intrinsic Viscosity,<br />
g (ml/g)<br />
Polymerization<br />
Degree, DP<br />
Batch <strong>CSTR</strong> Batch <strong>CSTR</strong> Batch <strong>CSTR</strong> Batch <strong>CSTR</strong><br />
0 0.714 0.714 0.142 0.142 1189 1189 6561 6561<br />
10 0.723 0.732 0.139 0.139 1058 1079 5674 5724<br />
20 0.723 0.734 0.138 0.142 1011 1033 5394 5435<br />
40 0.729 0.746 0.139 0.140 924 877 4831 4445<br />
60 0.736 0.750 0.140 0.138 898 828 4629 4144<br />
180 0.736 0.763 0.141 0.135 829 592 4230 2784<br />
products, such as carboxylic acid 16 released from the pulp. The<br />
kinetic data obtained in both <strong>reactor</strong>s were analyzed using the<br />
power-law equation. Figure 4 shows that the data obtained in<br />
both the <strong>CSTR</strong> <strong>and</strong> <strong>batch</strong> <strong>reactor</strong> are well presented by the<br />
power-law Eq. 1.<br />
Table 2 presents the power-law model parameters for<br />
<strong>delignification</strong> in the <strong>CSTR</strong> <strong>and</strong> <strong>batch</strong> <strong>reactor</strong> calculated using<br />
Eq. 1. The reaction order for lignin is higher in the <strong>batch</strong> <strong>reactor</strong><br />
to describe a stronger decrease in <strong>delignification</strong> rate at<br />
lower kappa numbers, but the reaction constant k, is lower. The<br />
calculated reaction rate is a combination of reaction order <strong>and</strong><br />
reaction constant. However, the order obtained in the <strong>CSTR</strong> is<br />
more accurate because the caustic concentration <strong>and</strong> dissolved<br />
oxygen concentration remain constant in the <strong>CSTR</strong>. In the<br />
<strong>batch</strong> <strong>reactor</strong>, the order of the rate dependence on lignin concentration<br />
cannot be separated from the effect of decreasing<br />
caustic concentration as the reaction proceeds.<br />
Selectivity <strong>comparison</strong><br />
It is well known that hydroxyl radicals generated in the oxygen<br />
<strong>delignification</strong> reaction attack both lignin <strong>and</strong> cellulose.<br />
We conducted experiments using the <strong>batch</strong> <strong>and</strong> <strong>CSTR</strong> <strong>reactor</strong>s<br />
at the same operating conditions to compare the pulp properties<br />
<strong>and</strong> selectivity. To calculate the DP of cellulose in the pulps<br />
using Eq. 3, we measured the content of cellulose (G) <strong>and</strong> hemicellulose<br />
(H) in the pulp by high-pressure anion exchange<br />
chromatography (HPAEC) on the two-stage acid hydrolyzed<br />
pulp samples. 17 The results for the pulp samples in the <strong>CSTR</strong><br />
<strong>and</strong> <strong>batch</strong> <strong>reactor</strong> are listed in Table 3.<br />
The <strong>delignification</strong>-cellulose degradation selectivity remains<br />
constant during <strong>batch</strong> <strong>delignification</strong>, but decreases during<br />
<strong>delignification</strong> in the <strong>CSTR</strong>. We have plotted the kappa number<br />
change vs. cellulose cleavages per glucose unit (calculated as 1/<br />
DP t -1/DP 0 ) in Figure 5. Note that the relationship is linear for the<br />
<strong>batch</strong> <strong>reactor</strong> data, while the change in kappa number decreases<br />
with increasing number of cellulose cleavages for the pulps in<br />
the <strong>CSTR</strong>. The explanation for the linear behavior in the <strong>batch</strong><br />
<strong>reactor</strong> data is that cellulose degradation is caused by radical species,<br />
the formation of which is proportional to the degree of<br />
<strong>delignification</strong>. 18 The alkali hydrolysis influence on <strong>batch</strong> <strong>reactor</strong><br />
data is relatively small after 30 min of reaction.<br />
However, the decrease in <strong>delignification</strong>-cellulose degradation<br />
selectivity in the <strong>CSTR</strong> suggests there is an additional cellulose<br />
degradation mechanism, which becomes important<br />
when the caustic concentration remains high throughout the<br />
process. For instance, the alkaline hydrolysis of cellulose may<br />
be significant in the <strong>CSTR</strong>, where the fibers are continuously<br />
exposed to a constantly high-alkaline concentration.<br />
Because of the differences in selectivity observed in the<br />
<strong>batch</strong> <strong>and</strong> <strong>CSTR</strong> reactions, the cellulose degradation was modeled<br />
by two contributions: one due to radicals produced by phenolic<br />
<strong>delignification</strong>, <strong>and</strong> the other due to alkaline hydrolysis.<br />
The model containing both rates is<br />
dm n<br />
dt<br />
¼<br />
k c<br />
dK<br />
dt þ k h½OH Š (12)<br />
where m n is the number of moles of cellulose per gram of pulp<br />
(mole/g pulp); is the rate constant for radical attack (moles/g<br />
pulp kappa); <strong>and</strong> k h is the alkaline hydrolysis rate constant<br />
Figure 5. DKappa vs. (1/DP21/DP 0 ) of <strong>CSTR</strong> <strong>and</strong> <strong>batch</strong><br />
<strong>reactor</strong>.<br />
[Color figure can be viewed in the online issue, which is<br />
available at www.interscience.wiley.com.]<br />
Figure 6. Degradation of cellulose in <strong>CSTR</strong> <strong>and</strong> <strong>batch</strong><br />
<strong>reactor</strong>s; experimental <strong>and</strong> predicted data.<br />
[Color figure can be viewed in the online issue, which is<br />
available at www.interscience.wiley.com.]<br />
AIChE Journal October 2007 Vol. 53, No. 10 Published on behalf of the AIChE DOI 10.1002/aic 2685
Figure 7. Delignification rate vs. residual lignin for the<br />
data in Figure 3.<br />
[Color figure can be viewed in the online issue, which is<br />
available at www.interscience.wiley.com.]<br />
(L mol cellulose/g pulp g NaOH min); [OH 2 ] is the alkali<br />
concentration in g/L.<br />
Integration of Eq. 12 gives<br />
m n ¼ m 0 þ k c ðK K 0 Þþk h ½OH Št (13)<br />
Since NaOH is rapidly consumed during the initial phase of oxygen<br />
<strong>delignification</strong> in the <strong>batch</strong> <strong>reactor</strong>, the influence of the<br />
term k h ½OH Št was neglected for t 20 min in the calculation.<br />
This allows the calculation of k c by fitting the data for the <strong>batch</strong><br />
<strong>reactor</strong> at t 20 min as 3.60 3 10 28 (moles/g pulp kappa).<br />
Using this value for the analysis of the <strong>CSTR</strong> data gives a value<br />
for k h of 1.07 3 10 29 (L mol cellulose/g pulp g NaOH min).<br />
These values provide a reasonable fit to the cellulose degradation<br />
in the <strong>CSTR</strong> as illustrated in Figure 6. The Batch <strong>reactor</strong><br />
data were best represented by k h 5 zero.<br />
Kinetic Model for <strong>Oxygen</strong> Delignification<br />
The <strong>CSTR</strong> was used to independently determine the oxygen<br />
pressure <strong>and</strong> caustic concentration influence on the <strong>delignification</strong><br />
rate since these concentrations do not vary during a single<br />
experiment. The residual lignin in the pulp was calculated<br />
using Eq. 5, so that the time-dependent data could be plotted<br />
Figure 8. ln (2r 0 L C<br />
) vs. ln([OH 2 ]) <strong>and</strong> vs. ln(P O2 ).<br />
[Color figure can be viewed in the online issue, which is available<br />
at www.interscience.wiley.com.]<br />
vs. residual lignin. As an example, the data from Figure 3 are<br />
plotted in Figure 7. The data for other operating conditions<br />
also show a generally linear relationship between <strong>delignification</strong><br />
rate, <strong>and</strong> residual lignin content if the first few minutes of<br />
reaction are ignored when water in the <strong>CSTR</strong> is replaced by the<br />
oxygenated caustic solution. Therefore, we have assumed the<br />
reaction is first-order in residual lignin in our model.<br />
The <strong>delignification</strong> rate model in terms of residual lignin<br />
content is<br />
E<br />
r LC ¼ Ae R3T ½OH Š m P n O2 L C (14)<br />
where 2r LC is the <strong>delignification</strong> rate (mg/g pulp/min); T is the<br />
reaction temperature (K); [OH 2 ] is the initial sodium hydroxide<br />
concentration (g/L); P O2 is the oxygen pressure (psia), <strong>and</strong> L c is<br />
the residual lignin corrected for HexA content (mg/g pulp).<br />
The derivative of 2r LC with respect to L c , 2r 0 L C<br />
, is a pseudofirst-order<br />
rate constant with units of min 21 , <strong>and</strong> is calculated<br />
from the slope of the data in Figure 7. The linearized form of<br />
the model is then<br />
lnð rL 0 E<br />
C<br />
Þ¼lnðAÞ<br />
RT þ m ln½OH Šþn ln P <br />
O 2<br />
(15)<br />
Experiments were performed at different temperatures, oxygen<br />
pressures <strong>and</strong> alkali concentrations, <strong>and</strong> the results are<br />
Table 4. Rate Constants of Different Experiments<br />
Temperature<br />
(8C)<br />
Total<br />
Pressure<br />
(psig)<br />
<strong>Oxygen</strong><br />
Pressure<br />
(psia)<br />
NaOH<br />
(g/liter)<br />
2r 0 LC 3 1000<br />
(min 21 )<br />
81 75 82.8 3.3 9.77 6 0.17<br />
91 75 79.5 3.3 13.6 6 0.1<br />
100 75 75.0 3.3 19.3 6 0.1<br />
112 75 68.9 3.3 37.5 6 0.4<br />
117 75 65.2 3.3 43.3 6 0.9<br />
90 35 39.5 3.3 10.4 6 0.1<br />
90 55 59.5 3.3 11.5 6 0.01<br />
93 95 99.5 3.3 15.6 6 0.1<br />
89 75 79.5 1.1 6.97 6 0.08<br />
93 75 79.5 5.5 17.9 6 0.01<br />
93 75 79.5 7.7 23.1 6 0.1<br />
90 75 79.5 20 27.8 6 0.1<br />
89 75 79.5 50 35.0 6 0.5<br />
Figure 9. Arrhenius construction to determine activation<br />
energy <strong>and</strong> preexponential factor.<br />
[Color figure can be viewed in the online issue, which is available<br />
at www.interscience.wiley.com.]<br />
2686 DOI 10.1002/aic Published on behalf of the AIChE October 2007 Vol. 53, No. 10 AIChE Journal
activation energy of 54.5 kJ/mol is consistent with a reaction<br />
controlled process. Furthermore, it is proposed that the cellulose<br />
degradation during oxygen <strong>delignification</strong> can be<br />
described by two contributions: one due to radicals produced<br />
by phenolic <strong>delignification</strong>, <strong>and</strong> a much smaller contribution<br />
due to alkaline hydrolysis. Periodic addition of smaller charges<br />
of caustic during industrial <strong>delignification</strong> is recommended to<br />
improve the overall selectivity at the same degree of <strong>delignification</strong>.<br />
Acknowledgments<br />
The Technical Research Centre of Finl<strong>and</strong> (VTT) <strong>and</strong> TEKES of Finl<strong>and</strong><br />
are acknowledged for their financial support.<br />
Figure 10. Experimental 2r 0 L C<br />
vs. modeled 2r 0 L C<br />
for data<br />
in Table 4.<br />
The straight line represents a perfect fit. Inset shows model<br />
fit for data in Figure 3, including oscillatory temperature<br />
control. [Color figure can be viewed in the online issue,<br />
which is available at www.interscience.wiley.com.]<br />
summarized in Table 4. Note that the partial pressure of oxygen<br />
was calculated by the total pressure minus the vapor pressure<br />
of water for a given temperature. The uncertainties in the<br />
values of 2r 0 L C<br />
(<strong>and</strong> all reported uncertainties) represent 95%<br />
confidence intervals, based on the linear regressions.<br />
Data for experiments at 908C were used to independently<br />
determine m <strong>and</strong> n by plotting ln (2r 0 L C<br />
) vs. ln([OH 2 ]) <strong>and</strong> vs.<br />
ln(P O2 ) in Figure 8. Linear regression of the two sets of data<br />
determined m 5 0.42 6 0.15 <strong>and</strong> n 5 0.44 6 0.29. Then, the<br />
temperature-dependent data were used to calculate the preexponential<br />
factor <strong>and</strong> activation energy for P O2 5 75 psia, <strong>and</strong><br />
[OH 2 ] 5 3.3 g/L. First, values of k(T) were calculated using<br />
2r 0 L C<br />
; [OH 2 ], <strong>and</strong> P O2 , <strong>and</strong> then the kinetic parameters were<br />
determined from the Arrhenius construction in Figure 9. This<br />
analysis determined E 5 53 6 12 kJ/mol, <strong>and</strong> ln(A) 5 10.8 6<br />
3.8, so A 5 4.9 3 10 4 min 21 (g/L) 20.42 (psia) 20.44 .<br />
In addition to independently determining the parameters of<br />
the rate expression, a statistical software package was used to<br />
perform a multivariate analysis of all of the data simultaneously.<br />
The parameters determined by this analysis are consistent<br />
with the ones determined independently, but this analysis<br />
improved the uncertainties. From the analysis, m 5 0.412 6<br />
0.060, n 5 0.305 6 0.260, E 5 54.5 6 6.8 kJ/mol, <strong>and</strong> ln(A)<br />
5 11.9 6 2.4. The experimental values of 2r 0 L C<br />
are plotted in<br />
Figure 10 vs. the values of 2r 0 L C<br />
calculated from the model.<br />
Note that the model provides a reasonable estimate of the<br />
<strong>delignification</strong> rate over the entire range of experimental conditions.<br />
Finally, the inset of Figure 10 demonstrates that the<br />
model also accurately predicts the effect of the temperature<br />
oscillations for the data in Figure 3.<br />
Conclusions<br />
<strong>Oxygen</strong> <strong>delignification</strong> <strong>kinetics</strong> were studied using a <strong>CSTR</strong><br />
to separate the dependence on caustic concentration from the<br />
dependence on lignin concentration. Using this technique, it<br />
was found unambiguously that the rate of <strong>delignification</strong> is<br />
first-order in HexA-free residual lignin content of the pulp. The<br />
Literature Cited<br />
1. McCubbin N. Yield improvements possible with O 2 delig, digester<br />
modifications. Pulp Paper. 1997;71(6):93–97.<br />
2. Li J. Towards an accurate determination of lignin in chemical pulps.<br />
Royal Institute of Technology, Stockholm, Sweden; 1999. PhD thesis.<br />
3. Ji Y, Van Heiningen A. Mechanism <strong>and</strong> <strong>kinetics</strong> of <strong>delignification</strong> during<br />
oxygen alkali treatment in a <strong>CSTR</strong>. 92nd Annual PAPTAC;<br />
2006:B213–B222.<br />
4. Irabarne J, Schroeder LR. High pressure oxygen <strong>delignification</strong> of kraft<br />
pulps. TAPPI J. 1997;80(10):241–250.<br />
5. Agarwal SB, Genco JM, Cole BJW, Miller W. Kinetics of oxygen<br />
delignificaition. TAPPI Pulping Conf 1998;351–364.<br />
6. Perrng Y-S, Oloman CW. Kinetics of oxygen bleaching mediated by<br />
electrochemically generated ferricyanide. TAPPI J. 1994;77(7):115–<br />
126.<br />
7. Teder A, Olm L. Extended <strong>delignification</strong> by combination of modified<br />
kraft pulp <strong>and</strong> oxygen bleaching. Paperi Puu. 1981;63(4a):315–326.<br />
8. Kovasin K, Uusitalo P, Viilo M. Dimensioning of oxygen <strong>delignification</strong><br />
<strong>reactor</strong>s. International <strong>Oxygen</strong> Delignification Conference.<br />
1987;223–230.<br />
9. Evans JE, Venkatesh V, Gratzl JS, Chang H-M. The <strong>kinetics</strong> of low<br />
consistency oxygen <strong>delignification</strong>, kraft <strong>and</strong> soda anthraquinone<br />
pulps. TAPPI. 1979;62(6):37–39.<br />
10. Violette S, van Heiningen A. Selectivity improvement during oxygen<br />
<strong>delignification</strong> by adsorption of a sugar-based polymer. J Pulp Paper<br />
Sci. 2003;29(2):48–53.<br />
11. Van Heiningen A, Tunc MS, Gao Y, Da Silva Perez D. Relationship<br />
between alkaline pulp yield <strong>and</strong> the mass fraction <strong>and</strong> degree of polymerization<br />
of cellulose in the pulp. J Pulp Paper Sci. 2004;30(8):211–<br />
217.<br />
12. Roost C, Lawoko M, Gellerstedt G. Structural changes in residual kraft<br />
pulp lignins. Effect of kappa number <strong>and</strong> degree of oxygen <strong>delignification</strong>.<br />
Nordic Pulp Paper Res J. 2003;18(4):395–399.<br />
13. Ji Y. Kinetics <strong>and</strong> Mechanism of <strong>Oxygen</strong> Delignification. PhD Dissertation.<br />
University of Maine, 2007.<br />
14. Li, J, Gellerstedt G. Oxymercuration-demercuration kappa number: an<br />
accurate estimation of the lignin content in chemical pulps. Nordic<br />
Pulp Paper Res J. 2002;17(4):410–414.<br />
15. Jääskeläinen A, Saariaho A, Vuorinen T. Quantification of lignin <strong>and</strong><br />
hexenuronic acid in bleached hardwood kraft pulps: a new calibration<br />
method for UVRR spectroscopy <strong>and</strong> evaluation of the conventional<br />
methods. J Wood Chem Technol. 2005;25(1–2):51–65.<br />
16. Zhang DC, Chai X-S, Hou Q.X, Ragauskas A. Characterization of<br />
fiber carboxylic acid development during one-stage oxygen <strong>delignification</strong>.<br />
Indust Eng Chem Res. 2005;44:9279–9285.<br />
17. Davis MW. A rapid modified method for compositional carbohydrate<br />
analysis of lignocellulosics by high pH anion exchange chromatography<br />
with pulsed amperometric detection (HPAEC/PAD). J Wood<br />
Chem Technol. 1998;18(2):235–252.<br />
18. Violette S. <strong>Oxygen</strong> <strong>delignification</strong> <strong>kinetics</strong> <strong>and</strong> selectivity improvement.<br />
University of Maine, Orono, Maine, USA, 2003. PhD Thesis.<br />
Manuscript received Feb. 26, 2007, <strong>and</strong> revision received Jun. 25, 2007.<br />
AIChE Journal October 2007 Vol. 53, No. 10 Published on behalf of the AIChE DOI 10.1002/aic 2687