Manufacturing and Services - Office of Travel and Tourism Industries
Manufacturing and Services - Office of Travel and Tourism Industries
Manufacturing and Services - Office of Travel and Tourism Industries

Create successful ePaper yourself
Turn your PDF publications into a flip-book with our unique Google optimized e-Paper software.
U.S. Department <strong>of</strong> Commerce • International Trade Administration<br />
<strong>Manufacturing</strong> <strong>and</strong> <strong>Services</strong><br />
<strong>Office</strong> <strong>of</strong> <strong>Travel</strong> <strong>and</strong> <strong>Tourism</strong> <strong>Industries</strong><br />
2007 United States Resident <strong>Travel</strong> Abroad
International Trade Administration • <strong>Manufacturing</strong> <strong>and</strong> <strong>Services</strong> • <strong>Office</strong> <strong>of</strong> <strong>Travel</strong> <strong>and</strong> <strong>Tourism</strong> <strong>Industries</strong><br />
Billions <strong>of</strong> U.S. Dollars Spent Abroad<br />
$110B<br />
$100B<br />
$90B<br />
$80B<br />
$70B<br />
$60B<br />
U.S. <strong>Travel</strong> <strong>and</strong> <strong>Tourism</strong> Imports: 1998 - 2007<br />
$76.5B<br />
$80.3B<br />
$89.B<br />
$82.8B<br />
$78.7B<br />
$78.4B<br />
$90.5B<br />
$95.1B<br />
$99.6B<br />
1998 1999 2000 2001 2002 2003 2004 2005 2006 2007<br />
Source: U.S. Department <strong>of</strong> Commerce, International Trade Administration, <strong>Manufacturing</strong> <strong>and</strong> <strong>Services</strong>, <strong>Office</strong> <strong>of</strong> <strong>Travel</strong> <strong>and</strong> <strong>Tourism</strong><br />
<strong>Industries</strong> from the Bureau <strong>of</strong> Economic Analysis ( June 2008).<br />
$104.7B<br />
U.S. Resident Spending Abroad: 1998-2007<br />
Total U.S. <strong>Travel</strong> <strong>and</strong> <strong>Tourism</strong> Imports = ‘<strong>Travel</strong>’ Payments + ‘Passenger Fare’ Payments.
International Trade Administration • <strong>Manufacturing</strong> <strong>and</strong> <strong>Services</strong> • <strong>Office</strong> <strong>of</strong> <strong>Travel</strong> <strong>and</strong> <strong>Tourism</strong> <strong>Industries</strong><br />
Millions <strong>of</strong> U.S. <strong>Travel</strong>ers Abroad<br />
U.S. Resident <strong>Travel</strong> Abroad (Outbound): 1998 - 2007<br />
66M<br />
64M<br />
62M<br />
60M<br />
58M<br />
56M<br />
54M<br />
52M<br />
50M<br />
55.7M<br />
57.2M<br />
61.3M<br />
59.4M<br />
58.1M<br />
56.2M<br />
61.8M<br />
63.5M<br />
63.7M<br />
1998 1999 2000 2001 2002 2003 2004 2005 2006 2007<br />
Sources: U.S. Department <strong>of</strong> Commerce, International Trade Administration, <strong>Manufacturing</strong> <strong>and</strong> <strong>Services</strong>, <strong>Office</strong> <strong>of</strong> <strong>Travel</strong> & <strong>Tourism</strong> <strong>Industries</strong>;<br />
Statistics Canada (Canada); <strong>and</strong> Banco de Mexico/Secretaria de Turismo (Mexico).<br />
64.1M<br />
U.S. Resident <strong>Travel</strong> Abroad: 1998-2007
International Trade Administration • <strong>Manufacturing</strong> <strong>and</strong> <strong>Services</strong> • <strong>Office</strong> <strong>of</strong> <strong>Travel</strong> <strong>and</strong> <strong>Tourism</strong> <strong>Industries</strong><br />
International Visitors<br />
(Inbound)<br />
1998 1999 2000 2001 2002 2003 2004 2005 2006 2007r<br />
Total Inbound (000s) 46,378 48,509 51,238 46,927 43,581 41,218 46,086 49,206 50,977 55,986<br />
% Change -3% 5% 6% -8% -7% -5% 12% 7% 4% 10%<br />
Overseas 23,698 24,466 25,975 21,833 19,117 18,026 20,322 21,679 21,668 23,892<br />
% Change -2% 3% 6% -16% -12% -6% 13% 7% 0% 10%<br />
Canada 13,430 14,115 14,667 13,527 13,024 12,666 13,857 14,862 15,992 17,761<br />
% Change -11% 5% 4% -8% -4% -3% 9% 7% 8% 11%<br />
Mexico 9,249 9,928 10,596 11,567 11,440 10,526 11,907 12,665 13,317 14,333<br />
% Change 8% 7% 7% 9% -1% -8% 13% 6% 5% 8%<br />
U.S. Residents<br />
(Outbound)<br />
1998 1999 2000 2001 2002 2003 2004 2005 2006 2007<br />
Total Outbound (000s) 55,698 57,222 61,327 59,442 58,065 56,250 61,809 63,503 63,662 64,052<br />
% Change 5% 3% 7% -3% -2% -3% 10% 3% 0% 1%<br />
Overseas 23,069 24,579 26,853 25,249 23,397 24,452 27,351 28,787 30,148 31,228<br />
% Change 7% 7% 9% -6% -7% 5% 12% 5% 5% 4%<br />
Canada 14,894 15,180 15,189 15,570 16,167 14,232 15,088 14,391 13,855 13,371<br />
% Change 11% 2% 0% 3% 4% -12% 6% -5% -4% -3%<br />
Mexico 17,735 17,463 19,285 18,623 18,501 17,566 19,370 20,325 19,659 19,453<br />
% Change -3% -2% 10% -3% -1% -5% 10% 5% -3% -1%<br />
Sources: U.S. Department <strong>of</strong> Commerce, ITA, <strong>Office</strong> <strong>of</strong> <strong>Travel</strong> & <strong>Tourism</strong> <strong>Industries</strong>; Statistics Canada (Canada); <strong>and</strong> Banco de Mexico/Secretaria de Turismo (Mexico).<br />
r= Revised since preliminary estimates were released.<br />
“Overseas” excludes Canada <strong>and</strong> Mexico.<br />
Updated June 2008<br />
International Visitors (Inbound) <strong>and</strong> U.S. Residents (Outbound)<br />
International <strong>Travel</strong>ers to/from the United States<br />
1998 - 2007r<br />
United States Resident <strong>Travel</strong> Abroad: 2007
United States Resident <strong>Travel</strong> Abroad: 2007<br />
2007<br />
Rank<br />
Select Destinations <strong>of</strong> U.S. Residents <strong>Travel</strong>ing Abroad (Outbound) 1<br />
2006 vs 2007<br />
Country 2 2006<br />
2007<br />
(000)<br />
(000)<br />
1 Mexico 19,659 19,453 -1%<br />
% Change<br />
(2007/2006)<br />
Mexico (Air) 5,748 5,800 1%<br />
2 Canada 13,855 13,371 -3%<br />
Canada (Air) 3,881 3,777 -3%<br />
3 U.K. 3,286 3,123 -5%<br />
4 Italy 2,201 2,373 8%<br />
5 France 2,231 2,217 -1%<br />
6 Germany 1,688 1,936 15%<br />
7 Japan 1,538 1,718 12%<br />
8 Jamaica 1,688 1,530 -9%<br />
9 People's Republic <strong>of</strong> China 1,327 1,374 4%<br />
10 Spain 995 1,093 10%<br />
11 India 904 999 10%<br />
12 Hong Kong 904 968 7%<br />
13 Netherl<strong>and</strong>s 904 937 4%<br />
14 Irel<strong>and</strong> 844 749 -11%<br />
15 Taiwan 693 687 -1%<br />
15 Brazil ** 687 **<br />
15 Republic <strong>of</strong> Korea 633 687 9%<br />
18 Switzerl<strong>and</strong> 633 656 4%<br />
19 Australia 603 593 -2%<br />
20 Colombia ** 562 **<br />
20 Greece 482 562 17%<br />
22 Israel ** 500 **<br />
23 Thail<strong>and</strong> 482 468 -3%<br />
24 Austria ** 406 **<br />
25 Czech Republic ** 375 **<br />
...Continued<br />
International Trade Administration • <strong>Manufacturing</strong> <strong>and</strong> <strong>Services</strong> • <strong>Office</strong> <strong>of</strong> <strong>Travel</strong> <strong>and</strong> <strong>Tourism</strong> <strong>Industries</strong>
United States Resident <strong>Travel</strong> Abroad: 2007<br />
...Continued<br />
2007<br />
Rank<br />
Select Destinations <strong>of</strong> U.S. Residents <strong>Travel</strong>ing Abroad (Outbound) 1<br />
2006 vs 2007<br />
Country 2 2006<br />
2007<br />
(000)<br />
(000)<br />
26 Singapore 422 344 -19%<br />
% Change<br />
(2007/2006)<br />
27 Philippines 271 312 15%<br />
27 Russia ** 312 **<br />
29 New Zeal<strong>and</strong> 301 281 -7%<br />
30 Turkey ** 250 **<br />
31 Vietnam 181 219 21%<br />
31 South Africa ** 219 **<br />
33 Egypt ** 156 **<br />
34 Malaysia 121 125 3%<br />
35 Indonesia ** 94 **<br />
Bahamas 1,538 ** **<br />
Aruba 422 ** **<br />
Subtotal to Overseas 3 30,148 31,228 4%<br />
Total U.S. Resident <strong>Travel</strong>ers 63,662 64,052 1%<br />
(1) Ranked by 2007 visitation volume<br />
(2) Visitation estimates are provided only for countries that have at least 400 respondents.<br />
(3) Overseas includes all countries except Canada <strong>and</strong> Mexico<br />
** Estimate not shown due to sample size fewer than 400, based upon the OTTI statistical policy<br />
Note: This table shows only one <strong>of</strong> the 32 travel characteristics data reported on U.S. resident outbound travelers. Additional information may be obtained for a<br />
fee. To learn more, please visit our website: http://tinet.ita.doc.gov/research/programs/ifs/index.html<br />
Source: U.S. Department <strong>of</strong> Commerce, ITA, <strong>Office</strong> <strong>of</strong> <strong>Travel</strong> <strong>and</strong> <strong>Tourism</strong> <strong>Industries</strong>, June 2008<br />
International Trade Administration • <strong>Manufacturing</strong> <strong>and</strong> <strong>Services</strong> • <strong>Office</strong> <strong>of</strong> <strong>Travel</strong> <strong>and</strong> <strong>Tourism</strong> <strong>Industries</strong>
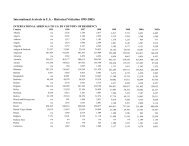
International Trade Administration • <strong>Manufacturing</strong> <strong>and</strong> <strong>Services</strong> • <strong>Office</strong> <strong>of</strong> <strong>Travel</strong> <strong>and</strong> <strong>Tourism</strong> <strong>Industries</strong><br />
U.S. Resident <strong>Travel</strong> Abroad<br />
2000 - 2007 Historical Outbound Visitation (one or more nights) 1 ...Continued<br />
Region/Country 2000 2001 2002 2003 2004 2005 2006 2007<br />
Total Outbound 2 61,327 59,442 58,065 56,250 61,809 63,503 63,662 64,052<br />
Mexico 19,285 18,623 18,501 17,566 19,370 20,325 19,659 19,453<br />
Mexico (Air) 4,334 3,992 4,176 4,562 5,224 5,673 5,748 5,800<br />
Canada 15,189 15,570 16,167 14,232 15,088 14,391 13,855 13,371<br />
Canada (Air) 3,835 3,782 3,790 3,502 3,932 3,915 3,881 3,777<br />
Overseas 3 26,853 25,249 23,397 24,452 27,351 28,787 30,148 31,228<br />
Europe 13,373 11,438 10,131 10,319 11,679 11,976 12,029 12,304<br />
Western Europe 12,916 10,983 9,640 9,781 11,022 11,227 11,336 11,523<br />
Austria 564 404 304 367 410 ** ** 406<br />
Belgium 457 353 328 220 301 ** ** **<br />
Denmark 242 227 117 196 219 ** ** **<br />
Finl<strong>and</strong> 107 151 117 98 137 ** ** **<br />
France 2,927 2,626 2,223 1,883 2,407 2,217 2,231 2,217<br />
Germany 2,309 1,894 1,591 1,540 1,750 1,670 1,688 1,936<br />
Greece 457 429 328 293 438 489 482 562<br />
Irel<strong>and</strong> 725 757 562 562 738 691 844 749<br />
Italy 2,148 1,944 1,661 1,638 1,915 2,044 2,201 2,373<br />
Netherl<strong>and</strong>s 1,101 858 866 831 930 864 904 937<br />
Norway 134 202 94 98 219 ** ** **<br />
Portugal 269 151 140 147 137 ** ** **<br />
Spain 1,262 1,010 866 929 903 979 995 1,093<br />
Sweden 295 278 164 171 246 ** ** **<br />
Switzerl<strong>and</strong> 994 707 562 611 520 518 633 656<br />
United Kingdom 4,189 3,383 3,229 3,252 3,692 3,829 3,286 3,123<br />
United States Resident <strong>Travel</strong> Abroad: 2007
International Trade Administration • <strong>Manufacturing</strong> <strong>and</strong> <strong>Services</strong> • <strong>Office</strong> <strong>of</strong> <strong>Travel</strong> <strong>and</strong> <strong>Tourism</strong> <strong>Industries</strong><br />
U.S. Resident <strong>Travel</strong> Abroad<br />
2000 - 2007 Historical Outbound Visitation (one or more nights) 1<br />
Region/Country 2000 2001 2002 2003 2004 2005 2006 2007<br />
Eastern Europe 806 959 796 929 1,149 1,209 1,266 1,343<br />
Czech Republic 269 278 211 220 356 ** ** 375<br />
Hungary 134 202 140 147 164 ** ** **<br />
Pol<strong>and</strong> 269 278 187 220 246 ** ** **<br />
Russia 134 227 234 269 301 345 ** 312<br />
Caribbean 3,867 4,141 4,258 5,306 4,868 5,182 6,150 5,184<br />
Bahamas 913 555 796 1,418 1,012 930 1,538 **<br />
Barbados n.a. n.a. 117 n.a. 246 ** ** **<br />
Bermuda 322 101 140 n.a. n.a. ** ** **<br />
Cayman Is. n.a. n.a. 117 147 164 ** ** **<br />
Dominican Rep n.a. 1,338 1,100 929 957 ** ** **<br />
Jamaica 886 1,313 983 1,492 1,258 1,353 1,688 1,530<br />
Trinidad/Tobago n.a. 126 187 220 219 ** ** **<br />
South America 2,095 2,247 1,755 1,981 2,352 2,361 2,442 2,811<br />
Argentina 376 303 187 318 328 ** ** **<br />
Brazil 671 606 491 611 602 605 ** 687<br />
Chile 188 227 164 171 219 ** ** **<br />
Colombia 242 328 304 318 438 ** ** 562<br />
Peru 322 303 281 269 410 ** ** **<br />
Venezuela 269 303 187 122 n.a. ** ** **<br />
Central America 886 1,414 1,521 1,663 1,778 1,756 1,538 2,248<br />
Costa Rica n.a. 379 398 489 629 ** ** **<br />
El Salvador n.a. 303 328 245 301 ** ** **<br />
Guatemala n.a. 278 281 293 n.a. ** ** **<br />
Panama n.a. 151 164 196 191 ** ** **<br />
...Continued<br />
United States Resident <strong>Travel</strong> Abroad: 2007
International Trade Administration • <strong>Manufacturing</strong> <strong>and</strong> <strong>Services</strong> • <strong>Office</strong> <strong>of</strong> <strong>Travel</strong> <strong>and</strong> <strong>Tourism</strong> <strong>Industries</strong><br />
U.S. Resident <strong>Travel</strong> Abroad<br />
2000 - 2007 Historical Outbound Visitation (one or more nights) 1<br />
Region/Country 2000 2001 2002 2003 2004 2005 2006 2007<br />
Africa 483 505 421 465 629 576 663 874<br />
Morocco 107 101 94 73 82 ** ** **<br />
S. Africa 134 126 117 171 246 ** ** 219<br />
Middle East 1,370 1,010 819 685 1,039 1,094 1,115 1,312<br />
Egypt 215 202 n.a. n.a. 164 ** ** 156<br />
Israel 618 177 117 n.a. 137 ** ** 500<br />
Turkey 322 404 304 245 274 ** ** 250<br />
Asia 4,914 4,318 4,492 3,937 5,087 6,074 6,271 6,714<br />
Hong Kong 832 732 749 489 738 921 904 968<br />
India 457 454 398 416 629 835 904 999<br />
Indonesia 161 101 94 73 82 ** ** 94<br />
Japan 1,262 1,060 1,287 1,051 1,067 1,497 1,538 1,718<br />
Malaysia 107 126 140 98 109 115 121 125<br />
China (PRC) 644 682 725 562 1,067 1,295 1,327 1,374<br />
Philippines 457 429 234 269 438 288 271 312<br />
Taiwan 671 656 632 489 629 662 693 687<br />
South Korea 779 530 608 513 574 662 633 687<br />
Singapore 457 328 374 220 274 374 422 344<br />
Thail<strong>and</strong> 376 404 398 342 410 489 482 468<br />
Vietnam 107 101 117 98 109 ** 181 219<br />
Oceania 1,047 1,187 819 831 821 835 874 874<br />
Australia 698 833 562 562 602 605 603 593<br />
New Zeal<strong>and</strong> 457 480 257 293 328 317 301 281<br />
1<br />
Estimates <strong>of</strong> U.S. Outbound for 2005-2007 are provided only for world regions or countries having a sample size <strong>of</strong> 400 or more.<br />
The past year estimates based upon at least 100 respondents are still reported for 1997-2004.<br />
2<br />
Total outbound is the sum <strong>of</strong> Canada, Mexico <strong>and</strong> Overseas.<br />
3<br />
Overseas includes all countries except Canada <strong>and</strong> Mexico.<br />
** Estimate not shown due to sample size fewer than 400, a new OTTI statistical policy for the 2005-2007 data release.<br />
n.a. - Estimates are not available because fewer than 100 travelers were surveyed in 1997-2004.<br />
United States Resident <strong>Travel</strong> Abroad: 2007<br />
Source: U.S. Department <strong>of</strong> Commerce, ITA, <strong>Office</strong> <strong>of</strong> <strong>Travel</strong> <strong>and</strong> <strong>Tourism</strong> <strong>Industries</strong>, June 2008.
United States Resident <strong>Travel</strong> Abroad: 2007<br />
2007<br />
Rank<br />
U.S. Airport<br />
2007<br />
to Overseas 1 2007<br />
Market Share<br />
2007<br />
Cumulative Share<br />
- TOTAL U.S. OUTBOUND 31,227,960 100.0% -<br />
1 New York (JFK & LaGuardia) 4,643,534 14.9% 14.9%<br />
2 Miami 3,943,190 12.6% 27.5%<br />
3 Los Angeles 3,139,249 10.1% 37.5%<br />
4 Newark 2,464,166 7.9% 45.4%<br />
5 Chicago 2,363,594 7.6% 53.0%<br />
6 Atlanta 2,245,531 7.2% 60.2%<br />
7 San Francisco 1,956,651 6.3% 66.5%<br />
8 Houston 1,351,915 4.3% 70.8%<br />
9 Washington (Dulles) 1,323,428 4.2% 75.0%<br />
10 Boston 897,161 2.9% 77.9%<br />
11 Philadelphia 865,316 2.8% 80.7%<br />
12 Detroit 724,160 2.3% 83.0%<br />
13 Dallas 716,950 2.3% 85.3%<br />
14 San Juan 669,402 2.1% 87.4%<br />
15 Charlotte 639,117 2.0% 89.5%<br />
16 Honolulu 540,032 1.7% 91.2%<br />
17 Agana 410,331 1.3% 92.5%<br />
18 Seattle 394,016 1.3% 93.8%<br />
19 Ft. Lauderdale 381,605 1.2% 95.0%<br />
20 Minneapolis 341,713 1.1% 96.1%<br />
21 Orl<strong>and</strong>o 171,971 0.6% 96.7%<br />
22 Cincinnati 145,771 0.5% 97.1%<br />
23 Denver 131,481 0.4% 97.5%<br />
24 Baltimore 119,236 0.4% 97.9%<br />
25 Portl<strong>and</strong> 92,289 0.3% 98.2%<br />
26 Sanford Orl<strong>and</strong>o 67,879 0.2% 98.4%<br />
27 Memphis 63,843 0.2% 98.6%<br />
28 Anchorage 60,921 0.2% 98.8%<br />
29 Phoenix 49,304 0.2% 99.0%<br />
30 W Palm Beach 41,190 0.1% 99.1%<br />
1<br />
Overseas excludes Canada <strong>and</strong> Mexico.<br />
2007 Annual U.S. Citizen Departures<br />
Table IIId - Passenger <strong>Travel</strong> Between U.S. Ports <strong>and</strong> Foreign Countries<br />
Top U.S. Airports <strong>of</strong> Departure for U.S. Citizens<br />
Note: Airport listings are limited to airports with over 37,000 U.S. citizen travelers departing the U.S. for overseas destinations.<br />
Learn more about the program that produced these data: http://tinet.ita.doc.gov/outreachpages/outbound.general_information.outbound_overview.html<br />
Source: U.S. Department <strong>of</strong> Commerce, ITA, <strong>Office</strong> <strong>of</strong> <strong>Travel</strong> & <strong>Tourism</strong> <strong>Industries</strong>, U.S. International Air <strong>Travel</strong> Statistics Report (I-92), Table 3.d.<br />
International Trade Administration • <strong>Manufacturing</strong> <strong>and</strong> <strong>Services</strong> • <strong>Office</strong> <strong>of</strong> <strong>Travel</strong> <strong>and</strong> <strong>Tourism</strong> <strong>Industries</strong>
Interested in obtaining data for your organization?<br />
OTTI produces custom reports for a fee! To learn more, please visit:<br />
http://www.tinet.ita.doc.gov/research/programs/ifs/customized.html<br />
U.S. Department <strong>of</strong> Commerce<br />
International Trade Administration<br />
<strong>Manufacturing</strong> <strong>and</strong> <strong>Services</strong><br />
<strong>Office</strong> <strong>of</strong> <strong>Travel</strong> <strong>and</strong> <strong>Tourism</strong> <strong>Industries</strong><br />
14th & Constitution Ave, NW<br />
Washington, D.C. 20230<br />
Phone: (202) 482-0140<br />
Fax: (202) 482-2887<br />
http://tinet.ita.doc.gov<br />
International Trade Administration • <strong>Manufacturing</strong> <strong>and</strong> <strong>Services</strong> • <strong>Office</strong> <strong>of</strong> <strong>Travel</strong> <strong>and</strong> <strong>Tourism</strong> <strong>Industries</strong>