You also want an ePaper? Increase the reach of your titles
YUMPU automatically turns print PDFs into web optimized ePapers that Google loves.
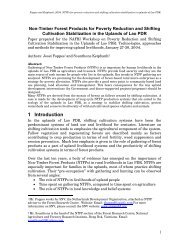
Table 8:<br />
Estimated income from NTFP’s in 5 villages <strong>on</strong> the <strong>Nakai</strong> plateau.<br />
Product 7 x f Total Value 5 villages Av. Value per household<br />
(values in kip) 1996 1997 1996 1997<br />
kisi 0U-u du[ 4,684,367 13,079,661 23,658 66,059<br />
rattan shoots [6jo}lko 326,606 5,071,125 1,650 25,612<br />
cardamom \kdc|' du[ 2,196,294 1,834,933 11,092 9,267<br />
b<strong>on</strong>g [q' 3,919,132 1,632,600 19,794 8,245<br />
wildlife lafxjk 77,857 1,024,800 393 5,176<br />
others* 1,991,014 721,333 10,056 3,643<br />
rattan canes s;kpm6o 3,224,000 55,175 16,283 279<br />
TOTAL ]kpIa[ma's,qf 16,419,271 23,419,628 82,926 118,281<br />
*) others include various fish species sold, eaglewood (Aquilaria crassna), and wild cinnamom, “chouang” bark<br />
(Cinnamom sp.)<br />
4.2.3 Differences between wealth classes within a village<br />
Working with wealth classes allowed us to compare the importance of NTFP’s between<br />
wealthy and poor families. The poorer families tend to derive a high percentage if not all of<br />
their cash income from NTFP’s (see table 9). However, if we look at the absolute values,<br />
poor families do not get higher income from NTFP’s than richer families (see table 10). This<br />
means that most families tend to be involved in collecting NTFP’s, but poorer families have<br />
no access to other sources of income.<br />
Table 9:<br />
Percentage of cash income derived from NTFP’s in 1996, per wealth class<br />
(1=wealthiest, 5=poorest), in 5 villages <strong>on</strong> the <strong>Nakai</strong> plateau.<br />
Village: Wealth class:<br />
1 2 3 4 5<br />
Kh<strong>on</strong>e ken 49% 75% 89% 89%<br />
Ka-Oy 33 % 90% 99%<br />
<strong>Nakai</strong> Neua 12% 25% 17% 27% 64%<br />
Sop Phen 57% 61% 100% 100% 100%<br />
Thalang 31% 5% 59% 83%<br />
Similar relati<strong>on</strong>ships are found if we rank all 21 wealth classes in all 5 villages according to<br />
net income (see Annex 4 and table 11). In a normal year like 1996, of all 191 families living<br />
in the 5 villages together, 108 families or 57 % have a positive net income, and 83 families or<br />
43 % had a negative income or rice shortage. Income from NTFP’s is higher am<strong>on</strong>g wealthy<br />
families than am<strong>on</strong>g poor families (see table 11). Also income from livestock sales and other<br />
income such as salaries and trading goods, are much higher in the richer groups than in the<br />
poorer groups. For the poorest, NTFP’s are the <strong>on</strong>ly available source of income.