Create successful ePaper yourself
Turn your PDF publications into a flip-book with our unique Google optimized e-Paper software.
In the same exercise, we used to ask villagers to also rank their main expenditures, so as to<br />
get an overall picture of the family ec<strong>on</strong>omy. The results are shown in table 4. Buying rice<br />
(18%), other food (14%), clothes (13%) and medicines (12%) are c<strong>on</strong>sidered as the main<br />
family expenditures.<br />
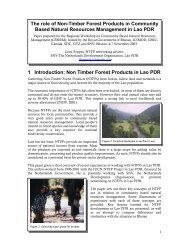
Table 3: Ranking of main cash income sources in 5 villages <strong>on</strong> the <strong>Nakai</strong> <strong>Plate</strong>au,<br />
March 1997.<br />
No Income source Kh<strong>on</strong>eKen Kaoy <strong>Nakai</strong> N. Sophen Thalang TOTAL<br />
1 Livestock sales 24 % 15 % 17 % 12 % 11 % 16 %<br />
2 Kisi resin 10 % 16 % 11 % 18 % 15 % 14 %<br />
3 Fish sales 12 % 8 % 12 % 10 % 19 % 12 %<br />
4 Cardamom 12 % 16 % 7 % 10 % 8 % 11 %<br />
5 Wildlife sales 11 % 8 % 6 % 11 % 12 % 10 %<br />
6 B<strong>on</strong>g bark 10 % 6 % 7 % 9 % 8 % 8 %<br />
7 Rattan shoots 6 % 7 % 4 % 6 % 9 % 6 %<br />
8 Rattan canes 7 % 3 % 3 % 11 % 1 % 5 %<br />
9 Bamboo shoots 3 % 6 % 8 % 4 % 4 %<br />
10 Agr. crops 5 % 4 % 6 % 3 %<br />
12 Eaglewood 12 % 2 %<br />
12 Labour wages 3 % 3 % 4 % 2 %<br />
13 Vegetables 7 % 2 %<br />
14 Bai kho 5 % 1 %<br />
15 Mak khen 4 % 1 %<br />
16 Shop sales 4 % 1 %<br />
17 Mushrooms 3 % 1 % 1 %<br />
18 Mak phep 3 % 1 %<br />
19 Handicrafts 2 % 0 %<br />
20 Hak tin houng 2 % 0 %<br />
21 Galangal (kha) 2 % 0 %<br />
22 Kheua hem 1 % 0 %<br />
Total NTFP’s 73 % 82 % 61 % 84 % 83 % 76 %<br />
Livestock 24 % 15 % 17 % 12 % 11 % 16 %<br />
Others 3 % 3 % 22 % 4 % 6 % 8 %<br />
Table 4:<br />
Villagers’ ranking of family expenditures, 5 villages <strong>on</strong> the <strong>Nakai</strong> plateau,<br />
March 1997.<br />
No Expenditure Kh<strong>on</strong>eKen Kaoy <strong>Nakai</strong> N. Sophen Thalang TOTAL<br />
1 Buying rice 18 % 23 % 14 % 20 % 15 % 18 %<br />
2 Other food 16 % 16 % 17 % 9 % 14 % 14 %<br />
3 Clothes 15 % 16 % 12 % 12 % 10 % 13 %<br />
4 Medicines 12 % 14 % 13 % 7 % 13 % 12 %<br />
5 Kitchen utensils 11 % 5 % 4 % 7 % 6 % 7 %<br />
6 Agric. tools 10 % 10 % 7 % 7 % 5 % 8 %<br />
7 House building 5 % 9 % 4 % 4 %<br />
8 Drinking,<br />
5 % 9 % 8 % 9 % 7 % 8 %<br />
smoking<br />
9 Fishing/hunting 4 % 5 % 9 % 9 % 6 %<br />
tools<br />
10 Buying fish 4 % 1 %<br />
11 Buying cattle 3 % 1 %<br />
12 Cerem<strong>on</strong>ies 7 % 4 % 4 % 3 % 4 %<br />
13 Jewelry 7 % 7 % 3 %<br />
14 Transportati<strong>on</strong> 7 % 7 % 7 % 4 %