Annual Report 2010 03 August 2011 - Banka Qendrore e ...
Annual Report 2010 03 August 2011 - Banka Qendrore e ...
Annual Report 2010 03 August 2011 - Banka Qendrore e ...

You also want an ePaper? Increase the reach of your titles
YUMPU automatically turns print PDFs into web optimized ePapers that Google loves.
CBK<br />
<strong>Annual</strong> <strong>Report</strong> <strong>2010</strong><br />
total exports. Unlike last year,<br />
when machinery and equipment<br />
export recorded an annual decline<br />
of 18.0 percent, exports of this<br />
category recorded an annual<br />
growth of 48.8 percent in <strong>2010</strong>.<br />
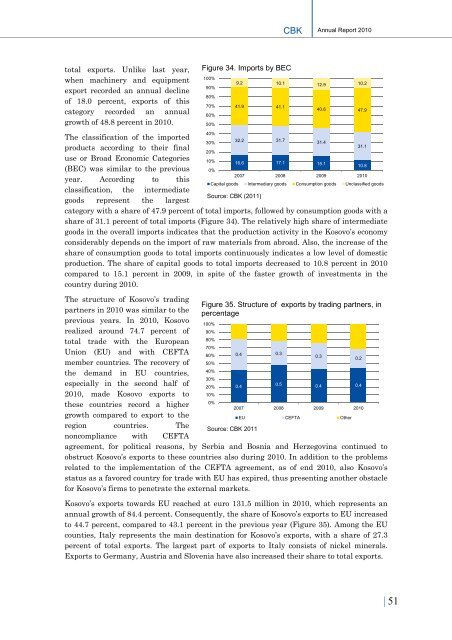
The classification of the imported<br />
32.2 31.7<br />
30%<br />
31.4<br />
31.1<br />
products according to their final<br />
20%<br />
use or Broad Economic Categories<br />
10% 16.6 17.1 15.1<br />
10.8<br />
(BEC) was similar to the previous 0%<br />
2007 2008 2009 <strong>2010</strong><br />
year. According to this<br />
Capital goods Intermediary goods Consumption goods Unclassified goods<br />
classification, the intermediate<br />
Source: CBK (<strong>2011</strong>)<br />
goods represent the largest<br />
category with a share of 47.9 percent of total imports, followed by consumption goods with a<br />
share of 31.1 percent of total imports (Figure 34). The relatively high share of intermediate<br />
goods in the overall imports indicates that the production activity in the Kosovo’s economy<br />
considerably depends on the import of raw materials from abroad. Also, the increase of the<br />
share of consumption goods to total imports continuously indicates a low level of domestic<br />
production. The share of capital goods to total imports decreased to 10.8 percent in <strong>2010</strong><br />
compared to 15.1 percent in 2009, in spite of the faster growth of investments in the<br />
country during <strong>2010</strong>.<br />
The structure of Kosovo’s trading<br />
partners in <strong>2010</strong> was similar to the<br />
previous years. In <strong>2010</strong>, Kosovo<br />
realized around 74.7 percent of<br />
total trade with the European<br />
Union (EU) and with CEFTA<br />
member countries. The recovery of<br />
the demand in EU countries,<br />
especially in the second half of<br />
<strong>2010</strong>, made Kosovo exports to<br />
these countries record a higher<br />
growth compared to export to the<br />
region countries. The<br />
noncompliance with CEFTA<br />
Figure 34. Imports by BEC<br />
100%<br />
90%<br />
80%<br />
70%<br />
60%<br />
50%<br />
40%<br />
9.2 10.1 12.9 10.2<br />
41.9 41.1<br />
40.6 47.9<br />
Figure 35. Structure of exports by trading partners, in<br />
percentage<br />
100%<br />
90%<br />
80%<br />
70%<br />
60%<br />
50%<br />
40%<br />
30%<br />
20%<br />
10%<br />
0%<br />
0.4 0.3<br />
agreement, for political reasons, by Serbia and Bosnia and Herzegovina continued to<br />
obstruct Kosovo’s exports to these countries also during <strong>2010</strong>. In addition to the problems<br />
related to the implementation of the CEFTA agreement, as of end <strong>2010</strong>, also Kosovo’s<br />
status as a favored country for trade with EU has expired, thus presenting another obstacle<br />
for Kosovo’s firms to penetrate the external markets.<br />
Kosovo’s exports towards EU reached at euro 131.5 million in <strong>2010</strong>, which represents an<br />
annual growth of 84.4 percent. Consequently, the share of Kosovo’s exports to EU increased<br />
to 44.7 percent, compared to 43.1 percent in the previous year (Figure 35). Among the EU<br />
counties, Italy represents the main destination for Kosovo’s exports, with a share of 27.3<br />
percent of total exports. The largest part of exports to Italy consists of nickel minerals.<br />
Exports to Germany, Austria and Slovenia have also increased their share to total exports.<br />
0.4<br />
Source: CBK <strong>2011</strong><br />
0.3<br />
0.2<br />
0.5 0.4 0.4<br />
2007 2008 2009 <strong>2010</strong><br />
EU CEFTA Other<br />
| 51