financial stability report - Banka Qendrore e Republikës së Kosovës
financial stability report - Banka Qendrore e Republikës së Kosovës
financial stability report - Banka Qendrore e Republikës së Kosovës
You also want an ePaper? Increase the reach of your titles
YUMPU automatically turns print PDFs into web optimized ePapers that Google loves.
Number 3<br />
Financial Stability Report<br />
banks is in accordance with the notion of monopoly, monopolistic competition, or perfect<br />
competition.<br />
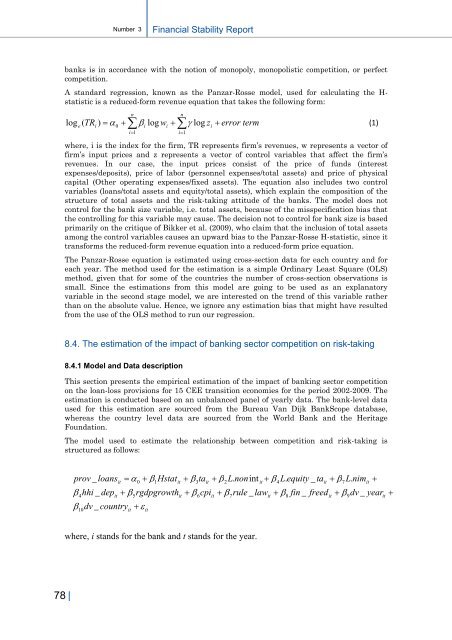
A standard regression, known as the Panzar-Rosse model, used for calculating the H-<br />
statistic is a reduced-form revenue equation that takes the following form:<br />
e<br />
i<br />
n<br />
n<br />
0 i i i<br />
<br />
i1<br />
i1<br />
log ( TR ) log w log z error term<br />
(1)<br />
where, i is the index for the firm, TR represents firm’s revenues, w represents a vector of<br />
firm’s input prices and z represents a vector of control variables that affect the firm’s<br />
revenues. In our case, the input prices consist of the price of funds (interest<br />
expenses/deposits), price of labor (personnel expenses/total assets) and price of physical<br />
capital (Other operating expenses/fixed assets). The equation also includes two control<br />
variables (loans/total assets and equity/total assets), which explain the composition of the<br />
structure of total assets and the risk-taking attitude of the banks. The model does not<br />
control for the bank size variable, i.e. total assets, because of the misspecification bias that<br />
the controlling for this variable may cause. The decision not to control for bank size is based<br />
primarily on the critique of Bikker et al. (2009), who claim that the inclusion of total assets<br />
among the control variables causes an upward bias to the Panzar-Rosse H-statistic, since it<br />
transforms the reduced-form revenue equation into a reduced-form price equation.<br />
The Panzar-Rosse equation is estimated using cross-section data for each country and for<br />
each year. The method used for the estimation is a simple Ordinary Least Square (OLS)<br />
method, given that for some of the countries the number of cross-section observations is<br />
small. Since the estimations from this model are going to be used as an explanatory<br />
variable in the second stage model, we are interested on the trend of this variable rather<br />
than on the absolute value. Hence, we ignore any estimation bias that might have resulted<br />
from the use of the OLS method to run our regression.<br />
8.4. The estimation of the impact of banking sector competition on risk-taking<br />
8.4.1 Model and Data description<br />
This section presents the empirical estimation of the impact of banking sector competition<br />
on the loan-loss provisions for 15 CEE transition economies for the period 2002-2009. The<br />
estimation is conducted based on an unbalanced panel of yearly data. The bank-level data<br />
used for this estimation are sourced from the Bureau Van Dijk BankScope database,<br />
whereas the country level data are sourced from the World Bank and the Heritage<br />
Foundation.<br />
The model used to estimate the relationship between competition and risk-taking is<br />
structured as follows:<br />
prov _ loans<br />
hhi _ dep<br />
4<br />
it<br />
it<br />
dv _ country<br />
10<br />
Hstat<br />
rgdpgrowth<br />
it<br />
5<br />
0<br />
<br />
it<br />
1<br />
it<br />
it<br />
ta<br />
3<br />
it<br />
cpi<br />
6<br />
L.<br />
nonint<br />
it<br />
2<br />
it<br />
rule _ law<br />
7<br />
L.<br />
equity _ ta<br />
it<br />
4<br />
it<br />
fin _ freed<br />
8<br />
L.<br />
nim<br />
it<br />
7<br />
it<br />
<br />
dv _ year<br />
9<br />
it<br />
<br />
where, i stands for the bank and t stands for the year.<br />
78 |


