Equity Index Funds Annual Report - Northern Funds
Equity Index Funds Annual Report - Northern Funds
Equity Index Funds Annual Report - Northern Funds

Create successful ePaper yourself
Turn your PDF publications into a flip-book with our unique Google optimized e-Paper software.
NORTHERN EQUITY INDEX FUNDS<br />
ANNUAL REPORT<br />
MARCH 31, 2014
A MESSAGE FROM<br />
BOB BROWNE<br />
CHIEF INVESTMENT OFFICER<br />
Global developed-market equities<br />
delivered robust performance during the<br />
12-month period ended March 31, 2014,<br />
with the United States leading the way.<br />
U.S. large cap stocks returned 21.86%<br />
during the reporting period, based<br />
on the return of the S&P 500® <strong>Index</strong>.<br />
Small cap stocks gained an even<br />
stronger 24.90%, as gauged by the<br />
Russell 2000® <strong>Index</strong>. The U.S. stock<br />
market continued to attract capital<br />
due to the country’s strong economic<br />
growth relative to the rest of the world,<br />
and small cap stocks — thanks to<br />
their domestic focus — were in a prime<br />
position to capitalize on this trend.<br />
Domestic equities were also supported<br />
by the robust health of U.S. corporations,<br />
highlighted by their strong balance<br />
sheets and steady earnings gains.<br />
The scenario was not quite as<br />
positive overseas, but developed markets<br />
nonetheless finished with a healthy gain<br />
of 17.56% for the reporting period, as<br />
measured by the MSCI EAFE® <strong>Index</strong>.<br />
The European economy continued its<br />
modest expansion, and recent surveys<br />
showed that both manufacturing and<br />
service companies remain in growth<br />
mode. Japan’s economy continued to<br />
struggle, however, and its environment<br />
may grow even more challenging with<br />
the country facing an increase in its<br />
nationwide value-added tax in April.<br />
Given that consumers sought to time<br />
purchases ahead of this increase, which<br />
has artificially boosted prior growth<br />
data, the tax is expected to cause<br />
a contraction in consumption once<br />
it is implemented.<br />
Returns for emerging markets stocks<br />
were pressured by the combination<br />
of currency weakness, concerns about<br />
China’s growth, and the downturn in<br />
commodity prices. The MSCI Emerging<br />
Markets SM <strong>Index</strong> returned -1.43%<br />
during the 12-month reporting period,<br />
sharply underperforming the other<br />
major equity asset classes. We believe<br />
that emerging market stocks need easier<br />
monetary policy and improvement<br />
in the broader economic outlook in<br />
order to outperform developed-market<br />
equities. There has not been much<br />
progress on either front, however,<br />
and the asset class has continued to<br />
underperform.<br />
For the United States, the primary<br />
question following the 20%+ gain of<br />
the past 12 months is whether stock<br />
prices can continue to rise. Indeed,<br />
the possibility of short-term market<br />
weakness cannot be ruled out given<br />
the length of time since stocks have had<br />
a meaningful correction. In addition,<br />
U.S. equities finished the reporting<br />
period trading at a premium to median<br />
historic valuations due largely to the<br />
expansion of price-to-earnings ratios<br />
that has occurred during the period.<br />
Having said this, it is also true that<br />
stock prices are closely correlated to the<br />
direction of earnings over time. Earnings<br />
for S&P 500® companies are projected<br />
to grow in the mid- to high single digits<br />
in 2014, as low interest rates, rising<br />
consumer confidence and improving<br />
credit availability for corporations are<br />
combining to support profit growth.<br />
Household debt service is historically low<br />
and increasing numbers of so-called<br />
“echo-boomers” are forming households,<br />
which should support consumption. The<br />
interest rate picture is also positive, with<br />
the U.S. Federal Reserve expected to keep<br />
rates near zero through the middle of<br />
next year. In addition, corporate profit<br />
margins are well supported by rising<br />
productivity, lower commodity prices<br />
and declining interest expenses. Finally,<br />
and perhaps most importantly, U.S.<br />
equities continue to be the asset class<br />
of choice for global investors due to the<br />
relative strength of the U.S. economy and<br />
the low rates available from bonds and<br />
cash. While higher valuations indicate<br />
that the foundation for stocks may not<br />
be as positive as it was one year ago, these<br />
factors continue to represent important<br />
pillars of support for the equity markets.<br />
Bob Browne<br />
Chief Investment Officer<br />
<strong>Northern</strong> Trust
EQUITY INDEX FUNDS<br />
TABLE OF CONTENTS<br />
2 PORTFOLIO MANAGEMENT COMMENTARY<br />
The report has been prepared for the general<br />
information of <strong>Northern</strong> <strong>Funds</strong> shareholders. It<br />
is not authorized for distribution to<br />
prospective investors unless accompanied or<br />
preceded by a current <strong>Northern</strong> <strong>Funds</strong><br />
prospectus, which contains more complete<br />
information about <strong>Northern</strong> <strong>Funds</strong>’ investment<br />
policies, management fees and expenses.<br />
Investors are reminded to read the prospectus<br />
carefully before investing or sending money.<br />
Performance calculations reflect fee waivers<br />
and reimbursements in effect. In the absence<br />
of fee waivers and reimbursements, total<br />
return would have been reduced. Total return<br />
is based on net change in net asset value<br />
assuming reinvestment of all dividends and<br />
distributions.<br />
<strong>Northern</strong> <strong>Funds</strong>’ performance is compared to<br />
various market indices. Unlike a mutual fund,<br />
the performance of an index assumes no<br />
transaction costs, taxes, management fees or<br />
other expenses. A direct investment in an<br />
index is not possible.<br />
The recent volatility in the stock market has<br />
produced short-term returns that are not<br />
typical and may not continue in the future.<br />
Because of ongoing market volatility,<br />
<strong>Northern</strong> <strong>Funds</strong>’ performance may be subject<br />
to substantial short-term changes.<br />
This report contains certain forward-looking<br />
statements about factors that may affect the<br />
performance of <strong>Northern</strong> <strong>Funds</strong> in the future.<br />
These statements are based on <strong>Northern</strong><br />
<strong>Funds</strong>’ management predictions and<br />
expectations concerning certain future events,<br />
such as performance of the economy as a<br />
whole and of specific industry sectors,<br />
changes in the levels of interest rates, the<br />
impact of developing world events, and other<br />
factors. Management believes these forwardlooking<br />
statements to be reasonable,<br />
although they are inherently uncertain and<br />
difficult to predict. Actual events may cause<br />
adjustments in <strong>Northern</strong> <strong>Funds</strong>’ management<br />
strategies from those currently expected to be<br />
employed.<br />
10 STATEMENTS OF ASSETS AND LIABILITIES<br />
12 STATEMENTS OF OPERATIONS<br />
14 STATEMENTS OF CHANGES IN NET ASSETS<br />
16 FINANCIAL HIGHLIGHTS<br />
23 SCHEDULES OF INVESTMENTS<br />
23 EMERGING MARKETS EQUITY INDEX FUND<br />
37 GLOBAL REAL ESTATE INDEX FUND<br />
47 GLOBAL SUSTAINABILITY INDEX FUND<br />
59 INTERNATIONAL EQUITY INDEX FUND<br />
73 MID CAP INDEX FUND<br />
80 SMALL CAP INDEX FUND<br />
107 STOCK INDEX FUND<br />
116 NOTES TO THE FINANCIAL STATEMENTS<br />
130 REPORT OF INDEPENDENT REGISTERED PUBLIC<br />
ACCOUNTING FIRM<br />
131 TAX INFORMATION<br />
132 SHAREHOLDER MEETING RESULTS<br />
133 FUND EXPENSES<br />
135 TRUSTEES AND OFFICERS<br />
140 APPROVAL OF MANAGEMENT AGREEMENT<br />
143 INVESTMENT CONSIDERATIONS<br />
144 FOR MORE INFORMATION<br />
<strong>Northern</strong> <strong>Funds</strong> are distributed by <strong>Northern</strong> <strong>Funds</strong><br />
Distributors, LLC, Three Canal Plaza, Suite 100,<br />
Portland, Maine 04101, not affiliated with<br />
<strong>Northern</strong> Trust.<br />
NOT FDIC INSURED<br />
May lose value / No bank guarantee<br />
NORTHERN FUNDS ANNUAL REPORT 1 EQUITY INDEX FUNDS
EQUITY INDEX FUNDS<br />
EMERGING MARKETS EQUITY INDEX FUND<br />
(UNAUDITED)<br />
PORTFOLIO MANAGEMENT COMMENTARY<br />
The Emerging Markets <strong>Equity</strong> <strong>Index</strong> Fund returned -1.57% during the 12-month reporting period ended March 31, 2014, compared<br />
with -1.43% for the Fund’s benchmark, the MSCI Emerging Markets <strong>Index</strong> SM . Emerging markets underperformed developed markets<br />
as measured by the MSCI World <strong>Index</strong> return of 19.07% for the same period.<br />
Emerging markets struggled over the course of the reporting period, largely due to currency fluctuations, monetary policy and<br />
economic data from major markets. Japan’s move to generate growth through a devaluation of the yen resulted in increased export<br />
competition for emerging economies. Chinese growth slowed, further hampering emerging market exports, and worries mounted over<br />
the tightening of Chinese credit. In the early summer, remarks by the Chairman of the U.S. Federal Reserve hinted at the beginning of a<br />
tapering in the Federal Reserve’s asset purchase program. This had a significant negative impact on several major emerging market<br />
currencies, and funds began to flow out of emerging markets. Emerging markets would recover to some degree after the Federal<br />
Reserve decided in September to keep its asset purchase levels steady. However, the downward pressure on several emerging markets<br />
resumed in early 2014 as the Federal Reserve finally began to reduce its bond purchases. A further element of volatility was introduced<br />
to emerging markets as Russia annexed the Crimea region in Ukraine in March, causing a sell-off across markets, particularly in Russia.<br />
Eleven out of 21 emerging market countries posted negative returns for the period, with the worst returns coming from Turkey, at<br />
-29.05%, Chile at -27.07% and Peru at -24.88%. Standout performers included Greece and Egypt, which returned 56.48% and 32.48%,<br />
respectively. From a sector standpoint, the best performers were information technology and consumer discretionary, returning<br />
17.20% and 12.43%, respectively. The lowest returns were in the materials and energy sectors, which returned -11.18% and -9.51%,<br />
respectively.<br />
INVESTMENT PERFORMANCE<br />
PORTFOLIO MANAGER<br />
AVERAGE ANNUAL RETURNS for periods ended March 31, 2014<br />
TOTAL RETURN<br />
ONE<br />
YEAR<br />
THREE<br />
YEAR<br />
FIVE<br />
YEAR<br />
SINCE<br />
INCEPTION<br />
EMERGING MARKETS EQUITY INDEX –1.57% –3.22% 13.47% 3.60%<br />
MSCI EMERGING MARKETS INDEX SM –1.43 –2.86 14.48 4.62<br />
Performance reflects voluntary and contractual fee waivers and reimbursements in effect.<br />
In their absence, performance would be reduced. Performance quoted represents past<br />
performance and does not guarantee future results. Investment return and principal<br />
value will fluctuate so that shares, when redeemed, may be worth more or less than their<br />
original cost. Current performance may be lower or higher than that shown here. The one<br />
year total return will differ from the total return in the Financial Highlights. The<br />
Financial Highlights’ total return has been adjusted to reflect performance in conformity<br />
with U.S. GAAP principles due to the movement of open foreign markets at a time when<br />
the U.S. market was closed. Performance data current to the most recent month-end is<br />
available at northernfunds.com.<br />
GROWTH OF A $10,000 INVESTMENT<br />
$16,000<br />
$13,238 $14,310<br />
The MSCI Emerging Markets <strong>Index</strong> SM is a<br />
$14,000<br />
free float-adjusted market capitalization<br />
index that is designed to measure equity<br />
$12,000<br />
market performance in the global emerging<br />
$10,000<br />
markets.<br />
$8,000<br />
$6,000<br />
4/25/06<br />
3/31/14<br />
EMERGING MARKETS EQUITY INDEX FUND<br />
MSCI EMERGING MARKETS INDEX SM<br />
Portfolio composition is subject to change.<br />
Information about Investment<br />
Considerations can be found on page 143.<br />
STEVEN J. SANTICCIOLI<br />
With <strong>Northern</strong> Trust since 2003<br />
FUND FACTS (as of 3/31/14)<br />
TICKER SYMBOL<br />
NOEMX<br />
INCEPTION DATE 04/25/06<br />
NET ASSETS<br />
$1.9 BILLION<br />
NETASSETVALUE $11.16<br />
DIVIDEND SCHEDULE ANNUALLY<br />
GROSS EXPENSE RATIO (1) 0.73%<br />
NET EXPENSE RATIO 0.30%<br />
(1) The Gross Expense Ratio presented is based on the<br />
gross expense ratio as reported in the Fund’s<br />
current prospectus, which may differ from the gross<br />
expense ratio presented in the Fund’s financial<br />
highlights.<br />
The graph and table do not reflect the deduction<br />
of taxes that a shareholder would pay on Fund<br />
distributions or the redemption of Fund shares.<br />
Unlike the <strong>Index</strong>, the Fund’s total returns are<br />
reduced by operating expenses, such as<br />
transaction costs and management fees.<br />
EQUITY INDEX FUNDS 2 NORTHERN FUNDS ANNUAL REPORT
EQUITY INDEX FUNDS<br />
GLOBAL REAL ESTATE INDEX FUND<br />
(UNAUDITED)<br />
PORTFOLIO MANAGEMENT COMMENTARY<br />
The Global Real Estate <strong>Index</strong> Fund returned 0.03% during the 12-month reporting period ended March 31, 2014, compared with<br />
-0.24% for the Fund’s benchmark, the FTSE ® EPRA ® /NAREIT ® Global <strong>Index</strong>. Real estate securities underperformed relative to the<br />
broader equity market return of 16.55%, as measured by the MSCI ACWI ® <strong>Index</strong>. U.S. real estate securities outperformed non-U.S. real<br />
estate securities. To illustrate, the FTSE EPRA ® /NAREIT ® USA <strong>Index</strong> returned 4.58%, versus -0.38% for the FTSE EPRA ® /NAREIT ®<br />
Developed ex-USA <strong>Index</strong> and -13.47% for the FTSE EPRA ® /NAREIT ® Emerging Markets <strong>Index</strong>.<br />
The underperformance of global real estate securities versus the broader equity markets was due in part to shifting monetary policy.<br />
Real estate performed well early in the period, but fears began to mount in May that the Federal Reserve would foreshadow a tapering<br />
in its asset purchase program by the end of the year. The perceived stance of the Federal Reserve both reduced concerns about inflation<br />
and led to an increase in bond yields, leading investors to reduce their exposure to the high-yielding real estate equity asset class<br />
throughout the summer. Global real estate securities regained some ground in September, when the Federal Reserve announced that it<br />
would defer any tapering in view of weak data and fiscal uncertainty, causing bond yields to drop. In December, the Federal Reserve<br />
announced that it would begin to trim its asset purchases beginning in January, contributing to monetary tightening fears and relatively<br />
poor global real estate performance. Global real estate was generally flat in the first quarter of 2014, as mixed economic data and rising<br />
tensions in Ukraine caused some market volatility, although emerging markets saw a modest rebound after a period of very negative<br />
returns.<br />
The Fund will continue to invest in a sample of securities within the FTSE ® EPRA ® /NAREIT ® Global <strong>Index</strong> in an attempt to closely<br />
track <strong>Index</strong> returns.<br />
INVESTMENT PERFORMANCE<br />
PORTFOLIO MANAGER<br />
AVERAGE ANNUAL RETURNS for periods ended March 31, 2014<br />
TOTAL RETURN<br />
ONE<br />
YEAR<br />
THREE<br />
YEAR<br />
FIVE<br />
YEAR<br />
SINCE<br />
INCEPTION<br />
GLOBAL REAL ESTATE INDEX 0.03% 6.81% 21.21% 2.20%<br />
FTSE ® EPRA ® /NAREIT ® GLOBAL INDEX –0.24 6.80 21.38 2.69<br />
Performance reflects voluntary and contractual fee waivers and reimbursements in effect.<br />
In their absence, performance would be reduced. Performance quoted represents past<br />
performance and does not guarantee future results. Investment return and principal<br />
value will fluctuate so that shares, when redeemed, may be worth more or less than their<br />
original cost. Current performance may be lower or higher than that shown here.<br />
Performance data current to the most recent month-end is available at<br />
northernfunds.com.<br />
GROWTH OF A $10,000 INVESTMENT<br />
$14,000<br />
$12,000<br />
$10,000<br />
$8,000<br />
$6,000<br />
$4,000<br />
$2,000<br />
7/26/06<br />
GLOBAL REAL ESTATE INDEX FUND<br />
FTSE ® EPRA ® /NAREIT ® GLOBAL INDEX<br />
$11,822 $12,264<br />
3/31/14<br />
The FTSE ® EPRA ® /NAREIT ® Global <strong>Index</strong> is<br />
a free float, market capitalization-weighted<br />
real estate index designed to represent<br />
publicly traded equity REITs and listed<br />
property companies globally. Expanded in<br />
December 2008, the FTSE ® EPRA ® /<br />
NAREIT ® Global <strong>Index</strong> covers both<br />
developed and emerging markets, and<br />
represents 36 countries worldwide.<br />
Portfolio composition is subject to change.<br />
Information about Investment<br />
Considerations can be found on page 143.<br />
THOMAS O’BRIEN<br />
With <strong>Northern</strong> Trust since 2004<br />
FUND FACTS (as of 3/31/14)<br />
TICKER SYMBOL<br />
NGREX<br />
INCEPTION DATE 07/26/06<br />
NET ASSETS<br />
$1.4 BILLION<br />
NETASSETVALUE $9.39<br />
DIVIDEND SCHEDULE QUARTERLY<br />
GROSS EXPENSE RATIO (1) 0.73%<br />
NET EXPENSE RATIO 0.50%<br />
(1) The Gross Expense Ratio presented is based on the<br />
gross expense ratio as reported in the Fund’s<br />
current prospectus, which may differ from the gross<br />
expense ratio presented in the Fund’s financial<br />
highlights.<br />
The graph and table do not reflect the deduction<br />
of taxes that a shareholder would pay on Fund<br />
distributions or the redemption of Fund shares.<br />
Unlike the <strong>Index</strong>, the Fund’s total returns are<br />
reduced by operating expenses, such as<br />
transaction costs and management fees.<br />
NORTHERN FUNDS ANNUAL REPORT 3 EQUITY INDEX FUNDS
EQUITY INDEX FUNDS<br />
GLOBAL SUSTAINABILITY INDEX FUND<br />
(UNAUDITED)<br />
PORTFOLIO MANAGEMENT COMMENTARY<br />
The Global Sustainability <strong>Index</strong> Fund returned 18.38% during the 12-month reporting period ended March 31, 2014, compared with<br />
18.37% for the Fund’s benchmark, the MSCI World ESG <strong>Index</strong>. The <strong>Index</strong> slightly underperformed the broader MSCI World <strong>Index</strong>,<br />
which returned 19.07% for the same period. The United States, at approximately 50% of the <strong>Index</strong>, returned 21.14% for the period.<br />
Israel, Finland and Denmark were the strongest performers within the <strong>Index</strong>, returning 49.40%, 44.76% and 43.05%, respectively.<br />
Japan, at nearly 10% of the <strong>Index</strong>, returned 8.97%, while the United Kingdom, at approximately 10% of the <strong>Index</strong>, returned 16.48%.<br />
Developed markets began the period on a strong note, but performance turned negative in the late spring to early summer. Comments<br />
by the Chairman of the Federal Reserve foreshadowed a possible tapering of bond purchases later in 2013, sparking a widespread selloff.<br />
Investors remained wary of Federal Reserve tapering throughout the summer, but markets were boosted in September by the<br />
Federal Reserve’s decision to defer any reduction in purchases in view of weaker data and fiscal uncertainty. Performance remained<br />
strong through the October U.S. government shutdown, as investors anticipated the eventual budget deal. The announcement in<br />
December that the Federal Reserve would begin to taper asset purchases in January 2014 had a relatively muted impact, as the program<br />
was perceived by many to be less dramatic than anticipated. Global developed markets were generally flat-to-slightly positive in the first<br />
quarter of 2014. In January 2014, negative headlines contributed to unfavorable returns globally. The headlines included disappointing<br />
economic data later deemed by some to be a product of cold weather, the beginning of the Federal Reserve’s tapering, and emerging<br />
markets concerns. Late in the quarter, the Russian annexation of the Crimea region of Ukraine escalated investor worries, although<br />
markets were calmed at the end of March by indications that Russia might not pursue further action.<br />
The Fund will continue to invest in a sample of securities within the MSCI World ESG <strong>Index</strong> as it attempts to closely replicate <strong>Index</strong><br />
returns.<br />
INVESTMENT PERFORMANCE<br />
PORTFOLIO MANAGER<br />
AVERAGE ANNUAL RETURNS for periods ended March 31, 2014<br />
TOTAL RETURN<br />
ONE<br />
YEAR<br />
THREE<br />
YEAR<br />
FIVE<br />
YEAR<br />
SINCE<br />
INCEPTION<br />
GLOBAL SUSTAINABILITY INDEX 18.38% 10.52% 18.30% 4.69%<br />
MSCI WORLD ESG INDEX 18.37 10.51 18.50 4.95<br />
Performance reflects voluntary and contractual fee waivers and reimbursements in effect.<br />
In their absence, performance would be reduced. Performance quoted represents past<br />
performance and does not guarantee future results. Investment return and principal<br />
value will fluctuate so that shares, when redeemed, may be worth more or less than their<br />
original cost. Current performance may be lower or higher than that shown here.<br />
Performance data current to the most recent month-end is available at<br />
northernfunds.com.<br />
GROWTH OF A $10,000 INVESTMENT<br />
$14,000<br />
$12,000<br />
$10,000<br />
$8,000<br />
$6,000<br />
$4,000<br />
3/5/08<br />
GLOBAL SUSTAINABILITY INDEX FUND<br />
MSCI WORLD ESG INDEX<br />
$13,205 $13,412<br />
3/31/14<br />
The MSCI WORLD ESG <strong>Index</strong> is a free floatadjusted,<br />
market capitalization-weighted<br />
index comprised of large- and mid-cap<br />
developed companies in Asia Pacific, Europe<br />
and the Middle East, Canada and the United<br />
States. The <strong>Index</strong> holds a broad, diversified<br />
set of global companies, selected based on<br />
regional sector rankings of environmental,<br />
social and governance factors.<br />
Portfolio composition is subject to change.<br />
Information about Investment<br />
Considerations can be found on page 143.<br />
THOMAS O’BRIEN<br />
With <strong>Northern</strong> Trust since 2004<br />
FUND FACTS (as of 3/31/14)<br />
TICKER SYMBOL<br />
NSRIX<br />
INCEPTION DATE 03/05/08<br />
NET ASSETS<br />
$178 MILLION<br />
NETASSETVALUE $11.87<br />
DIVIDEND SCHEDULE ANNUALLY<br />
GROSS EXPENSE RATIO (1) 0.87%<br />
NET EXPENSE RATIO 0.30%<br />
(1) The Gross Expense Ratio presented is based on the<br />
gross expense ratio as reported in the Fund’s<br />
current prospectus, which may differ from the gross<br />
expense ratio presented in the Fund’s financial<br />
highlights.<br />
The graph and table do not reflect the deduction<br />
of taxes that a shareholder would pay on Fund<br />
distributions or the redemption of Fund shares.<br />
Unlike the <strong>Index</strong>, the Fund’s total returns are<br />
reduced by operating expenses, such as<br />
transaction costs and management fees.<br />
EQUITY INDEX FUNDS 4 NORTHERN FUNDS ANNUAL REPORT
EQUITY INDEX FUNDS<br />
INTERNATIONAL EQUITY INDEX FUND<br />
(UNAUDITED)<br />
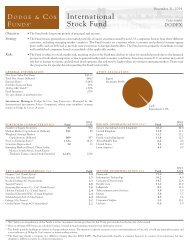
PORTFOLIO MANAGEMENT COMMENTARY<br />
The International <strong>Equity</strong> <strong>Index</strong> Fund returned 17.32% during the 12-month reporting period ended March 31, 2014, which compares<br />
with the 17.56% return of its benchmark, the MSCI EAFE ® <strong>Index</strong>. International equities underperformed the U.S. stock market, as<br />
measured by the 21.86% gain of the S&P 500 ® <strong>Index</strong>. The countries with the strongest returns were Italy, Spain and Ireland, which<br />
gained 52.95%, 45.72% and 42.91%, respectively. The countries that detracted the most from <strong>Index</strong> returns were Singapore and<br />
Australia, which returned -2.17% and 1.17%. From a sector standpoint, the top returns came from the telecommunications services,<br />
utilities and consumer discretionary sectors, which returned 34.86%, 23.26% and 23.18%. The weakest sectors were consumer staples<br />
and materials, with returns of 5.88% and 8.67%.<br />
Developed markets began the period on a down note, producing negative returns in the late spring and early summer of 2013. Comments<br />
by former Federal Reserve Chairman Ben Bernanke suggested that the Federal Reserve could begin to taper its bond purchases by<br />
the end of the year, sparking a widespread sell-off in global financial assets. Investors remained fearful of tapering throughout the<br />
summer, so the Federal Reserve’s surprising decision not to reduce asset purchases at the September meeting represented a positive<br />
development for the markets. The rally continued through the fourth quarter despite the U.S. government shutdown in October, as<br />
investors anticipated the eventual budget deal that occurred later in the month. Similarly, the Federal Reserve’s December announcement<br />
that it would begin to taper asset purchases beginning in January 2014 had only a mild impact.<br />
Global developed markets were generally flat-to-slightly positive during the first quarter of 2014. In January, several major headlines<br />
contributed to negative returns globally, including disappointing economic data — which was later deemed by some to be a product of<br />
cold weather — as well as Federal Reserve tapering and disruptions in several emerging markets. Late in the quarter, the Russian<br />
annexation of the Crimea region of Ukraine escalated investor worry, though markets were calmed at the end of March by indications<br />
that Russia might not pursue further action.<br />
INVESTMENT PERFORMANCE<br />
PORTFOLIO MANAGER<br />
AVERAGE ANNUAL RETURNS for periods ended March 31, 2014<br />
TOTAL RETURN<br />
ONE<br />
YEAR<br />
THREE<br />
YEAR<br />
FIVE<br />
YEAR<br />
SINCE<br />
INCEPTION<br />
INTERNATIONAL EQUITY INDEX 17.32% 7.11% 15.72% 5.13%<br />
MSCI EAFE ® INDEX 17.56 7.21 16.02 5.38<br />
Performance reflects voluntary and contractual fee waivers and reimbursements in effect.<br />
In their absence, performance would be reduced. Performance quoted represents past<br />
performance and does not guarantee future results. Investment return and principal<br />
value will fluctuate so that shares, when redeemed, may be worth more or less than their<br />
original cost. Current performance may be lower or higher than that shown here.<br />
Performance data current to the most recent month-end is available at<br />
northernfunds.com.<br />
GROWTH OF A $10,000 INVESTMENT<br />
$17,000<br />
$15,000<br />
$13,000<br />
$11,000<br />
$9,000<br />
$7,000<br />
3/22/05<br />
INTERNATIONAL EQUITY INDEX FUND<br />
MSCI EAFE ® INDEX<br />
$15,701 $16,052<br />
3/31/14<br />
The MSCI EAFE ® <strong>Index</strong> is a free floatadjusted<br />
market capitalization index that is<br />
designed to measure the equity performance<br />
of developed markets, excluding the U.S. and<br />
Canada.<br />
Portfolio composition is subject to change.<br />
Information about Investment<br />
Considerations can be found on page 143.<br />
STEVEN J. SANTICCIOLI<br />
With <strong>Northern</strong> Trust since 2003<br />
FUND FACTS (as of 3/31/14)<br />
TICKER SYMBOL<br />
NOINX<br />
INCEPTION DATE 03/22/05<br />
NET ASSETS<br />
$4.6 BILLION<br />
NETASSETVALUE $12.41<br />
DIVIDEND SCHEDULE ANNUALLY<br />
GROSS EXPENSE RATIO (1) 0.63%<br />
NET EXPENSE RATIO 0.25%<br />
(1) The Gross Expense Ratio presented is based on the<br />
gross expense ratio as reported in the Fund’s<br />
current prospectus, which may differ from the gross<br />
expense ratio presented in the Fund’s financial<br />
highlights.<br />
The graph and table do not reflect the deduction<br />
of taxes that a shareholder would pay on Fund<br />
distributions or the redemption of Fund shares.<br />
Unlike the <strong>Index</strong>, the Fund’s total returns are<br />
reduced by operating expenses, such as<br />
transaction costs and management fees.<br />
NORTHERN FUNDS ANNUAL REPORT 5 EQUITY INDEX FUNDS
EQUITY INDEX FUNDS<br />
MID CAP INDEX FUND<br />
(UNAUDITED)<br />
PORTFOLIO MANAGEMENT COMMENTARY<br />
The Mid Cap <strong>Index</strong> Fund returned 21.11% during the 12-month reporting period ended March 31, 2014, which compares with the<br />
21.24% return of its benchmark, the S&P MidCap 400 ® <strong>Index</strong>. Mid-cap stocks slightly underperformed large caps, as measured by the<br />
21.86% gain of the S&P 500 ® <strong>Index</strong>. Health care and consumer discretionary were the best-performing sectors, returning 28.68% and<br />
27.50%, respectively. Utilities and financials generated the weakest relative performance with returns of 15.48% and 15.70%.<br />
U.S. equities began the period on a down note, producing negative returns in the late spring and early summer of 2013. Comments by<br />
former Federal Reserve Chairman Ben Bernanke suggested that the Federal Reserve could begin to taper its bond purchases by the end<br />
of the year, sparking a widespread sell-off in global financial assets. Investors remained fearful of tapering throughout the summer, so<br />
the Federal Reserve’s surprising decision not to reduce asset purchases at the September meeting represented a positive development for<br />
the markets. The rally continued through the fourth quarter despite the U.S. government shutdown in October, as investors anticipated<br />
the eventual budget deal that occurred later in the month. Similarly, the Federal Reserve’s December announcement that it would begin<br />
to taper asset purchases beginning in January 2014 had only a mild impact.<br />
The stock market was generally flat-to-slightly positive during the first quarter of 2014. In January, several major headlines contributed<br />
to negative returns globally, including disappointing economic data — which was later deemed by some to be a product of cold<br />
weather — as well as Federal Reserve tapering and disruptions in several emerging markets. Late in the quarter, the Russian annexation<br />
of the Crimea region of Ukraine escalated investor worry, though markets were calmed at the end of March by indications that Russia<br />
might not pursue further action.<br />
INVESTMENT PERFORMANCE<br />
PORTFOLIO MANAGER<br />
AVERAGE ANNUAL RETURNS for periods ended March 31, 2014<br />
TOTAL RETURN<br />
ONE<br />
YEAR<br />
THREE<br />
YEAR<br />
FIVE<br />
YEAR<br />
SINCE<br />
INCEPTION<br />
MID CAP INDEX 21.11% 13.15% 24.58% 9.72%<br />
S&P MIDCAP 400 ® INDEX 21.24 13.37 24.86 10.08<br />
Performance reflects voluntary and contractual fee waivers and reimbursements in effect.<br />
In their absence, performance would be reduced. Performance quoted represents past<br />
performance and does not guarantee future results. Investment return and principal<br />
value will fluctuate so that shares, when redeemed, may be worth more or less than their<br />
original cost. Current performance may be lower or higher than that shown here.<br />
Performance data current to the most recent month-end is available at<br />
northernfunds.com.<br />
GROWTH OF A $10,000 INVESTMENT<br />
$25,000<br />
$20,000<br />
$15,000<br />
$10,000<br />
$5,000<br />
3/22/05<br />
MID CAP INDEX FUND<br />
S&P MIDCAP 400 ® INDEX<br />
$23,100 $23,798<br />
3/31/14<br />
The S&P MidCap 400 ® <strong>Index</strong> is an<br />
unmanaged index consisting of 400 mid-cap<br />
stocks. The S&P MidCap 400 ® <strong>Index</strong> covers<br />
over 7% of the U.S. equities market.<br />
Portfolio composition is subject to change.<br />
Information about Investment<br />
Considerations can be found on page 143.<br />
BRENT REEDER<br />
With <strong>Northern</strong> Trust since 1993<br />
FUND FACTS (as of 3/31/14)<br />
TICKER SYMBOL<br />
NOMIX<br />
INCEPTION DATE 03/22/05<br />
NET ASSETS<br />
$1.3 BILLION<br />
NETASSETVALUE $17.40<br />
DIVIDEND SCHEDULE ANNUALLY<br />
GROSS EXPENSE RATIO (1) 0.52%<br />
NET EXPENSE RATIO 0.15%<br />
(1) The Gross Expense Ratio presented is based on the<br />
gross expense ratio as reported in the Fund’s<br />
current prospectus, which may differ from the gross<br />
expense ratio presented in the Fund’s financial<br />
highlights.<br />
The graph and table do not reflect the deduction<br />
of taxes that a shareholder would pay on Fund<br />
distributions or the redemption of Fund shares.<br />
Unlike the <strong>Index</strong>, the Fund’s total returns are<br />
reduced by operating expenses, such as<br />
transaction costs and management fees.<br />
EQUITY INDEX FUNDS 6 NORTHERN FUNDS ANNUAL REPORT
EQUITY INDEX FUNDS<br />
SMALL CAP INDEX FUND<br />
(UNAUDITED)<br />
PORTFOLIO MANAGEMENT COMMENTARY<br />
The Small Cap <strong>Index</strong> Fund returned 24.77% during the 12-month reporting period ended March 31, 2014, closely tracking the 24.90%<br />
return of the Russell 2000 ® <strong>Index</strong>. Small-cap stocks outperformed large caps, based on the 22.41% return of the Russell 1000 ® <strong>Index</strong>.<br />
The top-performing sectors in the Russell 2000 ® <strong>Index</strong> were health care and consumer staples, which returned 36.78% and 33.19%,<br />
respectively. Utilities and materials generated the weakest relative performance with returns of 13.00% and 14.52%.<br />
U.S. equities began the reporting period on a down note, producing negative returns in the late spring and early summer of 2013.<br />
Comments by former Federal Reserve Chairman Ben Bernanke suggested that the Federal Reserve could begin to taper its bond purchases<br />
by the end of the year, sparking a widespread sell-off in global financial assets. Investors remained fearful of tapering throughout<br />
the summer, so the Federal Reserve’s surprising decision not to reduce asset purchases at the September meeting represented a positive<br />
development for the markets. The rally continued through the fourth quarter despite the U.S. government shutdown in October, as<br />
investors anticipated the eventual budget deal that occurred later in the month. Similarly, the Federal Reserve’s December announcement<br />
that it would begin to taper asset purchases beginning in January 2014 had only a mild impact.<br />
The stock market was generally flat-to-slightly positive during the first quarter of 2014. In January, several major headlines contributed<br />
to negative returns globally, including disappointing economic data — which was later deemed by some to be a product of cold<br />
weather — as well as Federal Reserve tapering and disruptions in several emerging markets. Late in the quarter, the Russian annexation<br />
of the Crimea region of Ukraine escalated investor worry, though markets were calmed at the end of March by indications that Russia<br />
might not pursue further action.<br />
INVESTMENT PERFORMANCE<br />
PORTFOLIO MANAGER<br />
AVERAGE ANNUAL RETURNS for periods ended March 31, 2014<br />
TOTAL RETURN<br />
ONE<br />
YEAR<br />
FIVE<br />
YEAR<br />
TEN<br />
YEAR<br />
SINCE<br />
INCEPTION<br />
SMALL CAP INDEX 24.77% 24.06% 8.21% 7.99%<br />
RUSSELL 2000 ® INDEX 24.90 24.31 8.53 8.58<br />
Performance reflects voluntary and contractual fee waivers and reimbursements in effect.<br />
In their absence, performance would be reduced. Performance quoted represents past<br />
performance and does not guarantee future results. Investment return and principal<br />
value will fluctuate so that shares, when redeemed, may be worth more or less than their<br />
original cost. Current performance may be lower or higher than that shown here.<br />
Performance data current to the most recent month-end is available at<br />
northernfunds.com.<br />
GROWTH OF A $10,000 INVESTMENT<br />
$38,000<br />
$32,000<br />
$26,000<br />
$20,000<br />
$30,649 $33,219<br />
The Russell 2000 ® <strong>Index</strong> is an unmanaged<br />
index which measures the performance of<br />
the 2,000 smallest companies in the Russell<br />
3000 ® <strong>Index</strong> based on market capitalization.<br />
Portfolio composition is subject to change.<br />
BRENT REEDER<br />
With <strong>Northern</strong> Trust since 1993<br />
FUND FACTS (as of 3/31/14)<br />
TICKER SYMBOL<br />
NSIDX<br />
INCEPTION DATE 09/03/99<br />
NET ASSETS<br />
$986 MILLION<br />
NETASSETVALUE $12.38<br />
DIVIDEND SCHEDULE ANNUALLY<br />
GROSS EXPENSE RATIO (1) 0.60%<br />
NET EXPENSE RATIO 0.15%<br />
(1) The Gross Expense Ratio presented is based on the<br />
gross expense ratio as reported in the Fund’s current<br />
prospectus, which may differ from the gross expense<br />
ratio presented in the Fund’s financial highlights.<br />
$14,000<br />
$8,000<br />
9/3/99<br />
3/31/14<br />
Information about Investment<br />
Considerations can be found on page 143.<br />
The graph and table do not reflect the deduction<br />
of taxes that a shareholder would pay on Fund<br />
distributions or the redemption of Fund shares.<br />
Unlike the <strong>Index</strong>, the Fund’s total returns are<br />
reduced by operating expenses, such as<br />
transaction costs and management fees.<br />
SMALL CAP INDEX FUND<br />
RUSSELL 2000 ® INDEX<br />
NORTHERN FUNDS ANNUAL REPORT 7 EQUITY INDEX FUNDS
EQUITY INDEX FUNDS<br />
STOCK INDEX FUND<br />
(UNAUDITED)<br />
PORTFOLIO MANAGEMENT COMMENTARY<br />
The Stock <strong>Index</strong> Fund returned 21.73% during the 12-month reporting period ended March 31, 2014, in line with the 21.86% return of<br />
its benchmark, the S&P 500 ® <strong>Index</strong>. Large-cap equities slightly outperformed mid caps as measured by the 21.24% return of the S&P<br />
MidCap 400 ® <strong>Index</strong>, but underperformed small caps as gauged by the 27.81% return of the S&P SmallCap 600 ® <strong>Index</strong>. All sectors delivered<br />
positive returns in the period. The top-performing sectors in the <strong>Index</strong> were health care and industrials, which returned 29.24%<br />
and 27.29%, respectively. Telecommunications services, which returned 2.32%, represented the bottom-performing sector. All other<br />
sectors returned at least 10%.<br />
U.S. equities began the period on a down note, producing negative returns in the late spring and early summer of 2013. Comments by<br />
former Federal Reserve Chairman Ben Bernanke suggested that the Federal Reserve could begin to taper its bond purchases by the end<br />
of the year, sparking a widespread sell-off in global financial assets. Investors remained fearful of tapering throughout the summer, so<br />
the Federal Reserve’s surprising decision not to reduce asset purchases at the September meeting represented a positive development for<br />
the markets. The rally continued through the fourth quarter despite the U.S. government shutdown in October, as investors anticipated<br />
the eventual budget deal that occurred later in the month. Similarly, the Federal Reserve’s December announcement that it would begin<br />
to taper asset purchases beginning in January 2014 had only a mild impact.<br />
The stock market was generally flat-to-slightly positive during the first quarter of 2014. In January, several major headlines contributed<br />
to negative returns globally, including disappointing economic data — which was later deemed by some to be a product of cold<br />
weather — as well as Federal Reserve tapering and disruptions in several emerging markets. Late in the quarter, the Russian annexation<br />
of the Crimea region of Ukraine escalated investor worry, though markets were calmed at the end of March by indications that Russia<br />
might not pursue further action.<br />
INVESTMENT PERFORMANCE<br />
PORTFOLIO MANAGER<br />
AVERAGE ANNUAL RETURNS for periods ended March 31, 2014<br />
TOTAL RETURN<br />
ONE<br />
YEAR<br />
FIVE<br />
YEAR<br />
TEN<br />
YEAR<br />
SINCE<br />
INCEPTION<br />
STOCK INDEX 21.73% 20.95% 7.18% 7.32%<br />
S&P 500 ® INDEX 21.86 21.16 7.42 7.85<br />
Performance reflects voluntary and contractual fee waivers and reimbursements in effect.<br />
In their absence, performance would be reduced. Performance quoted represents past<br />
performance and does not guarantee future results. Investment return and principal<br />
value will fluctuate so that shares, when redeemed, may be worth more or less than their<br />
original cost. Current performance may be lower or higher than that shown here.<br />
Performance data current to the most recent month-end is available at<br />
northernfunds.com.<br />
GROWTH OF A $10,000 INVESTMENT<br />
$40,000<br />
$35,000<br />
$30,000<br />
$25,000<br />
$20,000<br />
$15,000<br />
$10,000<br />
10/7/96<br />
STOCK INDEX FUND<br />
S&P 500 ® INDEX<br />
$34,360 $37,548<br />
3/31/14<br />
The S&P 500 ® <strong>Index</strong> is an unmanaged index<br />
consisting of 500 stocks and is a widely<br />
recognized common measure of the<br />
performance of the overall U.S. stock<br />
market.<br />
Portfolio composition is subject to change.<br />
Information about Investment<br />
Considerations can be found on page 143.<br />
BRENT REEDER<br />
With <strong>Northern</strong> Trust since 1993<br />
FUND FACTS (as of 3/31/14)<br />
TICKER SYMBOL<br />
NOSIX<br />
INCEPTION DATE 10/07/96<br />
NET ASSETS<br />
$5.6 BILLION<br />
NETASSETVALUE $23.17<br />
DIVIDEND SCHEDULE QUARTERLY<br />
GROSS EXPENSE RATIO (1) 0.39%<br />
NET EXPENSE RATIO 0.10%<br />
(1) The Gross Expense Ratio presented is based on the<br />
gross expense ratio as reported in the Fund’s<br />
current prospectus, which may differ from the gross<br />
expense ratio presented in the Fund’s financial<br />
highlights.<br />
The graph and table do not reflect the deduction<br />
of taxes that a shareholder would pay on Fund<br />
distributions or the redemption of Fund shares.<br />
Unlike the <strong>Index</strong>, the Fund’s total returns are<br />
reduced by operating expenses, such as<br />
transaction costs and management fees.<br />
EQUITY INDEX FUNDS 8 NORTHERN FUNDS ANNUAL REPORT
EQUITY INDEX FUNDS<br />
THIS PAGE INTENTIONALLY LEFT BLANK<br />
NORTHERN FUNDS ANNUAL REPORT 9 EQUITY INDEX FUNDS
EQUITY INDEX FUNDS<br />
STATEMENTS OF ASSETS AND LIABILITIES<br />
Amounts in thousands, except per share data<br />
EMERGING MARKETS<br />
EQUITY<br />
INDEX FUND<br />
GLOBAL REAL<br />
ESTATE INDEX<br />
FUND<br />
ASSETS:<br />
Investments, at cost $1,641,405 (1) $1,148,993 (1)<br />
Investments, at value $1,916,329 (3) $1,374,612 (3)<br />
Cash — —<br />
Cash held at broker 3,062 (5) 842 (5)<br />
Foreign currencies held at broker, at value (restricted $280, $440, $113, $5,097, respectively) 280 (6) 2,434 (6)<br />
Foreign currencies, at value (cost $14,064, $6,614, $318, $24,580, respectively) 14,255 6,661<br />
Dividend income receivable 3,819 4,173<br />
Receivable for foreign tax reclaimable 108 319<br />
Receivable for securities sold 5,746 1,256<br />
Receivable for variation margin on futures contracts 174 185<br />
Receivable for fund shares sold 1,204 856<br />
Receivable from investment adviser 151 55<br />
Unrealized gain on foreign currency exchange contracts 42 86<br />
Prepaid and other assets 3 2<br />
Total Assets 1,945,173 1,391,481<br />
LIABILITIES:<br />
Unrealized loss on foreign currency exchange contracts 7 89<br />
Payable for securities purchased 1,941 1,955<br />
Payable for variation margin on futures contracts 15 8<br />
Payable for fund shares redeemed 6,330 875<br />
Payable to affiliates:<br />
Investment advisory fees 127 92<br />
Administration fees 54 39<br />
Custody and accounting fees 40 30<br />
Shareholder servicing fees 4 22<br />
Transfer agent fees 36 26<br />
Trustee fees 5 3<br />
Accrued other liabilities 84 56<br />
Total Liabilities 8,643 3,195<br />
Net Assets $1,936,530 $1,388,286<br />
ANALYSIS OF NET ASSETS:<br />
Capital stock $1,922,763 $1,869,278<br />
Accumulated undistributed net investment income (loss) (6,836) (28,812)<br />
Accumulated undistributed net realized gain (loss) (255,824) (678,082)<br />
Net unrealized appreciation 276,427 225,902<br />
Net Assets $1,936,530 $1,388,286<br />
Shares Outstanding ($.0001 par value, unlimited authorization) 173,506 147,850<br />
Net Asset Value, Redemption and Offering Price Per Share $11.16 $9.39<br />
(1)<br />
(2)<br />
(3)<br />
(4)<br />
(5)<br />
(6)<br />
Amounts include cost from the Diversified Assets Portfolio of the <strong>Northern</strong> Institutional <strong>Funds</strong> of $11,082, $4,230, $3,015, $39,661, $23,834, $31,475 and<br />
$120,845, respectively.<br />
Amounts include cost from the <strong>Northern</strong> Trust Corp. of $131 and $3,766, respectively.<br />
Amounts include value from the Diversified Assets Portfolio of the <strong>Northern</strong> Institutional <strong>Funds</strong> of $11,082, $4,230, $3,015, $39,661, $23,834, $31,475 and<br />
$120,845, respectively.<br />
Amounts include value from the <strong>Northern</strong> Trust Corp. of $157 and $4,664, respectively.<br />
The restricted cash amounts for each international fund are $1,264, $490, $130 and $0, respectively.<br />
Costs associated with foreign currencies held at broker are $285, $2,416, $307 and $9,138, respectively.<br />
See Notes to the Financial Statements.<br />
EQUITY INDEX FUNDS 10 NORTHERN FUNDS ANNUAL REPORT
MARCH 31, 2014<br />
GLOBAL<br />
SUSTAINABILITY<br />
INDEX FUND<br />
INTERNATIONAL<br />
EQUITY<br />
INDEX FUND<br />
MID CAP<br />
INDEX FUND<br />
SMALL CAP<br />
INDEX FUND<br />
STOCK<br />
INDEX FUND<br />
$128,638 (1) (2) $3,786,834 (1) $937,066 (1) $686,880 (1) (1) (2)<br />
$3,535,885<br />
$175,926 (3) (4) $4,556,621 (3) $1,315,427 (3) $990,529 (3) (3) (4)<br />
$5,627,907<br />
— — — — 4<br />
208 (5) 902 (5) — — —<br />
311 (6) 9,177 (6) — — —<br />
319 24,955 — — —<br />
440 17,684 993 936 6,313<br />
133 4,629 — — —<br />
— 4,968 13 759 679<br />
22 233 394 691 1,056<br />
372 3,977 540 433 2,903<br />
18 322 88 75 311<br />
13 112 — — —<br />
1 2 1 1 5<br />
177,763 4,623,582 1,317,456 993,424 5,639,178<br />
11 480 — — —<br />
12 12,328 485 7,074 —<br />
2 88 2 125 —<br />
— 1,098 586 404 2,640<br />
12 218 50 38 107<br />
5 131 37 28 160<br />
7 91 23 7 31<br />
7 27 42 23 30<br />
3 87 25 19 107<br />
2 11 3 7 14<br />
27 62 35 34 104<br />
88 14,621 1,288 7,759 3,193<br />
$177,675 $4,608,961 $1,316,168 $985,665 $5,635,985<br />
$131,844 $4,195,096 $925,243 $682,694 $3,611,949<br />
1,661 48,441 3,812 2,057 2,368<br />
(3,215) (406,422) 8,467 (2,527) (71,483)<br />
47,385 771,846 378,646 303,441 2,093,151<br />
$177,675 $4,608,961 $1,316,168 $985,665 $5,635,985<br />
14,966 371,482 75,651 79,636 243,253<br />
$11.87 $12.41 $17.40 $12.38 $23.17<br />
See Notes to the Financial Statements.<br />
NORTHERN FUNDS ANNUAL REPORT 11 EQUITY INDEX FUNDS
EQUITY INDEX FUNDS<br />
STATEMENTS OF OPERATIONS<br />
Amounts in thousands<br />
INVESTMENT INCOME:<br />
EMERGING MARKETS<br />
EQUITY<br />
INDEX FUND<br />
GLOBAL REAL<br />
ESTATE INDEX<br />
FUND<br />
Dividend income $53,617 (1) (2) (1) (3)<br />
$39,250<br />
Interest income 60 77<br />
Total Investment Income 53,677 39,327<br />
EXPENSES:<br />
Investment advisory fees 7,367 4,886<br />
Administration fees 3,158 2,094<br />
Custody fees 1,930 1,292<br />
Accounting fees 231 160<br />
Transfer agent fees 2,105 1,396<br />
Registration fees 25 27<br />
Printing fees 52 46<br />
Professional fees 58 46<br />
Shareholder servicing fees 135 120<br />
Trustee fees 31 21<br />
Interest expense 4 —<br />
Other 108 35<br />
Total Expenses 15,204 10,123<br />
Less expenses reimbursed by investment adviser (8,882) (3,149)<br />
Net Expenses 6,322 6,974<br />
Net Investment Income 47,355 32,353<br />
NET REALIZED AND UNREALIZED GAINS (LOSSES):<br />
Net realized gains (losses) on:<br />
Investments (99,374) (2,762)<br />
Futures contracts 3,308 6,612<br />
Foreign currency transactions (1,474) (1,283)<br />
Net change in unrealized appreciation (depreciation) on:<br />
Investments 2,304 (32,817)<br />
Futures contracts 1,446 (348)<br />
Foreign currency translations 264 59<br />
Net Gains (Losses) (93,526) (30,539)<br />
Net Increase (Decrease) in Net Assets Resulting from Operations $(46,171) $1,814<br />
(1)<br />
(2)<br />
(3)<br />
(4)<br />
(5)<br />
(6)<br />
Amounts include dividend income from the Diversified Assets Portfolio of the <strong>Northern</strong> Institutional <strong>Funds</strong> of $1, $2, $4, $3, $2 and $10, respectively.<br />
Net of $6,624 in non-reclaimable foreign withholding taxes.<br />
Net of $2,417 in non-reclaimable foreign withholding taxes.<br />
Amount includes dividend income from the Diversified Assets Portfolio of the <strong>Northern</strong> Institutional <strong>Funds</strong> of which the amount is less than $1.<br />
Net of $206 in non-reclaimable foreign withholding taxes.<br />
Net of $10,020 in non-reclaimable foreign withholding taxes.<br />
See Notes to the Financial Statements.<br />
EQUITY INDEX FUNDS 12 NORTHERN FUNDS ANNUAL REPORT
FOR THE FISCAL YEAR ENDED MARCH 31, 2014<br />
GLOBAL<br />
SUSTAINABILITY<br />
INDEX FUND<br />
INTERNATIONAL<br />
EQUITY<br />
INDEX FUND<br />
MID CAP<br />
INDEX FUND<br />
SMALL CAP<br />
INDEX FUND<br />
STOCK<br />
INDEX FUND<br />
$4,551 (4) (5) $130,182 (1) (6) $16,630 (1) $10,579 (1) $108,123 (1)<br />
2 — 1 2 8<br />
4,553 130,182 16,631 10,581 108,131<br />
531 8,609 2,309 1,756 5,247<br />
228 5,166 1,731 1,317 7,871<br />
174 3,135 179 187 579<br />
35 364 135 108 545<br />
152 3,444 1,154 878 5,247<br />
23 55 34 32 49<br />
12 48 31 34 81<br />
35 59 35 36 93<br />
42 140 146 96 140<br />
11 33 10 10 62<br />
— — — — —<br />
11 30 12 15 56<br />
1,254 21,083 5,776 4,469 19,970<br />
(796) (12,496) (4,062) (3,164) (14,777)<br />
458 8,587 1,714 1,305 5,193<br />
4,095 121,595 14,917 9,276 102,938<br />
1,195 (8,364) 46,383 32,166 48,098<br />
574 6,762 4,244 6,046 25,686<br />
11 (857) — — —<br />
19,716 416,496 157,480 145,279 856,293<br />
44 2,078 (452) (614) (659)<br />
22 462 — — —<br />
21,562 416,577 207,655 182,877 929,418<br />
$25,657 $538,172 $222,572 $192,153 $1,032,356<br />
See Notes to the Financial Statements.<br />
NORTHERN FUNDS ANNUAL REPORT 13 EQUITY INDEX FUNDS
EQUITY INDEX FUNDS<br />
STATEMENTS OF CHANGES IN NET ASSETS<br />
EMERGING MARKETS<br />
EQUITY<br />
INDEX FUND<br />
GLOBAL REAL<br />
ESTATE INDEX FUND<br />
Amounts in thousands 2014 2013 2014 2013<br />
OPERATIONS:<br />
Net investment income $47,355 $36,929 $32,353 $25,971<br />
Net realized gains (losses) (97,540) (20,877) 2,567 (3,729)<br />
Net change in unrealized appreciation (depreciation) 4,014 14,263 (33,106) 177,214<br />
Net Increase (Decrease) in Net Assets Resulting from Operations (46,171) 30,315 1,814 199,456<br />
CAPITAL SHARE TRANSACTIONS:<br />
Net increase (decrease) in net assets resulting from capital share transactions (118,621) 464,532 82,641 459,549<br />
Net Increase (Decrease) in Net Assets Resulting from Capital Share Transactions (118,621) 464,532 82,641 459,549<br />
DISTRIBUTIONS PAID:<br />
From net investment income (42,947) (44,000) (45,432) (38,098)<br />
From net realized gains — — — —<br />
Total Distributions Paid (42,947) (44,000) (45,432) (38,098)<br />
Total Increase (Decrease) in Net Assets (207,739) 450,847 39,023 620,907<br />
NET ASSETS:<br />
Beginning of year 2,144,269 1,693,422 1,349,263 728,356<br />
End of year $1,936,530 $2,144,269 $1,388,286 $1,349,263<br />
Accumulated Undistributed Net Investment Income (Loss) $(6,836) $(10,030) $(28,812) $(15,992)<br />
See Notes to the Financial Statements.<br />
EQUITY INDEX FUNDS 14 NORTHERN FUNDS ANNUAL REPORT
FOR THE FISCAL YEARS ENDED MARCH 31,<br />
GLOBAL<br />
SUSTAINABILITY<br />
INDEX FUND<br />
INTERNATIONAL<br />
EQUITY<br />
INDEX FUND<br />
MID CAP<br />
INDEX FUND<br />
SMALL CAP<br />
INDEX FUND<br />
STOCK<br />
INDEX FUND<br />
2014 2013 2014 2013 2014 2013 2014 2013 2014 2013<br />
$4,095 $2,714 $121,595 $55,189 $14,917 $10,907 $9,276 $9,253 $102,938 $81,256<br />
1,780 (778) (2,459) (14,628) 50,627 20,720 38,212 17,258 73,784 (35,889)<br />
19,782 12,104 419,036 183,642 157,028 108,004 144,665 77,744 855,634 519,559<br />
25,657 14,040 538,172 224,203 222,572 139,631 192,153 104,255 1,032,356 564,926<br />
20,170 9,173 1,688,484 624,670 161,685 196,911 72,969 160,452 (108,146) 1,058,659<br />
20,170 9,173 1,688,484 624,670 161,685 196,911 72,969 160,452 (108,146) 1,058,659<br />
(2,889) (2,800) (83,000) (53,302) (12,500) (9,993) (7,555) (9,996) (101,707) (80,033)<br />
— — — — (35,929) (17,408) (35,014) (4,381) (17,304) —<br />
(2,889) (2,800) (83,000) (53,302) (48,429) (27,401) (42,569) (14,377) (119,011) (80,033)<br />
42,938 20,413 2,143,656 795,571 335,828 309,141 222,553 250,330 805,199 1,543,552<br />
134,737 114,324 2,465,305 1,669,734 980,340 671,199 763,112 512,782 4,830,786 3,287,234<br />
$177,675 $134,737 $4,608,961 $2,465,305 $1,316,168 $980,340 $985,665 $763,112 $5,635,985 $4,830,786<br />
$1,661 $471 $48,441 $10,562 $3,812 $2,136 $2,057 $574 $2,368 $2,115<br />
See Notes to the Financial Statements.<br />
NORTHERN FUNDS ANNUAL REPORT 15 EQUITY INDEX FUNDS
EQUITY INDEX FUNDS<br />
FINANCIAL HIGHLIGHTS<br />
EMERGING MARKETS EQUITY INDEX FUND<br />
Selected per share data 2014 2013 2012 2011 2010<br />
Net Asset Value, Beginning of Year $11.58 $11.65 $13.06 $11.31 $6.46<br />
INCOME (LOSS) FROM INVESTMENT OPERATIONS:<br />
Net investment income 0.25 0.23 0.22 0.15 0.07<br />
Net realized and unrealized gains (losses) (0.44) (0.03) (1.48) 1.80 4.90<br />
Total from Investment Operations (0.19) 0.20 (1.26) 1.95 4.97<br />
LESS DISTRIBUTIONS PAID:<br />
From net investment income (1) (0.23) (0.27) (0.15) (0.20) (0.12)<br />
Total Distributions Paid (0.23) (0.27) (0.15) (0.20) (0.12)<br />
Net Asset Value, End of Year $11.16 $11.58 $11.65 $13.06 $11.31<br />
Total Return (2) (1.66)% 1.67% (9.34)% 17.24% 77.02%<br />
SUPPLEMENTAL DATA AND RATIOS:<br />
Net assets, in thousands, end of year $1,936,530 $2,144,269 $1,693,422 $1,614,849 $1,368,577<br />
Ratio to average net assets of:<br />
Expenses, net of reimbursements and credits 0.30% (3) 0.30% (3) 0.61% (3) 0.72% (3) 0.72%<br />
Expenses, before reimbursements and credits 0.72% 0.73% 0.73% 0.72% 0.72%<br />
Net investment income, net of reimbursements and credits 2.25% (3) 2.08% (3) 1.90% (3) 1.38% (3) 1.07%<br />
Net investment income, before reimbursements and credits 1.83% 1.65% 1.78% 1.38% 1.07%<br />
Portfolio Turnover Rate 32.31% 26.98% 33.19% 40.61% 13.07%<br />
(1)<br />
(2)<br />
(3)<br />
Distributions to shareholders from net investment income include amounts relating to foreign currency transactions which are treated as ordinary income for federal<br />
income tax purposes.<br />
Assumes investment at net asset value at the beginning of the year, reinvestment of all dividends and distributions, and a complete redemption of the investment at net<br />
asset value at the end of the year.<br />
The net expenses and net investment income ratios include additional reimbursements of advisory fees incurred in connection with the investment of uninvested cash in<br />
affiliated money market funds of approximately $5,000, $12,000, $3,000 and $8,000, which represent less than 0.005 percent of average net assets for the fiscal<br />
years ended March 31, 2014, 2013, 2012 and 2011, respectively. Absent the additional reimbursements, net investment income and reimbursements wouldhave<br />
been decreased and net expenses increased by a corresponding amount.<br />
See Notes to the Financial Statements.<br />
EQUITY INDEX FUNDS 16 NORTHERN FUNDS ANNUAL REPORT
FOR THE FISCAL YEARS ENDED MARCH 31,<br />
GLOBAL REAL ESTATE INDEX FUND<br />
Selected per share data 2014 2013 2012 2011 2010<br />
Net Asset Value, Beginning of Year $9.70 $8.38 $8.47 $7.37 $4.14<br />
INCOME (LOSS) FROM INVESTMENT OPERATIONS:<br />
Net investment income 0.22 0.24 0.18 0.17 0.17<br />
Net realized and unrealized gains (losses) (0.23) 1.40 (0.08) 1.10 3.23<br />
Total from Investment Operations (0.01) 1.64 0.10 1.27 3.40<br />
LESS DISTRIBUTIONS PAID:<br />
From net investment income (1) (0.30) (0.32) (0.19) (0.17) (0.17)<br />
Total Distributions Paid (0.30) (0.32) (0.19) (0.17) (0.17)<br />
Net Asset Value, End of Year $9.39 $9.70 $8.38 $8.47 $7.37<br />
Total Return (2) 0.03% 20.11% 1.42% 17.52% 82.69%<br />
SUPPLEMENTAL DATA AND RATIOS:<br />
Net assets, in thousands, end of year $1,388,286 $1,349,263 $728,356 $651,181 $496,724<br />
Ratio to average net assets of:<br />
Expenses, net of reimbursements and credits 0.50% (3) 0.50% (3) 0.61% (3) 0.65% (3) 0.65%<br />
Expenses, before reimbursements and credits 0.73% 0.73% 0.74% 0.74% 0.75%<br />
Net investment income, net of reimbursements and credits 2.32% (3) 2.52% (3) 2.27% (3) 2.01% (3) 2.64%<br />
Net investment income, before reimbursements and credits 2.09% 2.29% 2.14% 1.92% 2.54%<br />
Portfolio Turnover Rate 9.14% 7.75% 5.02% 4.56% 21.50%<br />
(1)<br />
(2)<br />
(3)<br />
Distributions to shareholders from net investment income include amounts relating to foreign currency transactions which are treated as ordinary income for federal<br />
income tax purposes.<br />
Assumes investment at net asset value at the beginning of the year, reinvestment of all dividends and distributions, and a complete redemption of the investment at net<br />
asset value at the end of the year.<br />
The net expenses and net investment income ratios include additional reimbursements of advisory fees incurred in connection with the investment of uninvested cash in<br />
affiliated money market funds of approximately $12,000, $33,000, $3,000 and $13,000, which represent less than 0.005 percent of average net assets for the<br />
fiscal years ended March 31, 2014, 2013, 2012 and 2011, respectively. Absent the additional reimbursements, net investment income and reimbursements would<br />
have been decreased and net expenses increased by a corresponding amount.<br />
See Notes to the Financial Statements.<br />
NORTHERN FUNDS ANNUAL REPORT 17 EQUITY INDEX FUNDS
EQUITY INDEX FUNDS<br />
FINANCIAL HIGHLIGHTS continued<br />
GLOBAL SUSTAINABILITY INDEX FUND<br />
Selected per share data 2014 2013 2012 2011 2010<br />
Net Asset Value, Beginning of Year $10.20 $9.26 $9.37 $8.53 $5.62<br />
INCOME (LOSS) FROM INVESTMENT OPERATIONS:<br />
Net investment income 0.29 0.24 0.17 0.14 0.12<br />
Net realized and unrealized gains (losses) 1.59 0.94 (0.12) 0.83 2.91<br />
Total from Investment Operations 1.88 1.18 0.05 0.97 3.03<br />
LESS DISTRIBUTIONS PAID:<br />
From net investment income (1) (0.21) (0.24) (0.16) (0.13) (0.12)<br />
Total Distributions Paid (0.21) (0.24) (0.16) (0.13) (0.12)<br />
Net Asset Value, End of Year $11.87 $10.20 $9.26 $9.37 $8.53<br />
Total Return (2) 18.38% 13.13% 0.81% 11.49% 53.91%<br />
SUPPLEMENTAL DATA AND RATIOS:<br />
Net assets, in thousands, end of year $177,675 $134,737 $114,324 $99,201 $72,981<br />
Ratio to average net assets of:<br />
Expenses, net of reimbursements and credits 0.30% (3) 0.30% (3) 0.56% (3) 0.65% (3) 0.65%<br />
Expenses, before reimbursements and credits 0.83% 0.87% 0.89% 0.91% 1.01%<br />
Net investment income, net of reimbursements and credits 2.70% (3) 2.43% (3) 2.08% (3) 1.72% (3) 1.80%<br />
Net investment income, before reimbursements and credits 2.17% 1.86% 1.75% 1.46% 1.44%<br />
Portfolio Turnover Rate 12.32% 19.17% 12.61% 28.77% 7.36%<br />
(1)<br />
(2)<br />
(3)<br />
Distributions to shareholders from net investment income include amounts relating to foreign currency transactions which are treated as ordinary income for federal<br />
income tax purposes.<br />
Assumes investment at net asset value at the beginning of the year, reinvestment of all dividends and distributions, and a complete redemption of the investment at net<br />
asset value at the end of the year.<br />
The net expenses and net investment income ratios include additional reimbursements of advisory fees incurred in connection with the investment of uninvested cash in<br />
affiliated money market funds of approximately $1,000, $2,000, $1,000 and $4,000 which represent less than 0.005 percent of average net assets for the fiscal<br />
years ended March 31, 2014, 2013, 2012 and 2011, respectively. Absent the additional reimbursements, net investment income and reimbursements wouldhave<br />
been decreased and net expenses increased by a corresponding amount.<br />
See Notes to the Financial Statements.<br />
EQUITY INDEX FUNDS 18 NORTHERN FUNDS ANNUAL REPORT
FOR THE FISCAL YEARS ENDED MARCH 31,<br />
INTERNATIONAL EQUITY INDEX FUND<br />
Selected per share data 2014 2013 2012 2011 2010<br />
Net Asset Value, Beginning of Year $10.78 $9.96 $10.88 $10.09 $6.70<br />
INCOME (LOSS) FROM INVESTMENT OPERATIONS:<br />
Net investment income 0.33 0.25 0.28 0.23 0.19<br />
Net realized and unrealized gains (losses) 1.54 0.83 (0.94) 0.77 3.39<br />
Total from Investment Operations 1.87 1.08 (0.66) 1.00 3.58<br />
LESS DISTRIBUTIONS PAID:<br />
From net investment income (1) (0.24) (0.26) (0.26) (0.21) (0.19)<br />
Total Distributions Paid (0.24) (0.26) (0.26) (0.21) (0.19)<br />
Net Asset Value, End of Year $12.41 $10.78 $9.96 $10.88 $10.09<br />
Total Return (2) 17.32% 11.04% (5.67)% 9.96% 53.57%<br />
SUPPLEMENTAL DATA AND RATIOS:<br />
Net assets, in thousands, end of year $4,608,961 $2,465,305 $1,669,734 $1,693,014 $1,538,065<br />
Ratio to average net assets of:<br />
Expenses, net of reimbursements and credits 0.25% (3) 0.25% (3) 0.40% (3) 0.45% (3) 0.45%<br />
Expenses, before reimbursements and credits 0.61% 0.62% 0.62% 0.62% 0.61%<br />
Net investment income, net of reimbursements and credits 3.53% (3) 2.97% (3) 2.93% (3) 2.32% (3) 2.37%<br />
Net investment income, before reimbursements and credits 3.17% 2.60% 2.71% 2.15% 2.21%<br />
Portfolio Turnover Rate 40.72% 25.01% 30.63% 8.41% 13.38%<br />
(1)<br />
(2)<br />
(3)<br />
Distributions to shareholders from net investment income include amounts relating to foreign currency transactions which are treated as ordinary income for federal<br />
income tax purposes.<br />
Assumes investment at net asset value at the beginning of the year, reinvestment of all dividends and distributions, and a complete redemption of the investment at net<br />
asset value at the end of the year.<br />
The net expenses and net investment income ratios include additional reimbursements of advisory fees incurred in connection with the investment of uninvested cash in<br />
affiliated money market funds of approximately $30,000, $14,000, $5,000 and $34,000, which represent less than 0.005 percent of average net assets for the<br />
fiscal years ended March 31, 2014, 2013, 2012 and 2011, respectively. Absent the additional reimbursements, net investment income and reimbursements would<br />
have been decreased and net expenses increased by a corresponding amount.<br />
See Notes to the Financial Statements.<br />
NORTHERN FUNDS ANNUAL REPORT 19 EQUITY INDEX FUNDS
EQUITY INDEX FUNDS<br />
FINANCIAL HIGHLIGHTS continued<br />
MID CAP INDEX FUND<br />
Selected per share data 2014 2013 2012 2011 2010<br />
Net Asset Value, Beginning of Year $14.96 $13.18 $13.07 $10.42 $6.44<br />
INCOME FROM INVESTMENT OPERATIONS:<br />
Net investment income 0.20 0.18 0.12 0.10 0.12<br />
Net realized and unrealized gains 2.91 2.07 0.09 2.65 3.98<br />
Total from Investment Operations 3.11 2.25 0.21 2.75 4.10<br />
LESS DISTRIBUTIONS PAID:<br />
From net investment income (0.17) (0.17) (0.10) (0.10) (0.12)<br />
From net realized gains (0.50) (0.30) — — —<br />
Total Distributions Paid (0.67) (0.47) (0.10) (0.10) (0.12)<br />
Net Asset Value, End of Year $17.40 $14.96 $13.18 $13.07 $10.42<br />
Total Return (1) 21.11% 17.56% 1.75% 26.46% 63.81%<br />
SUPPLEMENTAL DATA AND RATIOS:<br />
Net assets, in thousands, end of year $1,316,168 $980,340 $671,199 $519,014 $325,342<br />
Ratio to average net assets of:<br />
Expenses, net of reimbursements and credits 0.15% (2) 0.15% (2) 0.25% (2) 0.29% (2) 0.30%<br />
Expenses, before reimbursements and credits 0.50% 0.51% 0.52% 0.53% 0.52%<br />
Net investment income, net of reimbursements and credits 1.29% (2) 1.47% (2) 1.07% (2) 1.02% (2) 1.29%<br />
Net investment income, before reimbursements and credits 0.94% 1.11% 0.80% 0.78% 1.07%<br />
Portfolio Turnover Rate 12.72% 9.57% 12.07% 13.01% 29.69%<br />
(1)<br />
(2)<br />
Assumes investment at net asset value at the beginning of the year, reinvestment of all dividends and distributions, and a complete redemption of the investment at net<br />
asset value at the end of the year.<br />
The net expenses and net investment income ratios include additional reimbursements of advisory fees incurred in connection with the investment of uninvested cash in<br />
affiliated money market funds of approximately $20,000, $29,000 and $15,000, which represent less than 0.005 percent of average net assets for the fiscal years<br />
ended March 31, 2014, 2013 and 2012, respectively, and approximately $21,000, which represents 0.01 percent of average net assets for the fiscal year ended<br />
March 31, 2011. Absent the additional reimbursements, net investment income and reimbursements would have been decreased and net expenses increasedbya<br />
corresponding amount.<br />
See Notes to the Financial Statements.<br />
EQUITY INDEX FUNDS 20 NORTHERN FUNDS ANNUAL REPORT
FOR THE FISCAL YEARS ENDED MARCH 31,<br />
SMALL CAP INDEX FUND<br />
Selected per share data 2014 2013 2012 2011 2010<br />
Net Asset Value, Beginning of Year $10.41 $9.16 $9.28 $7.46 $4.63<br />
INCOME (LOSS) FROM INVESTMENT OPERATIONS:<br />
Net investment income 0.12 0.13 0.08 0.06 0.06<br />
Net realized and unrealized gains (losses) 2.43 1.33 (0.14) 1.82 2.83<br />
Total from Investment Operations 2.55 1.46 (0.06) 1.88 2.89<br />
LESS DISTRIBUTIONS PAID:<br />
From net investment income (0.10) (0.15) (0.06) (0.06) (0.06)<br />
From net realized gains (0.48) (0.06) — — —<br />
Total Distributions Paid (0.58) (0.21) (0.06) (0.06) (0.06)<br />
Net Asset Value, End of Year $12.38 $10.41 $9.16 $9.28 $7.46<br />
Total Return (1) 24.77% 16.24% (0.53)% 25.29% 62.55%<br />
SUPPLEMENTAL DATA AND RATIOS:<br />
Net assets, in thousands, end of year $985,665 $763,112 $512,782 $442,254 $273,798<br />
Ratio to average net assets of:<br />
Expenses, net of reimbursements and credits 0.15% (2) 0.15% (2) 0.29% (2) 0.34% (2) 0.35%<br />
Expenses, before reimbursements and credits 0.51% 0.52% 0.53% 0.55% 0.54%<br />
Net investment income, net of reimbursements and credits 1.06% (2) 1.60% (2) 1.02% (2) 0.85% (2) 0.94%<br />
Net investment income, before reimbursements and credits 0.70% 1.23% 0.78% 0.64% 0.75%<br />
Portfolio Turnover Rate 15.62% 13.04% 16.51% 13.55% 21.34%<br />
(1)<br />
(2)<br />
Assumes investment at net asset value at the beginning of the year, reinvestment of all dividends and distributions, and a complete redemption of the investment at net<br />
asset value at the end of the year.<br />
The net expenses and net investment income ratios include additional reimbursements of advisory fees incurred in connection with the investment of uninvested cash in<br />
affiliated money market funds of approximately $15,000, $24,000 and $10,000, which represent less than 0.005 percent of average net assets for the fiscal years<br />
ended March 31, 2014, 2013 and 2012, respectively and approximately $26,000, which represents 0.01 percent of average net assets for the fiscal year ended<br />
March 31, 2011. Absent the additional reimbursements, net investment income and reimbursements would have been decreased and net expenses increasedbya<br />
corresponding amount.<br />
See Notes to the Financial Statements.<br />
NORTHERN FUNDS ANNUAL REPORT 21 EQUITY INDEX FUNDS
EQUITY INDEX FUNDS<br />
FINANCIAL HIGHLIGHTS continued FOR THE FISCAL YEARS ENDED MARCH 31,<br />
STOCK INDEX FUND<br />
Selected per share data 2014 2013 2012 2011 2010<br />
Net Asset Value, Beginning of Year $19.47 $17.46 $16.41 $14.47 $9.85<br />
INCOME FROM INVESTMENT OPERATIONS:<br />
Net investment income 0.43 0.37 0.28 0.26 0.23<br />
Net realized and unrealized gains 3.76 2.01 1.05 1.94 4.62<br />
Total from Investment Operations 4.19 2.38 1.33 2.20 4.85<br />
LESS DISTRIBUTIONS PAID:<br />
From net investment income (0.42) (0.37) (0.28) (0.26) (0.23)<br />
From net realized gains (0.07) — — — —<br />
Total Distributions Paid (0.49) (0.37) (0.28) (0.26) (0.23)<br />
Net Asset Value, End of Year $23.17 $19.47 $17.46 $16.41 $14.47<br />
Total Return (1) 21.73% 13.83% 8.31% 15.40% 49.46%<br />
SUPPLEMENTAL DATA AND RATIOS:<br />
Net assets, in thousands, end of year $5,635,985 $4,830,786 $3,287,234 $2,233,947 $1,526,494<br />
Ratio to average net assets of:<br />
Expenses, net of reimbursements and credits 0.10% (2) 0.10% (2) 0.20% (2) 0.24% (2) 0.25%<br />
Expenses, before reimbursements and credits 0.38% 0.38% 0.39% 0.39% 0.39%<br />
Net investment income, net of reimbursements and credits 1.96% (2) 2.17% (2) 1.88% (2) 1.85% (2) 1.84%<br />
Net investment income, before reimbursements and credits 1.68% 1.89% 1.69% 1.70% 1.70%<br />
Portfolio Turnover Rate 8.16% 7.38% 2.73% 4.35% 11.85%<br />
(1)<br />
(2)<br />
Assumes investment at net asset value at the beginning of the year, reinvestment of all dividends and distributions, and a complete redemption of the investment at net<br />
asset value at the end of the year.<br />
The net expenses and net investment income ratios include additional reimbursements of advisory fees incurred in connection with the investment of uninvested cash in<br />
affiliated money market funds of approximately $71,000, $121,000 and $50,000, which represent less than 0.005 percent of average net assets for the fiscal<br />
years ended March 31, 2014, 2013 and 2012, respectively, and approximately $113,000, which represents 0.01 percent of average net assets for the fiscal year<br />
ended March 31, 2011. Absent the additional reimbursements, net investment income and reimbursements would have been decreased and net expenses increased<br />
by a corresponding amount.<br />
See Notes to the Financial Statements.<br />
EQUITY INDEX FUNDS 22 NORTHERN FUNDS ANNUAL REPORT
SCHEDULE OF INVESTMENTS<br />
EMERGING MARKETS EQUITY INDEX FUND MARCH 31, 2014<br />
NUMBER<br />
OF SHARES<br />
VALUE<br />
(000S)<br />
COMMON STOCKS - 92.1%<br />
Brazil - 6.3%<br />
ALL - America Latina Logistica S.A. 217,328 $720<br />
AMBEV S.A. 2,358,660 17,547<br />
Anhanguera Educacional<br />
Participacoes S.A. 202,815 1,259<br />
Banco Bradesco S.A. 318,678 4,685<br />
Banco Bradesco S.A. ADR 72,572 992<br />
Banco do Brasil S.A. 425,444 4,255<br />
Banco Santander Brasil S.A. 240,136 1,326<br />
Banco Santander Brasil S.A. ADR 232,810 1,297<br />
BB Seguridade Participacoes S.A. 298,801 3,280<br />
BM&FBovespa S.A. 938,861 4,659<br />
BR Malls Participacoes S.A. 202,115 1,736<br />
BR Properties S.A. 100,500 824<br />
BRF S.A. 328,020 6,568<br />
CCR S.A. 438,800 3,344<br />
Centrais Eletricas Brasileiras S.A.* 152,751 442<br />
CETIP S.A. - Mercados Organizados 99,856 1,204<br />
Cia de Saneamento Basico do Estado de<br />
Sao Paulo* 168,371 1,562<br />
Cia de Saneamento de Minas<br />
Gerais-COPASA* 32,700 529<br />
Cia Hering 66,961 812<br />
Cia Siderurgica Nacional S.A. 357,490 1,555<br />
Cielo S.A. 175,911 5,577<br />
Cosan S.A. Industria e Comercio 61,747 956<br />
CPFL Energia S.A. 116,220 952<br />
Cyrela Brazil Realty S.A. Empreendimentos<br />
e Participacoes 141,372 857<br />
Duratex S.A.* 132,496 677<br />
EcoRodovias Infraestrutura e<br />
Logistica S.A. 92,470 552<br />
EDP - Energias do Brasil S.A. 128,705 578<br />
Embraer S.A. 292,162 2,591<br />
Estacio Participacoes S.A. 135,384 1,366<br />
Fibria Celulose S.A.* 129,117 1,430<br />
Hypermarcas S.A. 175,858 1,274<br />
JBS S.A. 383,836 1,309<br />
Kroton Educacional S.A. 91,200 1,980<br />
Localiza Rent a Car S.A. 67,419 979<br />
Lojas Americanas S.A. 72,000 450<br />
Lojas Renner S.A. 61,639 1,745<br />
M Dias Branco S.A.* 16,500 661<br />
MRV Engenharia e Participacoes S.A. 147,393 521<br />
Multiplan Empreendimentos<br />
Imobiliarios S.A. 42,820 913<br />
Natura Cosmeticos S.A. 88,514 1,482<br />
NUMBER<br />
OF SHARES<br />
continued<br />
VALUE<br />
(000S)<br />
COMMON STOCKS - 92.1%<br />
Brazil - 6.3% continued<br />
Odontoprev S.A. 141,550 $568<br />
Oi S.A. ADR 37,810 50<br />
Petroleo Brasileiro S.A.* 1,403,078 9,245<br />
Petroleo Brasileiro S.A. ADR* 43,200 568<br />
Petroleo Brasileiro S.A. ADR<br />
(New York Exchange)* 62,873 872<br />
Porto Seguro S.A. 55,508 770<br />
Qualicorp S.A.* 98,600 992<br />
Raia Drogasil S.A.* 104,507 901<br />
Souza Cruz S.A. 189,040 1,712<br />
Sul America S.A. 61,099 405<br />
Tim Participacoes S.A. 435,536 2,259<br />
Totvs S.A. 61,255 950<br />
Tractebel Energia S.A. 84,338 1,320<br />
Transmissora Alianca de Energia<br />
Eletrica S.A. 53,200 451<br />
Ultrapar Participacoes S.A. 164,624 3,958<br />
Vale S.A. 604,862 8,387<br />
Vale S.A. ADR 45,808 634<br />
WEG S.A. 112,900 1,575<br />
121,063<br />
Chile - 1.5%<br />
AES Gener S.A. 1,159,154 643<br />
Aguas Andinas S.A., Class A 1,171,624 734<br />
Banco de Chile 12,151,050 1,533<br />
Banco de Credito e Inversiones 16,364 955<br />
Banco Santander Chile 32,018,558 1,880<br />
Banco Santander Chile ADR 1,400 33<br />
CAP S.A. 40,409 655<br />
Cencosud S.A. 555,553 1,843<br />
Cia Cervecerias Unidas S.A. 74,622 837<br />
Colbun S.A. 3,985,878 984<br />
Corpbanca S.A. 68,096,665 813<br />
E.CL S.A. 291,890 394<br />
Empresa Nacional de<br />
Electricidad S.A. ADR 3,800 164<br />
Empresa Nacional de Electricidad S.A. 1,510,195 2,187<br />
Empresas CMPC S.A. 616,447 1,417<br />
Empresas COPEC S.A. 227,802 2,987<br />
Enersis S.A. 9,561,548 2,987<br />
Enersis S.A. ADR 3,072 48<br />
ENTEL Chile S.A. 57,513 704<br />
Latam Airlines Group S.A. 128,553 1,950<br />
Latam Airlines Group S.A. BDR 34,762 492<br />
S.A.C.I. Falabella 360,313 3,185<br />
See Notes to the Financial Statements.<br />
NORTHERN FUNDS ANNUAL REPORT 23 EQUITY INDEX FUNDS
SCHEDULE OF INVESTMENTS<br />
EMERGING MARKETS EQUITY INDEX FUND continued<br />
COMMON STOCKS - 92.1%<br />
Chile - 1.5% continued<br />
NUMBER<br />
OF SHARES<br />
continued<br />
VALUE<br />
(000S)<br />
Sociedad Quimica y Minera de<br />
Chile S.A. ADR 3,193 $101<br />
Vina Concha y Toro S.A. 237,837 490<br />
28,016<br />
China - 14.4%<br />
AAC Technologies Holdings, Inc. 366,500 1,911<br />
Agile Property Holdings Ltd. 772,000 635<br />
Agricultural Bank of China Ltd., Class H 10,892,367 4,750<br />
Air China Ltd., Class H 1,016,705 601<br />
Aluminum Corp. of China Ltd., Class H* 1,889,435 651<br />
Anhui Conch Cement Co. Ltd., Class H 636,075 2,730<br />
Anta Sports Products Ltd. 426,432 712<br />
AviChina Industry & Technology Co. Ltd.,<br />
Class H 894,313 498<br />
Bank of China Ltd., Class H 37,813,652 16,783<br />
Bank of Communications Co. Ltd., Class H 4,379,117 2,868<br />
BBMG Corp., Class H 644,841 503<br />
Beijing Capital International Airport Co.<br />
Ltd., Class H 810,000 556<br />
Biostime International Holdings Ltd. 85,000 584<br />
Byd Co. Ltd., Class H* 260,199 1,610<br />
China BlueChemical Ltd., Class H 826,851 428<br />
China Cinda Asset Management Co. Ltd.,<br />
Class H* 1,840,000 1,048<br />
China CITIC Bank Corp. Ltd., Class H 4,135,286 2,390<br />
China Coal Energy Co. Ltd., Class H 2,021,232 1,139<br />
China Communications Construction Co.<br />
Ltd., Class H 2,127,287 1,492<br />
China Communications Services Corp. Ltd.,<br />
Class H 1,153,035 535<br />
China Construction Bank Corp., Class H 36,212,410 25,371<br />
China COSCO Holdings Co. Ltd.,<br />
Class H* 1,419,221 588<br />
China Everbright International Ltd. 1,349,000 1,864<br />
China International Marine Containers<br />
Group Co. Ltd., Class H 277,100 643<br />
China Life Insurance Co. Ltd., Class H 3,737,544 10,588<br />
China Longyuan Power Group Corp.,<br />
Class H 1,293,473 1,303<br />
China Mengniu Dairy Co. Ltd. 693,935 3,488<br />
China Merchants Bank Co. Ltd., Class H 2,308,933 4,188<br />
China Minsheng Banking Corp. Ltd.,<br />
Class H 2,577,427 2,587<br />
China National Building Material Co. Ltd.,<br />
Class H 1,408,000 1,413<br />
China Oilfield Services Ltd., Class H 930,757 2,197<br />
China Overseas Grand Oceans Group Ltd. 384,000 253<br />
COMMON STOCKS - 92.1%<br />
China - 14.4% continued<br />
NUMBER<br />
OF SHARES<br />
continued<br />
VALUE<br />
(000S)<br />
China Pacific Insurance Group Co. Ltd.,<br />
Class H 1,336,937 $4,779<br />
China Petroleum & Chemical Corp.,<br />
Class H 12,806,628 11,440<br />
China Railway Construction Corp. Ltd.,<br />
Class H 1,084,500 921<br />
China Railway Group Ltd., Class H 1,973,827 919<br />
China Shenhua Energy Co. Ltd., Class H 1,688,136 4,881<br />
China Shipping Container Lines Co. Ltd.,<br />
Class H* 2,097,695 479<br />
China Telecom Corp. Ltd., Class H 7,012,339 3,248<br />
China Vanke Co. Ltd., Class B 672,172 1,118<br />
Chongqing Changan Automobile Co. Ltd.,<br />
Class B 398,700 663<br />
Chongqing Rural Commercial Bank,<br />
Class H 1,353,434 595<br />
CITIC Securities Co. Ltd., Class H 547,500 1,143<br />
CNOOC Ltd. 8,968,433 13,557<br />
Country Garden Holdings Co. Ltd. 2,382,472 995<br />
CSR Corp. Ltd., Class H 922,669 778<br />
Datang International Power Generation<br />
Co. Ltd., Class H 1,635,875 597<br />
Dongfeng Motor Group Co. Ltd., Class H 1,347,169 1,909<br />
ENN Energy Holdings Ltd. 377,279 2,638<br />
Evergrande Real Estate Group Ltd. 3,171,400 1,500<br />
Fosun International Ltd. 821,160 1,032<br />
Golden Eagle Retail Group Ltd. 314,675 437<br />
GOME Electrical Appliances Holding Ltd. 4,707,874 799<br />
Great Wall Motor Co. Ltd., Class H 530,432 2,673<br />
Greentown China Holdings Ltd. 372,325 402<br />
Guangzhou Automobile Group Co. Ltd.,<br />
Class H 1,131,760 1,193<br />
Guangzhou R&F Properties Co. Ltd.,<br />
Class H 509,214 737<br />
Haitian International Holdings Ltd. 175,000 351<br />
Haitong Securities Co. Ltd., Class H 648,000 859<br />
Hengan International Group Co. Ltd. 373,898 3,876<br />
Huaneng Power International, Inc., Class H 1,470,501 1,412<br />
Industrial & Commercial Bank of China<br />
Ltd., Class H 37,039,515 22,795<br />
Inner Mongolia Yitai Coal Co. Ltd., Class B 542,316 654<br />
Intime Retail Group Co. Ltd. 552,135 596<br />
Jiangsu Expressway Co. Ltd., Class H 622,000 709<br />
Jiangxi Copper Co. Ltd., Class H 719,000 1,209<br />
Lenovo Group Ltd. 3,170,000 3,503<br />
Longfor Properties Co. Ltd. 679,231 940<br />
See Notes to the Financial Statements.<br />
EQUITY INDEX FUNDS 24 NORTHERN FUNDS ANNUAL REPORT
MARCH 31, 2014<br />
COMMON STOCKS - 92.1%<br />
China - 14.4% continued<br />
NUMBER<br />
OF SHARES<br />
continued<br />
VALUE<br />
(000S)<br />
New China Life Insurance Co. Ltd.,<br />
Class H* 372,971 $1,129<br />
People’s Insurance Co. Group of China<br />
Ltd., Class H 2,141,535 884<br />
PetroChina Co. Ltd., Class H 10,591,438 11,460<br />
PICC Property & Casualty Co. Ltd., Class H 1,566,923 2,145<br />
Ping An Insurance Group Co. of China<br />
Ltd., Class H 943,953 7,833<br />
Shandong Weigao Group Medical<br />
Polymer Co. Ltd., Class H 864,116 988<br />
Shanghai Electric Group Co. Ltd., Class H 1,572,000 558<br />
Shanghai Pharmaceuticals Holding Co.<br />
Ltd., Class H 323,600 739<br />
Shenzhou International Group<br />
Holdings Ltd. 271,000 863<br />
Shui On Land Ltd. 2,040,858 568<br />
Sihuan Pharmaceutical Holdings<br />
Group Ltd. 1,073,063 1,303<br />
Sino Biopharmaceutical Ltd. 1,544,000 1,321<br />
Sino-Ocean Land Holdings Ltd. 1,645,423 901<br />
Sinopec Engineering Group Co. Ltd.,<br />
Class H 515,000 560<br />
Sinopec Shanghai Petrochemical Co. Ltd.,<br />
Class H 1,920,005 496<br />
Sinopharm Group Co. Ltd., Class H 517,114 1,427<br />
SOHO China Ltd. 899,778 740<br />
Sun Art Retail Group Ltd. 1,186,500 1,492<br />
Tencent Holdings Ltd. 513,514 35,754<br />
Tingyi Cayman Islands Holding Corp. 978,435 2,812<br />
Tsingtao Brewery Co. Ltd., Class H 187,767 1,378<br />
Uni-President China Holdings Ltd. 597,000 502<br />
Want Want China Holdings Ltd. 3,007,870 4,493<br />
Weichai Power Co. Ltd., Class H 257,953 985<br />
Wumart Stores, Inc., Class H 300,470 295<br />
Yantai Changyu Pioneer Wine Co. Ltd.,<br />
Class B 131,713 321<br />
Yanzhou Coal Mining Co. Ltd., Class H 927,138 698<br />
Zhejiang Expressway Co. Ltd., Class H 805,294 734<br />
Zhongsheng Group Holdings Ltd. 305,000 420<br />
Zhuzhou CSR Times Electric Co. Ltd.,<br />
Class H 277,974 938<br />
Zijin Mining Group Co. Ltd., Class H 3,274,162 697<br />
Zoomlion Heavy Industry Science and<br />
Technology Co. Ltd., Class H 739,947 515<br />
ZTE Corp., Class H* 284,098 552<br />
279,745<br />
NUMBER<br />
OF SHARES<br />
continued<br />
VALUE<br />
(000S)<br />
COMMON STOCKS - 92.1%<br />
Colombia - 0.8%<br />
Almacenes Exito S.A. 97,565 $1,468<br />
Bancolombia S.A. 102,641 1,402<br />
Bancolombia S.A. ADR 8,252 466<br />
Bolsa de Valores de Colombia 393,656 645<br />
Cementos Argos S.A. 197,768 1,011<br />
Corp. Financiera Colombiana S.A. 42,109 799<br />
Ecopetrol S.A. 2,376,283 4,856<br />
Ecopetrol S.A. ADR 5,700 233<br />
Grupo Argos S.A. 148,275 1,555<br />
Grupo de Inversiones Suramericana S.A. 117,336 2,172<br />
Interconexion Electrica S.A. ESP 191,319 853<br />
15,460<br />
Czech Republic - 0.3%<br />
CEZ A.S. 82,347 2,358<br />
Komercni Banka A.S. 7,593 1,814<br />
Telefonica Czech Republic A.S. 56,313 845<br />
5,017<br />
Egypt - 0.2%<br />
Commercial International Bank<br />
Egypt S.A.E. 425,446 2,172<br />
Global Telecom Holding* 1,298,458 826<br />
Talaat Moustafa Group* 582,316 639<br />
Telecom Egypt Co. 182,055 441<br />
4,078<br />
Greece - 0.5%<br />
Alpha Bank A.E.* 757,385 748<br />
Folli Follie S.A.* 14,512 536<br />
Hellenic Petroleum S.A. 43,617 437<br />
Hellenic Telecommunications<br />
Organization S.A.* 121,259 2,004<br />
JUMBO S.A.* 49,476 887<br />
National Bank of Greece S.A.* 163,370 886<br />
OPAP S.A. 110,862 1,787<br />
Piraeus Bank S.A.* 517,441 1,425<br />
Public Power Corp. S.A. 56,712 938<br />
Titan Cement Co. S.A.* 25,072 877<br />
10,525<br />
Hong Kong - 4.1%<br />
Beijing Enterprises Holdings Ltd. 264,271 2,368<br />
Beijing Enterprises Water Group Ltd. 1,650,000 1,155<br />
Belle International Holdings Ltd. 2,376,000 2,371<br />
Brilliance China Automotive Holdings Ltd. 1,489,944 2,278<br />
China Agri-Industries Holdings Ltd. 1,162,492 455<br />
See Notes to the Financial Statements.<br />
NORTHERN FUNDS ANNUAL REPORT 25 EQUITY INDEX FUNDS
SCHEDULE OF INVESTMENTS<br />
EMERGING MARKETS EQUITY INDEX FUND continued<br />
NUMBER<br />
OF SHARES<br />
continued<br />
VALUE<br />
(000S)<br />
COMMON STOCKS - 92.1%<br />
Hong Kong - 4.1% continued<br />
China Everbright Ltd. 479,110 $612<br />
China Gas Holdings Ltd. 1,007,495 1,574<br />
China Merchants Holdings International<br />
Co. Ltd. 559,871 1,925<br />
China Mobile Ltd. 3,025,212 27,488<br />
China Overseas Land & Investment Ltd. 2,034,475 5,278<br />
China Resources Cement Holdings Ltd. 938,343 742<br />
China Resources Enterprise Ltd. 593,628 1,683<br />
China Resources Gas Group Ltd. 465,958 1,485<br />
China Resources Land Ltd. 1,017,756 2,235<br />
China Resources Power Holdings Co. Ltd. 946,900 2,467<br />
China State Construction International<br />
Holdings Ltd. 854,534 1,458<br />
China Taiping Insurance Holdings<br />
Co. Ltd.* 419,260 751<br />
China Unicom Hong Kong Ltd. 2,380,494 3,129<br />
CITIC Pacific Ltd. 741,095 1,315<br />
COSCO Pacific Ltd. 864,445 1,109<br />
CSPC Pharmaceutical Group Ltd. 670,000 594<br />
Far East Horizon Ltd. 711,000 524<br />
Franshion Properties China Ltd. 1,759,791 589<br />
GCL-Poly Energy Holdings Ltd.* 4,843,675 1,749<br />
Geely Automobile Holdings Ltd. 2,653,423 1,043<br />
Guangdong Investment Ltd. 1,298,514 1,244<br />
Haier Electronics Group Co. Ltd. 474,000 1,285<br />
Hanergy Solar Group Ltd.* 5,554,000 874<br />
Kingboard Chemical Holdings Ltd. 329,008 644<br />
Kunlun Energy Co. Ltd. 1,605,230 2,688<br />
Lee & Man Paper Manufacturing Ltd. 922,248 575<br />
New World China Land Ltd. 1,038,000 876<br />
Nine Dragons Paper Holdings Ltd. 767,923 599<br />
Poly Property Group Co. Ltd. 1,109,737 491<br />
Shanghai Industrial Holdings Ltd. 222,043 742<br />
Shimao Property Holdings Ltd. 673,903 1,484<br />
Shougang Fushan Resources Group Ltd. 1,765,933 538<br />
Yingde Gases Group Co. Ltd. 610,700 586<br />
Yuexiu Property Co. Ltd. 2,861,393 592<br />
79,595<br />
Hungary - 0.2%<br />
MOL Hungarian Oil & Gas PLC 21,804 1,227<br />
OTP Bank PLC 104,071 1,996<br />
Richter Gedeon Nyrt 72,495 1,265<br />
4,488<br />
NUMBER<br />
OF SHARES<br />
continued<br />
VALUE<br />
(000S)<br />
COMMON STOCKS - 92.1%<br />
India - 6.6%<br />
ACC Ltd. 12,293 $289<br />
Adani Enterprises Ltd. 58,749 363<br />
Adani Ports and Special Economic<br />
Zone Ltd. 222,528 700<br />
Aditya Birla Nuvo Ltd. 17,736 324<br />
Ambuja Cements Ltd. 343,299 1,167<br />
Apollo Hospitals Enterprise Ltd. 36,099 555<br />
Asian Paints Ltd. 150,134 1,380<br />
Bajaj Auto Ltd. 43,268 1,511<br />
Bank of Baroda 23,389 283<br />
Bharat Heavy Electricals Ltd. 290,922 953<br />
Bharat Petroleum Corp. Ltd. 82,305 635<br />
Bharti Airtel Ltd. 290,965 1,548<br />
Cairn India Ltd. 247,964 1,382<br />
Cipla Ltd. 178,748 1,147<br />
Coal India Ltd. 263,938 1,279<br />
Dabur India Ltd. 106,017 319<br />
Divi’s Laboratories Ltd. 21,886 501<br />
DLF Ltd. 198,766 590<br />
Dr. Reddy’s Laboratories Ltd. 35,419 1,522<br />
Dr. Reddy’s Laboratories Ltd. ADR 15,005 659<br />
GAIL India Ltd. 162,305 1,023<br />
GlaxoSmithKline Consumer<br />
Healthcare Ltd. 5,737 413<br />
Godrej Consumer Products Ltd. 57,371 826<br />
HCL Technologies Ltd. 121,736 2,840<br />
HDFC Bank Ltd. 494,846 6,226<br />
HDFC Bank Ltd. ADR 31,500 1,292<br />
Hero MotoCorp Ltd. 41,517 1,583<br />
Hindalco Industries Ltd. 575,030 1,371<br />
Hindustan Unilever Ltd. 321,456 3,258<br />
Housing Development Finance Corp. 744,695 11,014<br />
ICICI Bank Ltd. 48,818 1,024<br />
ICICI Bank Ltd. ADR 29,471 1,291<br />
Idea Cellular Ltd. 351,374 809<br />
Infosys Ltd. 187,534 10,318<br />
Infosys Ltd. ADR 43,137 2,337<br />
ITC Ltd. 1,110,074 6,557<br />
Jaiprakash Associates Ltd. 552,523 496<br />
Jindal Steel & Power Ltd. 186,208 914<br />
JSW Steel Ltd. 40,397 700<br />
Kotak Mahindra Bank Ltd. 156,948 2,051<br />
Larsen & Toubro Ltd. 151,440 3,221<br />
Larsen & Toubro Ltd. GDR (Registered) 7,050 150<br />
LIC Housing Finance Ltd. 131,842 521<br />
See Notes to the Financial Statements.<br />
EQUITY INDEX FUNDS 26 NORTHERN FUNDS ANNUAL REPORT
MARCH 31, 2014<br />
COMMON STOCKS - 92.1%<br />
India - 6.6% continued<br />
NUMBER<br />
OF SHARES<br />
continued<br />
VALUE<br />
(000S)<br />
Mahindra & Mahindra Financial<br />
Services Ltd. 121,618 $515<br />
Mahindra & Mahindra Ltd. 153,956 2,535<br />
Nestle India Ltd. 9,563 806<br />
NTPC Ltd. 510,306 1,024<br />
Oil & Natural Gas Corp. Ltd. 385,246 2,054<br />
Oil India Ltd. 67,947 552<br />
Piramal Enterprises Ltd. 37,487 344<br />
Power Finance Corp. Ltd. 147,237 476<br />
Power Grid Corp. of India Ltd. 627,258 1,103<br />
Ranbaxy Laboratories Ltd.* 70,238 429<br />
Reliance Capital Ltd. 52,679 306<br />
Reliance Communications Ltd. 261,637 566<br />
Reliance Industries Ltd. 508,240 7,932<br />
Reliance Industries Ltd. GDR (1) (2) 70,126 2,176<br />
Reliance Infrastructure Ltd. 55,302 403<br />
Reliance Power Ltd.* 303,108 359<br />
Rural Electrification Corp. Ltd. 140,938 543<br />
Sesa Sterlite Ltd. 510,052 1,617<br />
Shriram Transport Finance Co. Ltd. 66,107 852<br />
Siemens Ltd. 39,800 516<br />
State Bank of India 72,674 2,331<br />
Sun Pharmaceutical Industries Ltd. 309,756 2,979<br />
Tata Consultancy Services Ltd. 235,303 8,402<br />
Tata Motors Ltd. 351,604 2,355<br />
Tata Motors Ltd. ADR 6,700 237<br />
Tata Power Co. Ltd. 459,051 656<br />
Tata Steel Ltd. 154,354 1,024<br />
Tech Mahindra Ltd. 28,763 866<br />
Ultratech Cement Ltd. 17,425 640<br />
United Breweries Ltd. 30,869 426<br />
United Spirits Ltd. 42,320 1,877<br />
Wipro Ltd. 281,045 2,557<br />
Wipro Ltd. ADR 25,040 336<br />
Yes Bank Ltd. 97,814 681<br />
127,817<br />
Indonesia - 2.6%<br />
Adaro Energy Tbk PT 7,010,520 610<br />
Astra Agro Lestari Tbk PT 217,222 499<br />
Astra International Tbk PT 10,136,560 6,637<br />
Bank Central Asia Tbk PT 6,169,492 5,795<br />
Bank Danamon Indonesia Tbk PT 1,631,443 629<br />
Bank Mandiri Persero Tbk PT 4,723,755 3,975<br />
Bank Negara Indonesia Persero Tbk PT 3,834,309 1,688<br />
NUMBER<br />
OF SHARES<br />
continued<br />
VALUE<br />
(000S)<br />
COMMON STOCKS - 92.1%<br />
Indonesia - 2.6% continued<br />
Bank Rakyat Indonesia Persero Tbk PT 5,623,958 $4,787<br />
Bumi Serpong Damai PT 3,245,200 472<br />
Charoen Pokphand Indonesia Tbk PT 3,610,735 1,274<br />
Global Mediacom Tbk PT 3,327,200 693<br />
Gudang Garam Tbk PT 241,915 1,061<br />
Indo Tambangraya Megah Tbk PT 186,678 403<br />
Indocement Tunggal Prakarsa Tbk PT 769,303 1,600<br />
Indofood CBP Sukses Makmur Tbk PT 551,700 492<br />
Indofood Sukses Makmur Tbk PT 2,296,571 1,485<br />
Jasa Marga Persero Tbk PT 1,135,000 605<br />
Kalbe Farma Tbk PT 11,694,780 1,517<br />
Lippo Karawaci Tbk PT 9,764,000 934<br />
Matahari Department Store Tbk PT* 730,473 896<br />
Media Nusantara Citra Tbk PT 2,335,500 545<br />
Perusahaan Gas Negara Persero Tbk PT 5,547,812 2,520<br />
Semen Indonesia Persero Tbk PT 1,480,955 2,079<br />
Surya Citra Media Tbk PT 2,071,400 585<br />
Tambang Batubara Bukit Asam<br />
Persero Tbk PT 443,000 366<br />
Telekomunikasi Indonesia Persero Tbk PT 22,932,865 4,491<br />
Tower Bersama Infrastructure Tbk PT* 765,900 405<br />
Unilever Indonesia Tbk PT 758,028 1,967<br />
United Tractors Tbk PT 822,371 1,512<br />
XL Axiata Tbk PT 1,186,760 461<br />
50,983<br />
Malaysia - 3.8%<br />
AirAsia Bhd. 698,300 545<br />
Alliance Financial Group Bhd. 538,600 729<br />
AMMB Holdings Bhd. 829,537 1,824<br />
Astro Malaysia Holdings Bhd. 772,600 758<br />
Axiata Group Bhd. 1,268,125 2,591<br />
Berjaya Sports Toto Bhd. 363,356 442<br />
British American Tobacco Malaysia Bhd. 66,100 1,197<br />
Bumi Armada Bhd. 486,700 583<br />
CIMB Group Holdings Bhd. 2,456,094 5,377<br />
Dialog Group Bhd. 928,400 1,020<br />
DiGi.Com Bhd. 1,750,700 2,890<br />
Felda Global Ventures Holdings Bhd. 660,400 940<br />
Gamuda Bhd. 884,000 1,278<br />
Genting Bhd. 1,021,900 3,129<br />
Genting Malaysia Bhd. 1,523,300 1,960<br />
Genting Plantations Bhd. 129,900 429<br />
Hong Leong Bank Bhd. 289,140 1,252<br />
Hong Leong Financial Group Bhd. 120,100 577<br />
See Notes to the Financial Statements.<br />
NORTHERN FUNDS ANNUAL REPORT 27 EQUITY INDEX FUNDS
SCHEDULE OF INVESTMENTS<br />
EMERGING MARKETS EQUITY INDEX FUND continued<br />
NUMBER<br />
OF SHARES<br />
continued<br />
VALUE<br />
(000S)<br />
COMMON STOCKS - 92.1%<br />
Malaysia - 3.8% continued<br />
IHH Healthcare Bhd.* 1,263,800 $1,489<br />
IJM Corp. Bhd. 565,220 1,064<br />
IOI Corp. Bhd. 1,440,340 2,118<br />
IOI Properties Group Bhd.* 518,113 423<br />
Kuala Lumpur Kepong Bhd. 239,650 1,777<br />
Lafarge Malaysia Bhd. 178,600 494<br />
Malayan Banking Bhd. 2,222,576 6,588<br />
Malaysia Airports Holdings Bhd. 278,744 683<br />
Maxis Bhd. 1,109,651 2,365<br />
MISC Bhd.* 542,760 1,147<br />
MMC Corp. Bhd. 431,875 373<br />
Parkson Holdings Bhd. 344,943 317<br />
Petronas Chemicals Group Bhd. 1,394,300 2,954<br />
Petronas Dagangan Bhd. 126,600 1,189<br />
Petronas Gas Bhd. 286,800 2,090<br />
PPB Group Bhd. 242,600 1,236<br />
Public Bank Bhd. 9,913 58<br />
Public Bank Bhd. (Registered) 522,500 3,074<br />
RHB Capital Bhd. 307,220 792<br />
Sapurakencana Petroleum Bhd.* 1,805,900 2,489<br />
Sime Darby Bhd. 1,360,864 3,880<br />
Telekom Malaysia Bhd. 540,100 974<br />
Tenaga Nasional Bhd. 1,434,150 5,250<br />
UEM Sunrise Bhd. 843,917 568<br />
UMW Holdings Bhd. 271,500 913<br />
YTL Corp. Bhd. 2,495,080 1,170<br />
YTL Power International Bhd.* 1,104,913 532<br />
73,528<br />
Mexico - 5.1%<br />
Alfa S.A.B. de C.V., Series A 1,434,480 3,626<br />
America Movil S.A.B. de C.V., Series L 17,611,282 17,563<br />
Arca Continental S.A.B. de C.V. 164,784 983<br />
Cemex Latam Holdings S.A.* 81,222 676<br />
Cemex S.A.B. de C.V., Series CPO* 5,671,180 7,189<br />
Coca-Cola Femsa S.A.B. de C.V., Series L 214,122 2,252<br />
Compartamos S.A.B. de C.V. 553,272 1,012<br />
Controladora Comercial Mexicana S.A.B.<br />
de C.V., Series UBC 202,600 840<br />
El Puerto de Liverpool S.A.B. de C.V.,<br />
Series C1 97,000 1,065<br />
Fibra Uno Administracion S.A. de C.V. 689,500 2,231<br />
Fomento Economico Mexicano S.A.B. de<br />
C.V., Series UBD 972,677 9,072<br />
Genomma Lab Internacional S.A.B. de<br />
C.V., Series B* 402,700 1,036<br />
COMMON STOCKS - 92.1%<br />
Mexico - 5.1% continued<br />
NUMBER<br />
OF SHARES<br />
continued<br />
VALUE<br />
(000S)<br />
Grupo Aeroportuario del Pacifico S.A.B.<br />
de C.V., Series B 150,952 $884<br />
Grupo Aeroportuario del Sureste S.A.B. de<br />
C.V., Series B 106,600 1,309<br />
Grupo Bimbo S.A.B. de C.V., Series A 839,528 2,264<br />
Grupo Carso S.A.B. de C.V., Series A1 279,706 1,468<br />
Grupo Comercial Chedraui S.A. de C.V. 182,800 538<br />
Grupo Financiero Banorte S.A.B. de C.V.,<br />
Series O 1,246,418 8,429<br />
Grupo Financiero Inbursa S.A.B. de C.V.,<br />
Series O 1,176,643 3,040<br />
Grupo Financiero Santander Mexico<br />
S.A.B. de C.V., Series B 922,000 2,260<br />
Grupo Mexico S.A.B. de C.V., Series B 1,894,436 5,978<br />
Grupo Televisa S.A.B., Series CPO 1,295,014 8,640<br />
Industrias C.H. S.A.B. de C.V., Series B* 76,837 426<br />
Industrias Penoles S.A.B. de C.V. 68,687 1,789<br />
Kimberly-Clark de Mexico S.A.B. de C.V.,<br />
Series A 782,627 2,089<br />
Mexichem S.A.B. de C.V. 513,434 1,809<br />
Minera Frisco S.A.B. de C.V., Series A1* 313,206 610<br />
OHL Mexico S.A.B. de C.V.* 348,700 904<br />
Promotora y Operadora de Infraestructura<br />
S.A.B. de C.V.* 131,300 1,764<br />
Wal-Mart de Mexico S.A.B. de C.V.,<br />
Series V 2,637,837 6,284<br />
98,030<br />
Peru - 0.4%<br />
Cia de Minas Buenaventura S.A.A. ADR 97,106 1,221<br />
Credicorp Ltd. 34,152 4,710<br />
Southern Copper Corp. 83,727 2,437<br />
8,368<br />
Philippines - 0.9%<br />
Aboitiz <strong>Equity</strong> Ventures, Inc. 970,599 1,215<br />
Aboitiz Power Corp. 934,644 775<br />
Alliance Global Group, Inc. 997,824 634<br />
Ayala Corp. 91,217 1,178<br />
Ayala Land, Inc. 2,923,080 1,949<br />
Bank of the Philippine Islands 431,833 828<br />
BDO Unibank, Inc. 735,756 1,397<br />
DMCI Holdings, Inc. 398,060 622<br />
Energy Development Corp. 3,558,950 450<br />
Globe Telecom, Inc. 16,490 612<br />
International Container Terminal<br />
Services, Inc. 258,680 623<br />
JG Summit Holdings, Inc. 1,036,800 1,145<br />
See Notes to the Financial Statements.<br />
EQUITY INDEX FUNDS 28 NORTHERN FUNDS ANNUAL REPORT
MARCH 31, 2014<br />
NUMBER<br />
OF SHARES<br />
continued<br />
VALUE<br />
(000S)<br />
COMMON STOCKS - 92.1%<br />
Philippines - 0.9% continued<br />
Jollibee Foods Corp. 211,083 $806<br />
Metro Pacific Investments Corp. 5,488,000 580<br />
Metropolitan Bank & Trust Co. 153,259 265<br />
Philippine Long Distance Telephone Co. 21,985 1,339<br />
SM Investments Corp. 72,895 1,148<br />
SM Prime Holdings, Inc. 2,978,413 971<br />
Universal Robina Corp. 445,670 1,412<br />
17,949<br />
Poland - 1.7%<br />
Alior Bank S.A.* 21,413 619<br />
Bank Handlowy w Warszawie S.A. 18,400 691<br />
Bank Millennium S.A.* 207,307 613<br />
Bank Pekao S.A. 66,468 4,302<br />
Bank Zachodni WBK S.A. 14,079 1,923<br />
Cyfrowy Polsat S.A.* 82,277 582<br />
Enea S.A. 69,464 366<br />
Eurocash S.A. 38,785 512<br />
Grupa Azoty S.A. 22,371 447<br />
Grupa Lotos S.A.* 34,811 436<br />
Jastrzebska Spolka Weglowa S.A. 22,620 343<br />
Kernel Holding S.A.* 28,156 271<br />
KGHM Polska Miedz S.A. 67,121 2,424<br />
mBank 7,667 1,366<br />
Orange Polska S.A. 330,800 1,132<br />
PGE S.A. 371,101 2,314<br />
Polski Koncern Naftowy Orlen S.A. 163,062 2,329<br />
Polskie Gornictwo Naftowe i<br />
Gazownictwo S.A. 917,522 1,347<br />
Powszechna Kasa Oszczednosci Bank<br />
Polski S.A. 439,715 6,155<br />
Powszechny Zaklad Ubezpieczen S.A. 28,424 4,038<br />
Synthos S.A. 287,733 463<br />
Tauron Polska Energia S.A. 529,894 920<br />
33,593<br />
Russia - 5.0%<br />
Federal Grid Co. Unified Energy<br />
System JSC* 182,254,477 400<br />
Gazprom OAO 1,336,583 5,159<br />
Gazprom OAO ADR 2,302,000 17,777<br />
Lukoil OAO 71,708 4,005<br />
Lukoil OAO ADR (London Exchange) 172,385 9,595<br />
Lukoil OAO ADR (OTC Exchange) 11,873 664<br />
Magnit OJSC 3,011 695<br />
Magnit OJSC GDR (Registered) 127,606 7,005<br />
NUMBER<br />
OF SHARES<br />
continued<br />
VALUE<br />
(000S)<br />
COMMON STOCKS - 92.1%<br />
Russia - 5.0% continued<br />
MegaFon OAO GDR (Registered) 44,587 $1,255<br />
MMC Norilsk Nickel OJSC 14,329 2,395<br />
MMC Norilsk Nickel OJSC ADR<br />
(London Exchange) 56,727 945<br />
MMC Norilsk Nickel OJSC ADR<br />
(OTC Exchange) 80,388 1,347<br />
Mobile Telesystems OJSC ADR 261,350 4,571<br />
Moscow Exchange MICEX-RTS OAO 451,000 744<br />
NOVATEK OAO GDR (Registered) 45,495 5,022<br />
Rosneft OAO 195,465 1,306<br />
Rosneft OAO GDR (Registered) 395,121 2,636<br />
Rostelecom OJSC 397,344 942<br />
RusHydro JSC 29,671,245 473<br />
RusHydro JSC ADR 266,069 405<br />
Sberbank of Russia 5,853,240 13,967<br />
Sberbank of Russia (OTC Exchange) 56,000 134<br />
Severstal OAO 22,803 173<br />
Severstal OAO GDR (Registered) 82,609 627<br />
Sistema JSFC GDR (Registered) 58,460 1,319<br />
Surgutneftegas OAO 1,409,823 1,039<br />
Surgutneftegas OAO ADR<br />
(London Exchange) 93,244 688<br />
Surgutneftegas OAO ADR<br />
(OTC Exchange) 120,622 878<br />
Tatneft OAO 334,214 1,906<br />
Tatneft OAO ADR (Frankfurt Exchange) 1,663 55<br />
Tatneft OAO ADR (London Exchange) 62,512 2,145<br />
Uralkali OJSC 509,249 2,436<br />
Uralkali OJSC GDR (Registered) 31,490 750<br />
VTB Bank OJSC 1,977,000,422 2,232<br />
VTB Bank OJSC GDR (1) (2) 11,036 25<br />
VTB Bank OJSC GDR (Registered) 299,452 660<br />
96,375<br />
South Africa - 7.6%<br />
African Bank Investments Ltd. 651,206 665<br />
African Rainbow Minerals Ltd. 56,523 1,120<br />
Anglo American Platinum Ltd.* 32,578 1,461<br />
AngloGold Ashanti Ltd. 201,420 3,470<br />
Aspen Pharmacare Holdings Ltd. 173,177 4,627<br />
Assore Ltd. 17,197 664<br />
Barclays Africa Group Ltd. 172,455 2,435<br />
Barloworld Ltd. 112,372 1,177<br />
Bidvest Group Ltd. 147,308 3,896<br />
Discovery Ltd. 151,816 1,217<br />
Exxaro Resources Ltd. 72,768 966<br />
See Notes to the Financial Statements.<br />
NORTHERN FUNDS ANNUAL REPORT 29 EQUITY INDEX FUNDS
SCHEDULE OF INVESTMENTS<br />
EMERGING MARKETS EQUITY INDEX FUND continued<br />
NUMBER<br />
OF SHARES<br />
continued<br />
VALUE<br />
(000S)<br />
COMMON STOCKS - 92.1%<br />
South Africa - 7.6% continued<br />
FirstRand Ltd. 1,573,109 $5,395<br />
Foschini Group (The) Ltd. 94,346 960<br />
Gold Fields Ltd. 390,550 1,472<br />
Growthpoint Properties Ltd. 935,826 2,170<br />
Harmony Gold Mining Co. Ltd.* 189,825 581<br />
Impala Platinum Holdings Ltd. 270,583 3,080<br />
Imperial Holdings Ltd. 97,204 1,741<br />
Investec Ltd. 120,974 976<br />
Kumba Iron Ore Ltd. 38,862 1,391<br />
Liberty Holdings Ltd. 61,876 731<br />
Life Healthcare Group Holdings Ltd. 456,781 1,667<br />
Massmart Holdings Ltd. 52,519 686<br />
Mediclinic International Ltd. 193,275 1,371<br />
MMI Holdings Ltd. 570,120 1,333<br />
Mr. Price Group Ltd. 123,953 1,853<br />
MTN Group Ltd. 847,010 17,343<br />
Nampak Ltd. 303,345 1,033<br />
Naspers Ltd., Class N 198,459 21,897<br />
Nedbank Group Ltd. 102,243 2,176<br />
Netcare Ltd. 488,064 1,082<br />
Northam Platinum Ltd.* 148,732 550<br />
Pick n Pay Stores Ltd. 129,728 636<br />
PPC Ltd. 240,247 667<br />
Rand Merchant Insurance Holdings Ltd. 325,036 889<br />
Redefine Properties Ltd.* 1,507,173 1,367<br />
Remgro Ltd. 241,631 4,704<br />
Reunert Ltd. 87,866 540<br />
RMB Holdings Ltd. 341,971 1,551<br />
Sanlam Ltd. 907,175 4,938<br />
Sappi Ltd.* 251,030 882<br />
Sasol Ltd. 277,808 15,559<br />
Shoprite Holdings Ltd. 213,184 3,224<br />
SPAR Group (The) Ltd. 84,419 972<br />
Standard Bank Group Ltd. 609,355 8,034<br />
Steinhoff International Holdings Ltd. 674,754 3,269<br />
Tiger Brands Ltd. 82,349 2,130<br />
Truworths International Ltd. 217,688 1,602<br />
Vodacom Group Ltd. 184,281 2,275<br />
Woolworths Holdings Ltd. 378,230 2,636<br />
147,061<br />
South Korea - 14.7%<br />
Amorepacific Corp. 1,607 1,899<br />
AMOREPACIFIC Group 1,551 745<br />
BS Financial Group, Inc. 85,082 1,207<br />
NUMBER<br />
OF SHARES<br />
continued<br />
VALUE<br />
(000S)<br />
COMMON STOCKS - 92.1%<br />
South Korea - 14.7% continued<br />
Celltrion, Inc. 30,165 $1,250<br />
Cheil Industries, Inc. 23,470 1,584<br />
Cheil Worldwide, Inc.* 46,910 1,055<br />
CJ CheilJedang Corp. 3,946 1,063<br />
CJ Corp. 7,441 950<br />
Coway Co. Ltd. 27,312 1,916<br />
Daelim Industrial Co. Ltd. 14,383 1,169<br />
Daewoo Engineering & Construction<br />
Co. Ltd.* 59,400 445<br />
Daewoo International Corp. 22,968 838<br />
Daewoo Securities Co. Ltd. 80,958 625<br />
Daewoo Shipbuilding & Marine<br />
Engineering Co. Ltd. 46,550 1,405<br />
DGB Financial Group, Inc. 67,590 977<br />
Dongbu Insurance Co. Ltd. 18,837 979<br />
Doosan Corp. 4,570 594<br />
Doosan Heavy Industries & Construction<br />
Co. Ltd. 22,912 759<br />
Doosan Infracore Co. Ltd.* 66,360 857<br />
E-Mart Co. Ltd. 10,439 2,403<br />
GS Engineering & Construction Corp. 17,260 587<br />
GS Holdings 26,023 1,177<br />
Halla Visteon Climate Control Corp. 18,060 826<br />
Hana Financial Group, Inc. 139,543 5,092<br />
Hankook Tire Co. Ltd. 36,976 2,103<br />
Hanwha Chemical Corp. 41,672 761<br />
Hanwha Corp. 22,395 677<br />
Hanwha Life Insurance Co. Ltd. 104,150 684<br />
Hite Jinro Co. Ltd. 15,340 339<br />
Hyosung Corp. 12,182 882<br />
Hyundai Department Store Co. Ltd. 7,608 1,013<br />
Hyundai Development Co.-Engineering &<br />
Construction 28,090 791<br />
Hyundai Engineering & Construction<br />
Co. Ltd. 36,773 1,939<br />
Hyundai Glovis Co. Ltd. 6,773 1,541<br />
Hyundai Heavy Industries Co. Ltd. 21,249 4,234<br />
Hyundai Marine & Fire Insurance Co. Ltd. 31,510 908<br />
Hyundai Merchant Marine Co. Ltd.* 37,149 359<br />
Hyundai Mipo Dockyard 5,400 789<br />
Hyundai Mobis Co. Ltd. 34,098 10,115<br />
Hyundai Motor Co. 77,434 18,303<br />
Hyundai Securities Co. Ltd. 59,780 364<br />
Hyundai Steel Co. 34,340 2,226<br />
Hyundai Wia Corp. 7,863 1,262<br />
Industrial Bank of Korea 92,310 1,174<br />
See Notes to the Financial Statements.<br />
EQUITY INDEX FUNDS 30 NORTHERN FUNDS ANNUAL REPORT
MARCH 31, 2014<br />
NUMBER<br />
OF SHARES<br />
continued<br />
VALUE<br />
(000S)<br />
COMMON STOCKS - 92.1%<br />
South Korea - 14.7% continued<br />
Kangwon Land, Inc. 47,120 $1,376<br />
KB Financial Group, Inc. 194,134 6,809<br />
KCC Corp. 2,429 1,245<br />
Kia Motors Corp. 132,036 7,373<br />
Korea Aerospace Industries Ltd. 19,320 616<br />
Korea Electric Power Corp. 129,526 4,454<br />
Korea Gas Corp. 13,474 787<br />
Korea Investment Holdings Co. Ltd. 21,680 748<br />
Korea Zinc Co. Ltd. 4,363 1,355<br />
Korean Air Lines Co. Ltd.* 16,128 586<br />
KT Corp. 24,619 686<br />
KT Corp. ADR 6,526 91<br />
KT&G Corp. 55,589 4,174<br />
Kumho Petro chemical Co. Ltd. 6,504 538<br />
LG Chem Ltd. 23,473 5,619<br />
LG Corp. 46,740 2,538<br />
LG Display Co. Ltd.* 116,040 2,913<br />
LG Electronics, Inc. 51,943 3,174<br />
LG Household & Health Care Ltd. 4,625 1,996<br />
LG Innotek Co. Ltd.* 5,984 580<br />
LG Uplus Corp. 107,042 1,053<br />
Lotte Chemical Corp. 8,499 1,507<br />
Lotte Confectionery Co. Ltd. 392 670<br />
Lotte Shopping Co. Ltd. 5,456 1,717<br />
LS Corp. 8,565 613<br />
LS Industrial Systems Co. Ltd. 8,625 546<br />
Mirae Asset Securities Co. Ltd. 14,075 548<br />
NAVER Corp. 14,075 10,247<br />
NCSoft Corp. 7,579 1,556<br />
NHN Entertainment Corp.* 6,075 549<br />
OCI Co. Ltd. 8,243 1,383<br />
Orion Corp. 1,773 1,363<br />
POSCO 31,157 8,669<br />
POSCO ADR 5,928 411<br />
S-1 Corp. 8,165 682<br />
Samsung C&T Corp. 62,668 3,641<br />
Samsung Card Co. Ltd. 19,352 631<br />
Samsung Electro-Mechanics Co. Ltd. 29,710 1,940<br />
Samsung Electronics Co. Ltd. 55,426 70,090<br />
Samsung Engineering Co. Ltd.* 15,342 1,037<br />
Samsung Fire & Marine Insurance Co. Ltd. 17,976 4,054<br />
Samsung Heavy Industries Co. Ltd. 80,480 2,425<br />
Samsung Life Insurance Co. Ltd. 30,044 2,836<br />
Samsung SDI Co. Ltd. 16,751 2,543<br />
NUMBER<br />
OF SHARES<br />
continued<br />
VALUE<br />
(000S)<br />
COMMON STOCKS - 92.1%<br />
South Korea - 14.7% continued<br />
Samsung Securities Co. Ltd. 31,005 $1,140<br />
Samsung Techwin Co. Ltd. 18,261 995<br />
Shinhan Financial Group Co. Ltd. 214,490 9,443<br />
Shinsegae Co. Ltd. 3,406 737<br />
SK C&C Co. Ltd. 11,693 1,645<br />
SK Holdings Co. Ltd. 13,265 2,404<br />
SK Hynix, Inc.* 267,220 9,069<br />
SK Innovation Co. Ltd. 30,276 3,479<br />
SK Networks Co. Ltd. 66,100 589<br />
SK Telecom Co. Ltd. 3,695 750<br />
SK Telecom Co. Ltd. ADR 10,300 232<br />
S-Oil Corp. 22,253 1,287<br />
Woori Finance Holdings Co. Ltd. 181,430 2,069<br />
Woori Investment & Securities Co. Ltd. 66,997 557<br />
Yuhan Corp. 3,806 649<br />
284,280<br />
Taiwan-11.6%<br />
Acer, Inc.* 1,263,796 745<br />
Advanced Semiconductor Engineering, Inc. 3,104,364 3,433<br />
Advantech Co. Ltd. 140,285 910<br />
Asia Cement Corp. 1,036,831 1,294<br />
Asia Pacific Telecom Co. Ltd. 905,000 426<br />
Asustek Computer, Inc. 335,546 3,316<br />
AU Optronics Corp.* 4,253,215 1,502<br />
Catcher Technology Co. Ltd. 337,111 2,443<br />
Cathay Financial Holding Co. Ltd. 3,860,739 5,644<br />
Chailease Holding Co. Ltd. 351,200 846<br />
Chang Hwa Commercial Bank 2,261,163 1,341<br />
Cheng Shin Rubber Industry Co. Ltd. 790,184 2,256<br />
Cheng Uei Precision Industry Co. Ltd. 221,886 470<br />
Chicony Electronics Co. Ltd. 231,194 600<br />
China Airlines Ltd.* 1,448,307 478<br />
China Development Financial<br />
Holding Corp. 6,862,868 1,964<br />
China Life Insurance Co. Ltd. 1,115,413 1,026<br />
China Motor Corp. 328,000 293<br />
China Petrochemical Development Corp. 959,172 397<br />
China Steel Corp. 5,794,467 4,886<br />
Chunghwa Telecom Co. Ltd. 1,898,493 5,843<br />
Clevo Co. 271,970 536<br />
Compal Electronics, Inc. 2,044,759 1,447<br />
CTBC Financial Holding Co. Ltd. 6,644,088 4,163<br />
CTCI Corp. 316,000 474<br />
Delta Electronics, Inc. 922,521 5,718<br />
See Notes to the Financial Statements.<br />
NORTHERN FUNDS ANNUAL REPORT 31 EQUITY INDEX FUNDS
SCHEDULE OF INVESTMENTS<br />
EMERGING MARKETS EQUITY INDEX FUND continued<br />
NUMBER<br />
OF SHARES<br />
continued<br />
VALUE<br />
(000S)<br />
COMMON STOCKS - 92.1%<br />
Taiwan - 11.6% continued<br />
E.Sun Financial Holding Co. Ltd. 2,297,695 $1,387<br />
Eclat Textile Co. Ltd. 82,368 952<br />
Epistar Corp.* 419,351 1,007<br />
Eva Airways Corp.* 716,271 360<br />
Evergreen Marine Corp. Taiwan Ltd.* 795,795 464<br />
Far Eastern Department Stores Ltd. 557,362 492<br />
Far Eastern New Century Corp. 1,516,792 1,614<br />
Far EasTone Telecommunications Co. Ltd. 775,345 1,643<br />
Farglory Land Development Co. Ltd. 201,543 344<br />
Feng Hsin Iron & Steel Co. 237,160 399<br />
First Financial Holding Co. Ltd. 3,490,406 2,077<br />
Formosa Chemicals & Fibre Corp. 1,630,499 3,949<br />
Formosa International Hotels Corp. 21,476 255<br />
Formosa Petrochemical Corp. 551,487 1,404<br />
Formosa Plastics Corp. 2,082,682 5,223<br />
Formosa Taffeta Co. Ltd. 412,827 462<br />
Foxconn Technology Co. Ltd. 426,094 1,005<br />
Fubon Financial Holding Co. Ltd. 3,290,025 4,473<br />
Giant Manufacturing Co. Ltd. 142,483 971<br />
Hermes Microvision, Inc. 18,000 724<br />
Highwealth Construction Corp. 178,200 420<br />
Hiwin Technologies Corp. 92,651 900<br />
Hon Hai Precision Industry Co. Ltd. 5,604,620 15,892<br />
Hotai Motor Co. Ltd. 120,900 1,462<br />
HTC Corp. 357,220 1,796<br />
Hua Nan Financial Holdings Co. Ltd. 2,640,756 1,498<br />
Innolux Corp.* 3,267,392 1,119<br />
Inventec Corp. 1,136,314 1,124<br />
Kinsus Interconnect Technology Corp. 144,587 536<br />
Largan Precision Co. Ltd. 50,835 2,413<br />
LCY Chemical Corp. 284,648 332<br />
Lite-On Technology Corp. 1,010,411 1,507<br />
MediaTek, Inc. 710,334 10,520<br />
Mega Financial Holding Co. Ltd. 4,674,771 3,624<br />
Merida Industry Co. Ltd. 98,000 651<br />
Nan Kang Rubber Tire Co. Ltd.* 326,769 398<br />
Nan Ya Plastics Corp. 2,400,951 5,088<br />
Novatek Microelectronics Corp. 284,850 1,308<br />
Pegatron Corp. 820,594 1,226<br />
Phison Electronics Corp. 76,608 494<br />
Pou Chen Corp. 1,004,093 1,417<br />
Powertech Technology, Inc. 364,568 552<br />
President Chain Store Corp. 280,220 1,974<br />
Quanta Computer, Inc. 1,264,576 3,399<br />
NUMBER<br />
OF SHARES<br />
continued<br />
VALUE<br />
(000S)<br />
COMMON STOCKS - 92.1%<br />
Taiwan - 11.6% continued<br />
Radiant Opto-Electronics Corp. 221,800 $897<br />
Realtek Semiconductor Corp. 229,457 692<br />
Ruentex Development Co. Ltd. 339,562 623<br />
Ruentex Industries Ltd. 257,906 618<br />
ScinoPharm Taiwan Ltd. 113,360 304<br />
Shin Kong Financial Holding Co. Ltd. 3,372,398 1,066<br />
Siliconware Precision Industries Co. 1,480,480 1,963<br />
Simplo Technology Co. Ltd. 133,532 638<br />
SinoPac Financial Holdings Co. Ltd. 3,223,499 1,553<br />
Standard Foods Corp. 166,242 453<br />
Synnex Technology International Corp. 647,086 1,042<br />
Taishin Financial Holding Co. Ltd. 3,373,224 1,531<br />
Taiwan Business Bank* 1,520,922 449<br />
Taiwan Cement Corp. 1,641,055 2,528<br />
Taiwan Cooperative Financial Holding<br />
Co. Ltd. 2,750,708 1,475<br />
Taiwan Fertilizer Co. Ltd. 390,000 819<br />
Taiwan Glass Industry Corp. 431,377 416<br />
Taiwan Mobile Co. Ltd. 832,076 2,610<br />
Taiwan Semiconductor Manufacturing<br />
Co. Ltd. 12,360,193 48,296<br />
Teco Electric and Machinery Co. Ltd. 986,000 1,100<br />
TPK Holding Co. Ltd. 112,003 663<br />
Transcend Information, Inc. 109,442 356<br />
TSRC Corp. 320,892 480<br />
U-Ming Marine Transport Corp. 233,000 396<br />
Unimicron Technology Corp. 595,418 478<br />
Uni-President Enterprises Corp. 2,200,666 3,831<br />
United Microelectronics Corp. 6,128,043 2,592<br />
Vanguard International<br />
Semiconductor Corp. 349,000 523<br />
Walsin Lihwa Corp.* 1,792,770 572<br />
Wan Hai Lines Ltd. 255,825 123<br />
Wistron Corp. 1,101,225 908<br />
WPG Holdings Ltd. 703,316 848<br />
Ya Hsin Industrial Co. Ltd. (3) * 121,548 —<br />
Yang Ming Marine Transport Corp.* 753,356 317<br />
Yuanta Financial Holding Co. Ltd. 4,227,647 2,137<br />
Yulon Motor Co. Ltd. 366,257 604<br />
Zhen Ding Technology Holding Ltd. 122,850 315<br />
225,522<br />
Thailand - 2.2%<br />
Advanced Info Service PCL (Registered) 194,000 1,351<br />
Advanced Info Service PCL NVDR 339,599 2,373<br />
Airports of Thailand PCL NVDR 210,900 1,265<br />
See Notes to the Financial Statements.<br />
EQUITY INDEX FUNDS 32 NORTHERN FUNDS ANNUAL REPORT
MARCH 31, 2014<br />
NUMBER<br />
OF SHARES<br />
continued<br />
VALUE<br />
(000S)<br />
COMMON STOCKS - 92.1%<br />
Thailand - 2.2% continued<br />
Bangkok Bank PCL (Registered) 381,900 $2,117<br />
Bangkok Bank PCL NVDR 165,000 909<br />
Bangkok Dusit Medical Services<br />
PCL NVDR 140,700 577<br />
Banpu PCL (Registered) 233,500 194<br />
Banpu PCL NVDR 101,880 88<br />
BEC World PCL (Registered) 196,500 330<br />
BEC World PCL NVDR 271,507 457<br />
BTS Group Holdings PCL NVDR 2,670,400 692<br />
Central Pattana PCL NVDR 650,000 944<br />
Charoen Pokphand Foods PCL NVDR 1,363,457 1,180<br />
CP ALL PCL (Registered) 905,200 1,214<br />
CP ALL PCL NVDR 1,330,036 1,786<br />
Glow Energy PCL (Registered) 87,100 204<br />
Glow Energy PCL NVDR 141,402 332<br />
Home Product Center PCL NVDR 1,256,066 377<br />
Indorama Ventures PCL NVDR 725,547 514<br />
IRPC PCL (Registered) 1,860,900 197<br />
IRPC PCL NVDR 2,732,681 290<br />
Kasikornbank PCL 50,000 275<br />
Kasikornbank PCL (Registered) 141,500 809<br />
Kasikornbank PCL NVDR 760,997 4,187<br />
Krung Thai Bank PCL (Registered) 699,750 403<br />
Krung Thai Bank PCL NVDR 921,093 533<br />
Minor International PCL NVDR 741,300 568<br />
PTT Exploration & Production PCL<br />
(Registered) 242,500 1,174<br />
PTT Exploration & Production PCL NVDR 468,543 2,272<br />
PTT Global Chemical PCL (Registered) 189,814 423<br />
PTT Global Chemical PCL NVDR 638,576 1,425<br />
PTT PCL (Registered) 183,500 1,669<br />
PTT PCL NVDR 253,300 2,334<br />
Siam Cement (The) PCL (Registered) 51,000 655<br />
Siam Cement (The) PCL NVDR 172,398 2,220<br />
Siam Commercial Bank (The) PCL<br />
(Registered) 232,700 1,130<br />
Siam Commercial Bank (The) PCL NVDR 669,876 3,262<br />
Thai Oil PCL (Registered) 97,800 160<br />
Thai Oil PCL NVDR 277,095 454<br />
TMB Bank PCL NVDR 5,939,500 452<br />
True Corp. PCL NVDR* 2,475,400 528<br />
42,324<br />
Turkey - 1.6%<br />
Akbank T.A.S. 887,600 2,817<br />
Anadolu Efes Biracilik Ve Malt Sanayii A.S. 104,795 1,162<br />
NUMBER<br />
OF SHARES<br />
continued<br />
VALUE<br />
(000S)<br />
COMMON STOCKS - 92.1%<br />
Turkey - 1.6% continued<br />
Arcelik A.S. 111,248 $621<br />
BIM Birlesik Magazalar A.S. 104,615 2,355<br />
Coca-Cola Icecek A.S. 33,387 803<br />
Dogan Yayin Holding A.S.* 1 —<br />
Emlak Konut Gayrimenkul Yatirim<br />
Ortakligi A.S. 1,052,407 1,239<br />
Enka Insaat ve Sanayi A.S. 199,587 596<br />
Eregli Demir ve Celik Fabrikalari T.A.S. 692,624 893<br />
Ford Otomotiv Sanayi A.S. 31,388 320<br />
Haci Omer Sabanci Holding A.S. 405,338 1,572<br />
Is Gayrimenkul Yatirim Ortakligi A.S. 1 —<br />
KOC Holding A.S. 336,163 1,416<br />
Koza Altin Isletmeleri A.S. 25,703 221<br />
TAV Havalimanlari Holding A.S. 79,215 633<br />
Tofas Turk Otomobil Fabrikasi A.S. 74,079 420<br />
Tupras Turkiye Petrol Rafinerileri A.S. 60,472 1,278<br />
Turk Hava Yollari AO 280,175 862<br />
Turk Telekomunikasyon A.S. 255,063 705<br />
Turkcell Iletisim Hizmetleri A.S.* 389,484 2,161<br />
Turkiye Garanti Bankasi A.S. 1,149,230 3,926<br />
Turkiye Halk Bankasi A.S. 305,829 1,891<br />
Turkiye Is Bankasi, Class C 814,246 1,805<br />
Turkiye Sise ve Cam Fabrikalari A.S. 282,070 306<br />
Turkiye Vakiflar Bankasi Tao, Class D 421,848 795<br />
Ulker Biskuvi Sanayi A.S. 61,632 433<br />
Yapi ve Kredi Bankasi A.S. 426,471 808<br />
30,038<br />
Total Common Stocks (4)<br />
(Cost $1,494,446) 1,783,855<br />
PREFERRED STOCKS - 5.9%<br />
Brazil - 4.4%<br />
AES Tiete S.A. 58,353 464<br />
Banco Bradesco S.A. 985,462 13,499<br />
Banco do Estado do Rio Grande do Sul<br />
S.A., Class B 84,418 484<br />
Bradespar S.A. 118,301 1,031<br />
Braskem S.A., Class A* 87,041 683<br />
Centrais Eletricas Brasileiras S.A., Class B* 102,041 492<br />
Cia Brasileira de Distribuicao Grupo Pao<br />
de Acucar 69,842 3,054<br />
Cia Energetica de Minas Gerais 372,947 2,521<br />
Cia Energetica de Sao Paulo, Class B 77,308 904<br />
Cia Paranaense de Energia, Class B 53,744 706<br />
Gerdau S.A. 424,961 2,716<br />
See Notes to the Financial Statements.<br />
NORTHERN FUNDS ANNUAL REPORT 33 EQUITY INDEX FUNDS
SCHEDULE OF INVESTMENTS<br />
EMERGING MARKETS EQUITY INDEX FUND continued<br />
NUMBER<br />
OF SHARES<br />
continued<br />
VALUE<br />
(000S)<br />
PREFERRED STOCKS - 5.9%<br />
Brazil - 4.4% continued<br />
Itau Unibanco Holding S.A. 1,260,780 $18,803<br />
Itausa - Investimentos Itau S.A. 1,457,325 5,928<br />
Klabin S.A. 1,254,105 1,299<br />
Lojas Americanas S.A. 211,994 1,561<br />
Marcopolo S.A. 201,852 405<br />
Metalurgica Gerdau S.A. 141,399 1,077<br />
Oi S.A. 235,198 321<br />
Petroleo Brasileiro S.A.* 1,985,195 13,736<br />
Suzano Papel e Celulose S.A., Class A 138,500 509<br />
Telefonica Brasil S.A. 140,791 2,976<br />
Telefonica Brasil S.A. ADR 9,345 199<br />
Usinas Siderurgicas de Minas Gerais S.A.,<br />
Class A* 189,744 853<br />
Vale S.A. 952,830 11,884<br />
86,105<br />
Chile-0.1%<br />
Embotelladora Andina S.A., Class B 145,037 525<br />
Sociedad Quimica y Minera de<br />
Chile S.A., Class B 43,713 1,386<br />
1,911<br />
Colombia - 0.3%<br />
Banco Davivienda S.A. 45,289 585<br />
Bancolombia S.A. 179,537 2,498<br />
Grupo Argos S.A. 55,321 578<br />
Grupo Aval Acciones y Valores 847,883 561<br />
Grupo de Inversiones Suramericana S.A. 47,747 891<br />
5,113<br />
Russia - 0.3%<br />
AK Transneft OAO 767 1,668<br />
Sberbank of Russia 494,594 949<br />
Surgutneftegas OAO 2,032,924 1,474<br />
Surgutneftegas OAO ADR 140,161 1,016<br />
5,107<br />
South Korea - 0.8%<br />
Hyundai Motor Co. Ltd. 19,218 2,743<br />
Hyundai Motor Co. Ltd. 11,700 1,497<br />
LG Chem Ltd. 4,159 582<br />
Samsung Electronics Co. Ltd. 10,297 10,219<br />
15,041<br />
Total Preferred Stocks (4)<br />
(Cost $128,154) 113,277<br />
(1)<br />
(2)<br />
(3)<br />
(4)<br />
(5)<br />
(6)<br />
*<br />
NUMBER<br />
OF SHARES<br />
VALUE<br />
(000S)<br />
RIGHTS - 0.0%<br />
Brazil - 0.0%<br />
Itausa - Investimentos Itau S.A.* 23,514 $22<br />
Chile - 0.0%<br />
AES Gener S.A.* 48,153 4<br />
India - 0.0%<br />
Tata Power Co. Ltd.* 64,267 27<br />
Total Rights (4)<br />
(Cost $28) 53<br />
INVESTMENT COMPANIES - 1.0%<br />
iShares MSCI Emerging Markets ETF 196,700 8,062<br />
<strong>Northern</strong> Institutional <strong>Funds</strong> -<br />
Diversified Assets Portfolio, 0.01% (5) (6) 11,081,872 11,082<br />
Total Investment Companies<br />
(Cost $18,777) 19,144<br />
Total Investments - 99.0%<br />
(Cost $1,641,405) 1,916,329<br />
Other Assets less Liabilities - 1.0% 20,201<br />
NET ASSETS - 100.0% $1,936,530<br />
Securities exempt from registration under Rule 144A of the Securities Act of<br />
1933. These securities may be resold in transactions exempt from registration,<br />
normally to qualified institutional buyers. The value of these securities is determined<br />
by valuations supplied by a pricing service or brokers, or, if not available,<br />
in accordance with procedures established by the Trustees of <strong>Northern</strong><br />
<strong>Funds</strong>.<br />
Restricted security that has been deemed illiquid. At March 31, 2014, the<br />
value of these restricted illiquid securities amounted to approximately<br />
$2,201,000 or 0.1% of net assets. Additional information on each restricted<br />
illiquid security is as follows:<br />
SECURITY<br />
ACQUISITION<br />
AND<br />
ENFORCEABLE<br />
DATE<br />
ACQUISITION<br />
COST<br />
(000S)<br />
Reliance Industries Ltd. GDR 11/1/06-12/06/12 $1,996<br />
VTB Bank OJSC GDR 5/11/07-10/28/09 80<br />
Level 3 asset that is worthless, bankrupt or has been delisted.<br />
In accordance with the Fund’s prospectus, adjustment factors were provided<br />
by an independent evaluation service to determine the value of certain<br />
foreign securities.<br />
The Fund had approximately $11,082,000 of net purchases in the Diversified<br />
Assets Portfolio of the <strong>Northern</strong> Institutional <strong>Funds</strong> during the fiscal year<br />
ended March 31, 2014.<br />
Investment in affiliated Portfolio. <strong>Northern</strong> Trust Investments, Inc. is the investment<br />
adviser to the Fund and the investment adviser to the <strong>Northern</strong> Institutional<br />
<strong>Funds</strong>.<br />
Non-Income Producing Security<br />
See Notes to the Financial Statements.<br />
EQUITY INDEX FUNDS 34 NORTHERN FUNDS ANNUAL REPORT
MARCH 31, 2014<br />
Percentages shown are based on Net Assets. The classifications shown on the<br />
Schedule of Investments and in the tables herein are unaudited.<br />
At March 31, 2014, the Fund had open futures contracts as follows:<br />
TYPE<br />
NUMBER OF<br />
CONTRACTS<br />
NOTIONAL<br />
AMOUNT<br />
(000S)<br />
CONTRACT<br />
POSITION<br />
CONTRACT<br />
EXP.<br />
UNREALIZED<br />
GAINS (LOSSES)<br />
(000S)<br />
Dax <strong>Index</strong><br />
(Euro) 2 $660 Long 6/14 $40<br />
FTSE/JSE Top<br />
40 <strong>Index</strong><br />
(South<br />
African Rand) 75 3,090 Long 6/14 108<br />
Hang Seng<br />
<strong>Index</strong> (Hong<br />
Kong Dollar) 23 3,283 Long 4/14 60<br />
mini MSCI<br />
Emerging<br />
Markets<br />
<strong>Index</strong> (United<br />
States Dollar) 344 16,961 Long 6/14 943<br />
MSCI Taiwan<br />
<strong>Index</strong> (United<br />
States Dollar) 124 3,873 Long 4/14 105<br />
S&P/TSX 60<br />
<strong>Index</strong><br />
(Canadian<br />
Dollar) 11 1,628 Long 6/14 9<br />
SGX CNX<br />
Nifty <strong>Index</strong><br />
(United States<br />
Dollar) 132 1,783 Long 4/14 25<br />
SPI 200<br />
<strong>Index</strong><br />
(Australian<br />
Dollar) 5 625 Long 6/14 9<br />
Total $1,299<br />
At March 31, 2014, the Fund had outstanding forward foreign currency<br />
exchange contracts as follows:<br />
CONTRACTS<br />
TO<br />
AMOUNT<br />
(LOCAL<br />
IN<br />
EXCHANGE<br />
AMOUNT<br />
(LOCAL<br />
UNREALIZED<br />
GAINS<br />
DELIVER CURRENCY) FOR CURRENCY) SETTLEMENT (LOSSES)<br />
COUNTERPARTY CURRENCY (000S) CURRENCY (000S) DATE (000S)<br />
UBS United States Dollar 850 Indian Rupee 52,998 6/18/14 $20<br />
UBS United States Dollar 2,140 Korean Won 2,306,064 6/18/14 22<br />
UBS United States Dollar 2,300 Taiwan Dollar 69,658 6/18/14 (7)<br />
Total $35<br />
At March 31, 2014, the industry sectors (unaudited) for the Fund were:<br />
% OF LONG-TERM<br />
INDUSTRY SECTOR<br />
INVESTMENTS<br />
Consumer Discretionary 9.2%<br />
Consumer Staples 8.5<br />
Energy 10.8<br />
Financials 27.1<br />
Health Care 1.7<br />
Industrials 6.5<br />
Information Technology 16.6<br />
Materials 9.3<br />
Telecommunication Services 6.9<br />
Utilities 3.4<br />
Total 100.0%<br />
At March 31, 2014, the Fund’s investments were denominated in the following<br />
currencies (unaudited):<br />
% OF LONG-TERM<br />
CONCENTRATION BY CURRENCY<br />
INVESTMENTS<br />
Hong Kong Dollar 18.8%<br />
Korean Won 15.7<br />
Taiwan Dollar 11.8<br />
Brazilian Real 10.7<br />
South African Rand 7.7<br />
United States Dollar 7.0<br />
Indian Rupee 6.3<br />
Mexican Peso 5.1<br />
All other currencies less than 5% 16.9<br />
Total 100.0%<br />
Various inputs are used in determining the value of the Fund’s investments. These<br />
inputs are summarized in the three levels listed below.<br />
Level 1 - Unadjusted quoted market prices in active markets for identical securities<br />
on the measurement date.<br />
Level 2 - Other observable inputs (e.g., quoted prices in active markets for similar<br />
securities, securities valuations based on commonly quoted benchmark interest<br />
rates and yield curves, maturities, ratings and/or securities indices). The Fund<br />
adjusted the price of certain foreign equity securities held in its portfolio on<br />
March 31, 2014 using adjustment factors designed to reflect more accurately the<br />
fair value of the securities. See Note 2 for a discussion of this procedure. The fair<br />
valuation of these securities resulted in their categorization as Level 2 investments.<br />
Level 3 - Significant unobservable inputs (e.g., information about assumptions,<br />
including risk, market participants would use in pricing a security).<br />
See Notes to the Financial Statements.<br />
NORTHERN FUNDS ANNUAL REPORT 35 EQUITY INDEX FUNDS
SCHEDULE OF INVESTMENTS<br />
EMERGING MARKETS EQUITY INDEX FUND continued MARCH 31, 2014<br />
The inputs or methodologies used for valuing securities are not necessarily an<br />
indication of the risk associated with investing in those securities and other<br />
financial instruments, if any. The following table summarizes the valuation of the<br />
Fund’s investments by the above fair value hierarchy as of March 31, 2014:<br />
LEVEL 1<br />
(000S)<br />
LEVEL 2<br />
(000S)<br />
LEVEL 3<br />
(000S)<br />
TOTAL<br />
(000S)<br />
INVESTMENTS<br />
Common Stocks<br />
Brazil $121,063 $ — $ — $ 121,063<br />
Chile 28,016 — — 28,016<br />
Colombia 15,460 — — 15,460<br />
India 6,152 121,665 — 127,817<br />
Mexico 98,030 — — 98,030<br />
Peru 8,368 — — 8,368<br />
Russia 45,466 50,909 — 96,375<br />
South Korea 734 283,546 — 284,280<br />
All Other Countries — 1,004,446 (1) — 1,004,446<br />
Preferred Stocks<br />
South Korea — 15,041 — 15,041<br />
All Other Countries 98,236 (1) — — 98,236<br />
Rights<br />
India — 27 — 27<br />
All Other Countries 26 (1) — — 26<br />
Investment Companies 19,144 — — 19,144<br />
Total Investments $440,695 $1,475,634 $ — $1,916,329<br />
The Fund discloses all transfers between levels based on valuations at the end of<br />
each reporting period.<br />
At March 31, 2014, the Fund had transfers from Level 1 to Level 2 as<br />
disclosed below:<br />
Transfers from Level 1 to Level 2<br />
Country<br />
Common Stocks<br />
China<br />
Malaysia<br />
Russia<br />
South Korea<br />
Taiwan<br />
Thailand<br />
Turkey<br />
Preferred Stocks<br />
South Korea<br />
Value<br />
(000S)<br />
Total $ 682,556<br />
Reason<br />
$1,773 Valuations at last trade with foreign value adjustments<br />
71,327 Valuations at last trade with foreign value adjustments<br />
19,410 Valuations at last trade with foreign value adjustments<br />
281,833 Valuations at last trade with foreign value adjustments<br />
223,622 Valuations at last trade with foreign value adjustments<br />
39,512 Valuations at last trade with foreign value adjustments<br />
30,038 Valuations at last trade with foreign value adjustments<br />
15,041 Valuations at last trade with foreign value adjustments<br />
OTHER FINANCIAL<br />
INSTRUMENTS<br />
Assets<br />
Futures Contracts $ 1,299 $ — $ — $ 1,299<br />
Forward Foreign<br />
Currency Exchange<br />
Contracts — 42 — 42<br />
Liabilities<br />
Forward Foreign<br />
Currency Exchange<br />
Contracts — (7) — (7)<br />
Total Other Financial<br />
Instruments $ 1,299 $ 35 $ — $ 1,334<br />
(1)<br />
Classifications as defined in the Schedule of Investments.<br />
See Notes to the Financial Statements.<br />
EQUITY INDEX FUNDS 36 NORTHERN FUNDS ANNUAL REPORT
SCHEDULE OF INVESTMENTS<br />
GLOBAL REAL ESTATE INDEX FUND MARCH 31, 2014<br />
NUMBER<br />
OF SHARES<br />
VALUE<br />
(000S)<br />
COMMON STOCKS - 98.4%<br />
Australia - 5.8%<br />
Australand Property Group 509,021 $1,991<br />
BGP Holdings PLC -<br />
(Fractional Shares)* 6,535,576 —<br />
BWP Trust 524,711 1,135<br />
CFS Retail Property Trust Group 2,332,112 4,089<br />
Charter Hall Retail REIT* 340,456 1,131<br />
Cromwell Property Group 1,593,586 1,420<br />
Dexus Property Group 6,364,358 6,257<br />
Federation Centres Ltd. 1,577,908 3,454<br />
Goodman Group 1,893,089 8,308<br />
GPT Group 1,736,934 5,896<br />
Investa Office Fund 664,950 1,999<br />
Mirvac Group 4,047,237 6,383<br />
Stockland 2,547,110 8,862<br />
Westfield Group 2,134,572 20,300<br />
Westfield Retail Trust 3,373,392 9,325<br />
80,550<br />
Austria - 0.6%<br />
Atrium European Real Estate Ltd.* 184,951 1,043<br />
CA Immobilien Anlagen A.G.* 80,557 1,453<br />
Conwert Immobilien Invest S.E. 67,577 895<br />
IMMOFINANZ A.G.* 1,055,081 4,935<br />
8,326<br />
Belgium - 0.4%<br />
Aedifica S.A. 9,759 672<br />
Befimmo S.A. 18,428 1,306<br />
Cofinimmo 18,660 2,226<br />
Intervest Offices & Warehouses 7,469 226<br />
Leasinvest Real Estate S.C.A. 2,164 239<br />
Warehouses De Pauw S.C.A. 12,081 908<br />
Wereldhave Belgium N.V. 2,167 266<br />
5,843<br />
Brazil - 1.3%<br />
Aliansce Shopping Centers S.A. 87,408 684<br />
BR Malls Participacoes S.A. 474,823 4,079<br />
BR Properties S.A. 219,383 1,798<br />
Brookfield Incorporacoes S.A.* 279,779 181<br />
Cyrela Brazil Realty S.A. Empreendimentos<br />
e Participacoes 307,928 1,866<br />
Direcional Engenharia S.A. 90,130 398<br />
Even Construtora e Incorporadora S.A. 215,975 716<br />
Ez Tec Empreendimentos e<br />
Participacoes S.A. 54,940 678<br />
Gafisa S.A. 480,700 750<br />
NUMBER<br />
OF SHARES<br />
continued<br />
VALUE<br />
(000S)<br />
COMMON STOCKS - 98.4%<br />
Brazil - 1.3% continued<br />
General Shopping Brasil S.A.* 21,504 $75<br />
Helbor Empreendimentos S.A. 132,036 459<br />
Iguatemi Empresa de Shopping<br />
Centers S.A. 65,872 632<br />
JHSF Participacoes S.A. 123,216 217<br />
MRV Engenharia e Participacoes S.A. 340,303 1,203<br />
Multiplan Empreendimentos<br />
Imobiliarios S.A. 84,821 1,809<br />
PDG Realty S.A. Empreendimentos<br />
e Participacoes* 1,479,182 945<br />
Rodobens Negocios Imobiliarios S.A. 28,773 148<br />
Rossi Residencial S.A.* 306,531 246<br />
Sao Carlos Empreendimentos e<br />
Participacoes S.A. 19,134 274<br />
Sonae Sierra Brasil S.A. 28,815 239<br />
Tecnisa S.A.* 98,731 346<br />
17,743<br />
Canada - 3.2%<br />
Allied Properties Real Estate<br />
Investment Trust 74,898 2,337<br />
Artis Real Estate Investment Trust 138,617 1,972<br />
Boardwalk Real Estate Investment Trust 43,740 2,399<br />
Calloway Real Estate Investment Trust 112,030 2,611<br />
Canadian Apartment Properties REIT 121,931 2,352<br />
Canadian Real Estate Investment Trust 74,767 3,048<br />
Chartwell Retirement Residences 190,589 1,795<br />
Cominar Real Estate Investment Trust 140,206 2,346<br />
Crombie Real Estate Investment Trust 80,081 966<br />
Dundee International Real Estate<br />
Investment Trust 104,525 877<br />
Dundee Real Estate Investment Trust,<br />
Class A 114,871 3,020<br />
Extendicare, Inc. 94,378 590<br />
First Capital Realty, Inc. 90,295 1,433<br />
Granite Real Estate Investment Trust 51,817 1,906<br />
H&R Real Estate Investment Trust 295,872 6,118<br />
InnVest Real Estate Investment Trust 93,908 449<br />
Killam Properties, Inc. 55,724 514<br />
Morguard Real Estate Investment Trust 38,031 585<br />
<strong>Northern</strong> Property Real Estate<br />
Investment Trust 35,351 886<br />
Pure Industrial Real Estate Trust 166,620 722<br />
RioCan Real Estate Investment Trust 331,717 7,991<br />
44,917<br />
See Notes to the Financial Statements.<br />
NORTHERN FUNDS ANNUAL REPORT 37 EQUITY INDEX FUNDS
SCHEDULE OF INVESTMENTS<br />
GLOBAL REAL ESTATE INDEX FUND continued<br />
NUMBER<br />
OF SHARES<br />
continued<br />
VALUE<br />
(000S)<br />
COMMON STOCKS - 98.4%<br />
Chile-0.1%<br />
Parque Arauco S.A. 580,890 $1,109<br />
China - 1.8%<br />
Agile Property Holdings Ltd. 1,379,979 1,135<br />
Beijing Capital Land Ltd., Class H 1,138,000 418<br />
Beijing North Star Co. Ltd., Class H 767,662 176<br />
China Merchants Property Development<br />
Co. Ltd., Class B 157,408 381<br />
China Vanke Co. Ltd., Class B 1,453,241 2,418<br />
Country Garden Holdings Co. Ltd. 4,841,233 2,022<br />
Evergrande Real Estate Group Ltd. 6,548,000 3,097<br />
Fantasia Holdings Group Co. Ltd. 1,849,500 274<br />
Greenland Hong Kong Holdings Ltd. 346,000 167<br />
Greentown China Holdings Ltd. 857,500 926<br />
Guangzhou R&F Properties Co. Ltd.,<br />
Class H 1,067,802 1,545<br />
Hui Xian Real Estate Investment Trust 2,231,930 1,226<br />
Kaisa Group Holdings Ltd. 2,072,600 746<br />
Longfor Properties Co. Ltd. 1,499,000 2,074<br />
Powerlong Real Estate Holdings Ltd. 1,533,000 238<br />
Renhe Commercial Holdings Co. Ltd.* 11,684,000 723<br />
Shanghai Lujiazui Finance & Trade Zone<br />
Development Co. Ltd., Class B 561,344 843<br />
Shui On Land Ltd. 3,781,277 1,053<br />
Sino-Ocean Land Holdings Ltd. 3,936,519 2,157<br />
SOHO China Ltd. 1,696,256 1,395<br />
Sunac China Holdings Ltd. 1,760,050 1,024<br />
Wuzhou International Holdings Ltd.* 1,302,000 282<br />
24,320<br />
Egypt - 0.0%<br />
Six of October Development<br />
& Investment* 71,164 263<br />
Finland - 0.2%<br />
Citycon OYJ 253,033 901<br />
Sponda OYJ 265,730 1,261<br />
Technopolis OYJ 104,213 605<br />
2,767<br />
France - 3.2%<br />
Affine S.A. 6,432 131<br />
ANF Immobilier 7,680 253<br />
Fonciere Des Regions 37,196 3,445<br />
Gecina S.A. 20,296 2,700<br />
ICADE 35,786 3,544<br />
Klepierre 107,857 4,830<br />
Mercialys S.A. 45,804 959<br />
NUMBER<br />
OF SHARES<br />
continued<br />
VALUE<br />
(000S)<br />
COMMON STOCKS - 98.4%<br />
France - 3.2% continued<br />
Orco Property Group* 46,633 $64<br />
Societe de la Tour Eiffel 6,170 423<br />
Unibail-Rodamco S.E. 107,392 27,923<br />
44,272<br />
Germany - 1.5%<br />
Alstria Office REIT-A.G. 74,990 1,005<br />
Deutsche Annington Immobilien S.E.* 68,961 1,968<br />
Deutsche Euroshop A.G. 50,598 2,303<br />
Deutsche Wohnen A.G.* 129,481 2,706<br />
Deutsche Wohnen A.G. (Bearer) 186,429 3,999<br />
DIC Asset A.G. 37,422 346<br />
GAGFAH S.A.* 140,404 2,134<br />
Hamborner REIT A.G. 49,993 530<br />
LEG Immobilien A.G. 53,770 3,529<br />
Prime Office A.G.* 72,017 287<br />
TAG Immobilien A.G. 136,732 1,695<br />
20,502<br />
Greece - 0.0%<br />
Eurobank Properties Real Estate<br />
Investment Co.* 26,282 329<br />
Hong Kong - 8.3%<br />
C C Land Holdings Ltd. 1,430,000 316<br />
Champion REIT 2,561,846 1,170<br />
China Overseas Land & Investment Ltd. 4,508,542 11,697<br />
China Resources Land Ltd. 2,059,218 4,523<br />
CIFI Holdings Group Co. Ltd. 1,908,880 374<br />
CSI Properties Ltd. 5,900,000 209<br />
Franshion Properties China Ltd. 4,050,000 1,356<br />
Glorious Property Holdings Ltd.* 2,751,100 376<br />
Hang Lung Properties Ltd. 2,465,452 7,094<br />
Henderson Land Development Co. Ltd. 1,137,434 6,657<br />
Hongkong Land Holdings Ltd. 1,295,618 8,380<br />
Hopson Development Holdings Ltd.* 700,000 652<br />
Hysan Development Co. Ltd. 692,045 3,016<br />
K Wah International Holdings Ltd. 1,166,998 786<br />
Kerry Properties Ltd. 709,099 2,364<br />
KWG Property Holding Ltd. 1,276,500 704<br />
Link REIT (The) 2,522,800 12,415<br />
Mingfa Group International Co. Ltd.* 1,066,000 282<br />
Minmetals Land Ltd. 1,400,000 159<br />
New World China Land Ltd. 2,861,899 2,414<br />
New World Development Co. Ltd. 4,149,878 4,176<br />
Poly Property Group Co. Ltd. 2,012,000 890<br />
See Notes to the Financial Statements.<br />
EQUITY INDEX FUNDS 38 NORTHERN FUNDS ANNUAL REPORT
MARCH 31, 2014<br />
COMMON STOCKS - 98.4%<br />
Hong Kong - 8.3% continued<br />
NUMBER<br />
OF SHARES<br />
continued<br />
VALUE<br />
(000S)<br />
Shanghai Industrial Urban Development<br />
Group Ltd.* 1,452,000 $279<br />
Shenzhen Investment Ltd. 2,397,635 776<br />
Shimao Property Holdings Ltd. 1,378,869 3,036<br />
Sino Land Co. Ltd. 3,284,216 4,830<br />
Sinolink Worldwide Holdings Ltd.* 2,186,000 178<br />
Sun Hung Kai Properties Ltd. 1,701,619 20,865<br />
Swire Properties Ltd. 1,291,600 3,692<br />
Wharf Holdings Ltd. 1,672,317 10,706<br />
Yuexiu Property Co. Ltd. 5,209,400 1,078<br />
115,450<br />
India - 0.2%<br />
DLF Ltd. 471,935 1,400<br />
Oberoi Realty Ltd. 87,033 315<br />
Prestige Estates Projects Ltd. 92,972 266<br />
Unitech Ltd.* 1,505,361 352<br />
2,333<br />
Indonesia - 0.6%<br />
Agung Podomoro Land Tbk PT 8,106,696 204<br />
Alam Sutera Realty Tbk PT 13,012,040 691<br />
Bumi Serpong Damai PT 7,733,600 1,125<br />
Ciputra Development Tbk PT 11,730,490 1,212<br />
Ciputra Property Tbk PT 2,992,838 219<br />
Ciputra Surya Tbk PT 876,600 186<br />
Intiland Development Tbk PT 5,833,400 234<br />
Kawasan Industri Jababeka Tbk PT 17,111,207 389<br />
Lippo Karawaci Tbk PT 21,148,031 2,022<br />
PakuwonJatiTbkPT 13,771,140 426<br />
Sentul City Tbk PT* 20,140,417 324<br />
Summarecon Agung Tbk PT 11,955,000 1,134<br />
8,166<br />
Israel - 0.1%<br />
Azrieli Group 40,058 1,401<br />
Italy - 0.1%<br />
Beni Stabili S.p.A. 912,746 786<br />
Immobiliare Grande Distribuzione 149,605 267<br />
1,053<br />
Japan - 11.2%<br />
Activia Properties, Inc. 247 1,986<br />
Advance Residence Investment Corp. 1,406 2,993<br />
Aeon Mall Co. Ltd. 109,466 2,809<br />
Daiwa House Residential Investment Corp. 337 1,354<br />
Frontier Real Estate Investment Corp. 520 2,764<br />
NUMBER<br />
OF SHARES<br />
continued<br />
VALUE<br />
(000S)<br />
COMMON STOCKS - 98.4%<br />
Japan - 11.2% continued<br />
GLP J-Reit 1,959 $1,978<br />
Hulic Co. Ltd. 326,340 4,458<br />
Industrial & Infrastructure Fund<br />
Investment Corp. 164 1,348<br />
Japan Excellent, Inc. 1,205 1,535<br />
Japan Logistics Fund, Inc. 915 2,060<br />
Japan Prime Realty Investment Corp. 876 2,833<br />
Japan Real Estate Investment Corp. 1,303 6,535<br />
Japan Retail Fund Investment Corp. 2,548 5,013<br />
Kenedix Office Investment Corp. 365 1,809<br />
Mitsubishi Estate Co. Ltd. 1,397,480 33,257<br />
Mitsui Fudosan Co. Ltd. 934,562 28,451<br />
Mori Hills REIT Investment Corp. 1,263 1,668<br />
Mori Trust Sogo Reit, Inc. 1,090 1,641<br />
Nippon Accommodations Fund, Inc. 490 1,639<br />
Nippon Building Fund, Inc. 1,456 7,598<br />
Nippon Prologis REIT, Inc. 1,445 2,913<br />
Nomura Real Estate Holdings, Inc. 132,700 2,528<br />
Nomura Real Estate Master Fund, Inc. 1,836 1,887<br />
Nomura Real Estate Office Fund, Inc. 391 1,709<br />
NTT Urban Development Corp. 120,000 1,127<br />
Orix JREIT, Inc. 2,154 2,686<br />
Premier Investment Corp. 230 892<br />
Sumitomo Realty & Development Co. Ltd. 478,425 18,696<br />
Tokyo Tatemono Co. Ltd. 454,201 3,887<br />
Tokyu REIT, Inc. 1,012 1,224<br />
Top REIT, Inc. 186 844<br />
United Urban Investment Corp. 2,628 3,858<br />
155,980<br />
Malaysia - 0.6%<br />
Axis Real Estate Investment Trust 428,000 443<br />
CapitaMalls Malaysia Trust 1,157,600 521<br />
Eastern & Oriental Bhd. 800,000 519<br />
Glomac Bhd. 381,200 126<br />
IGB Corp. Bhd. 951,454 790<br />
IGB Real Estate Investment Trust 1,797,000 627<br />
IJM Land Bhd. 423,750 384<br />
KLCC Property Holdings Bhd. 499,048 970<br />
Mah Sing Group Bhd. 978,320 654<br />
Malaysian Resources Corp. Bhd. 894,200 450<br />
MKH Bhd. 154,800 231<br />
Pavilion Real Estate Investment Trust 998,800 401<br />
SP Setia Bhd. 920,735 824<br />
Tebrau Teguh Bhd.* 431,200 163<br />
See Notes to the Financial Statements.<br />
NORTHERN FUNDS ANNUAL REPORT 39 EQUITY INDEX FUNDS
SCHEDULE OF INVESTMENTS<br />
GLOBAL REAL ESTATE INDEX FUND continued<br />
NUMBER<br />
OF SHARES<br />
continued<br />
VALUE<br />
(000S)<br />
COMMON STOCKS - 98.4%<br />
Malaysia - 0.6% continued<br />
Tropicana Corp. Bhd. 368,200 $177<br />
UEM Sunrise Bhd. 1,670,740 1,125<br />
UOA Development Bhd. 460,500 306<br />
YTL Land & Development Bhd.* 340,300 92<br />
8,803<br />
Mexico - 0.5%<br />
Concentradora Fibra Danhos S.A. de C.V. 218,500 445<br />
Consorcio ARA S.A.B. de C.V.* 736,493 329<br />
Corp. GEO S.A.B. de C.V.,<br />
Series B (1) * 549,034 —<br />
Desarrolladora Homex S.A.B. de C.V.* 234,285 57<br />
Fibra Uno Administracion S.A. de C.V. 1,664,200 5,384<br />
Mexico Real Estate Management S.A.<br />
de C.V.* 659,800 1,244<br />
Urbi Desarrollos Urbanos S.A.B. de C.V.* 776,726 1<br />
7,460<br />
Netherlands - 0.7%<br />
Corio N.V. 73,806 3,375<br />
Eurocommercial Properties N.V. - CVA 45,815 2,013<br />
Nieuwe Steen Investments N.V. 143,768 872<br />
Vastned Retail N.V. 20,464 1,009<br />
Wereldhave N.V. 23,957 2,041<br />
9,310<br />
New Zealand - 0.1%<br />
Kiwi Income Property Trust 1,112,564 1,077<br />
Norway - 0.0%<br />
Norwegian Property ASA 578,582 701<br />
Philippines - 0.7%<br />
Ayala Land, Inc. 6,225,951 4,152<br />
Filinvest Land, Inc. 10,826,989 348<br />
Megaworld Corp. 11,696,101 1,095<br />
Robinsons Land Corp. 1,816,975 889<br />
SM Prime Holdings, Inc. 8,295,153 2,705<br />
Vista Land & Lifescapes, Inc. 3,813,861 448<br />
9,637<br />
Poland - 0.0%<br />
Globe Trade Centre S.A.* 256,193 608<br />
Russia - 0.1%<br />
PIK Group* 312,128 719<br />
Singapore - 3.6%<br />
Ascendas India Trust 754,000 461<br />
Ascendas Real Estate Investment Trust 2,172,753 3,902<br />
NUMBER<br />
OF SHARES<br />
continued<br />
VALUE<br />
(000S)<br />
COMMON STOCKS - 98.4%<br />
Singapore - 3.6% continued<br />
CapitaCommercial Trust 2,163,014 $2,557<br />
CapitaLand Ltd. 2,798,915 6,442<br />
CapitaMall Trust 2,862,715 4,299<br />
CapitaMalls Asia Ltd. 1,504,000 2,139<br />
CDL Hospitality Trusts 693,610 913<br />
City Developments Ltd. 652,000 5,246<br />
First Real Estate Investment Trust 519,510 444<br />
Fortune Real Estate Investment Trust 1,464,920 1,114<br />
Global Logistic Properties Ltd. 3,309,793 6,969<br />
Keppel Land Ltd. 783,027 2,097<br />
Keppel REIT 1,626,720 1,474<br />
Mapletree Commercial Trust 1,412,000 1,371<br />
Mapletree Greater China<br />
Commercial Trust 1,997,000 1,296<br />
Mapletree Industrial Trust 1,299,948 1,411<br />
Mapletree Logistics Trust 1,579,374 1,314<br />
Suntec Real Estate Investment Trust 2,267,291 2,992<br />
UOL Group Ltd. 501,000 2,492<br />
Wing Tai Holdings Ltd. 423,355 617<br />
Yanlord Land Group Ltd. 731,000 623<br />
50,173<br />
South Africa - 1.2%<br />
Acucap Properties Ltd. 174,814 663<br />
Arrowhead Properties Ltd., Class A 319,878 213<br />
Arrowhead Properties Ltd., Class B 319,929 208<br />
Attacq Ltd.* 434,834 744<br />
Capital Property Fund 1,475,442 1,469<br />
Emira Property Fund 470,676 627<br />
Fountainhead Property Trust 501,152 358<br />
Growthpoint Properties Ltd. 2,029,467 4,706<br />
Hyprop Investments Ltd. 260,513 1,899<br />
Redefine Properties Ltd.* 3,325,547 3,015<br />
Resilient Property Income Fund Ltd. 255,222 1,376<br />
SA Corporate Real Estate Fund Nominees<br />
Pty Ltd. 1,991,407 756<br />
Vukile Property Fund Ltd. 563,425 896<br />
16,930<br />
Spain - 0.0%<br />
Inmobiliaria Colonial S.A.* 132,409 342<br />
Sweden - 1.0%<br />
Castellum AB 181,066 3,010<br />
Dios Fastigheter AB 41,239 342<br />
Fabege AB 146,122 1,905<br />
Fastighets AB Balder, Class B* 100,492 1,218<br />
See Notes to the Financial Statements.<br />
EQUITY INDEX FUNDS 40 NORTHERN FUNDS ANNUAL REPORT
MARCH 31, 2014<br />
NUMBER<br />
OF SHARES<br />
continued<br />
VALUE<br />
(000S)<br />
COMMON STOCKS - 98.4%<br />
Sweden - 1.0% continued<br />
Hemfosa Fastigheter AB* 42,639 $659<br />
Hufvudstaden AB, Class A 122,273 1,727<br />
Klovern AB 82,866 443<br />
Kungsleden AB 150,979 1,247<br />
Wallenstam AB, Class B 110,342 1,809<br />
Wihlborgs Fastigheter AB 72,993 1,422<br />
13,782<br />
Switzerland - 0.9%<br />
Allreal Holding A.G. (Registered)* 10,486 1,513<br />
Mobimo Holding A.G. (Registered)* 6,760 1,434<br />
PSP Swiss Property A.G. (Registered)* 43,877 4,127<br />
Swiss Prime Site A.G. (Registered)* 60,681 5,161<br />
12,235<br />
Taiwan - 0.0%<br />
Hung Poo Real Estate Development Corp. 221,585 204<br />
Thailand - 0.5%<br />
Amata Corp. PCL (Registered) 141,686 65<br />
Amata Corp. PCL NVDR 436,771 200<br />
AP Thailand PCL (Registered) 401,278 64<br />
AP Thailand PCL NVDR 525,104 84<br />
Central Pattana PCL (Registered) 825,726 1,196<br />
Central Pattana PCL NVDR 661,598 961<br />
Land and Houses PCL (Registered) 2,094,184 627<br />
Land and Houses PCL NVDR 1,219,600 362<br />
LPN Development PCL (Registered) 8,475 4<br />
LPN Development PCL NVDR 622,701 308<br />
Property Perfect PCL (Registered) 2,765,102 77<br />
Property Perfect PCL NVDR 2,995,695 83<br />
Pruksa Real Estate PCL NVDR 731,700 459<br />
Quality Houses PCL NVDR 4,060,000 379<br />
Sansiri PCL NVDR 3,916,200 229<br />
SC Asset Corp. PCL (Registered) 664,875 66<br />
SC Asset Corp. PCL NVDR 763,488 75<br />
Siam Future Development PCL NVDR 921,912 158<br />
Supalai PCL (Registered) 224,356 123<br />
Supalai PCL NVDR 439,800 241<br />
TICON Industrial Connection PCL NVDR 494,837 263<br />
WHA Corp. PCL NVDR 264,200 255<br />
6,279<br />
Turkey - 0.2%<br />
Alarko Gayrimenkul Yatirim<br />
Ortakligi A.S. 5,636 51<br />
COMMON STOCKS - 98.4%<br />
Turkey - 0.2% continued<br />
NUMBER<br />
OF SHARES<br />
continued<br />
VALUE<br />
(000S)<br />
Emlak Konut Gayrimenkul Yatirim<br />
Ortakligi A.S. 2,138,022 $2,518<br />
Is Gayrimenkul Yatirim Ortakligi A.S. 311,856 189<br />
Sinpas Gayrimenkul Yatirim Ortakligi A.S. 258,537 88<br />
2,846<br />
United Arab Emirates - 0.9%<br />
Aldar Properties PJSC 3,468,372 3,278<br />
Emaar Properties PJSC 3,298,889 8,959<br />
RAK Properties PJSC 1,079,088 328<br />
12,565<br />
United Kingdom - 5.3%<br />
Big Yellow Group PLC 142,253 1,297<br />
British Land Co. PLC 1,103,058 12,041<br />
Capital & Counties Properties PLC 723,618 4,227<br />
Daejan Holdings PLC 5,401 440<br />
Derwent London PLC 101,107 4,573<br />
Development Securities PLC 135,497 530<br />
Grainger PLC 453,931 1,826<br />
Great Portland Estates PLC 379,933 3,997<br />
Hammerson PLC 781,759 7,228<br />
Hansteen Holdings PLC 706,739 1,288<br />
Helical Bar PLC 109,531 682<br />
Intu Properties PLC 747,691 3,520<br />
Land Securities Group PLC 868,994 14,809<br />
Londonmetric Property PLC 645,172 1,524<br />
Primary Health Properties PLC 117,956 679<br />
Quintain Estates & Development PLC* 505,232 868<br />
Redefine International PLC 871,871 803<br />
Safestore Holdings PLC 228,678 903<br />
Schroder Real Estate Investment Trust Ltd. 427,753 367<br />
Segro PLC 819,544 4,542<br />
Shaftesbury PLC 279,104 3,061<br />
St. Modwen Properties PLC 182,501 1,217<br />
Unite Group PLC 232,238 1,682<br />
Workspace Group PLC 115,447 1,140<br />
73,244<br />
United States - 43.5%<br />
Acadia Realty Trust 60,657 1,600<br />
Agree Realty Corp. 15,693 477<br />
Alexander’s, Inc. 2,257 815<br />
Alexandria Real Estate Equities, Inc. 78,883 5,724<br />
American Assets Trust, Inc. 38,416 1,296<br />
American Campus Communities, Inc. 115,532 4,315<br />
See Notes to the Financial Statements.<br />
NORTHERN FUNDS ANNUAL REPORT 41 EQUITY INDEX FUNDS
SCHEDULE OF INVESTMENTS<br />
GLOBAL REAL ESTATE INDEX FUND continued<br />
NUMBER<br />
OF SHARES<br />
continued<br />
VALUE<br />
(000S)<br />
COMMON STOCKS - 98.4%<br />
United States - 43.5% continued<br />
American Homes 4 Rent, Class A 147,000 $2,456<br />
American Realty Capital Properties, Inc. 830,621 11,645<br />
Apartment Investment & Management Co.,<br />
Class A 160,671 4,855<br />
Ashford Hospitality Trust, Inc. 70,351 793<br />
Associated Estates Realty Corp. 63,481 1,075<br />
AvalonBay Communities, Inc. 142,859 18,760<br />
BioMed Realty Trust, Inc. 212,182 4,348<br />
Boston Properties, Inc. 167,431 19,176<br />
Brandywine Realty Trust 173,247 2,505<br />
BRE Properties, Inc. 84,721 5,319<br />
Brixmor Property Group, Inc. 45,500 970<br />
Camden Property Trust 93,677 6,308<br />
Campus Crest Communities, Inc. 71,414 620<br />
CBL & Associates Properties, Inc. 187,723 3,332<br />
Cedar Realty Trust, Inc. 87,518 535<br />
Chambers Street Properties 261,300 2,030<br />
Chesapeake Lodging Trust 54,831 1,411<br />
CommonWealth REIT 130,652 3,436<br />
CommonWealth REIT -<br />
(Fractional Shares) (2) 75,000 —<br />
Corporate Office Properties Trust 90,773 2,418<br />
Cousins Properties, Inc. 195,145 2,238<br />
CubeSmart 153,672 2,637<br />
DCT Industrial Trust, Inc. 349,864 2,757<br />
DDR Corp. 337,176 5,557<br />
DiamondRock Hospitality Co. 215,542 2,533<br />
Digital Realty Trust, Inc. 141,855 7,530<br />
Douglas Emmett, Inc. 146,322 3,971<br />
Duke Realty Corp. 358,970 6,059<br />
DuPont Fabros Technology, Inc. 72,729 1,751<br />
EastGroup Properties, Inc. 34,097 2,145<br />
Education Realty Trust, Inc. 126,738 1,251<br />
Empire State Realty Trust, Inc., Class A 83,365 1,260<br />
EPR Properties 58,349 3,115<br />
<strong>Equity</strong> Lifestyle Properties, Inc. 83,002 3,374<br />
<strong>Equity</strong> One, Inc. 65,255 1,458<br />
<strong>Equity</strong> Residential 393,571 22,823<br />
Essex Property Trust, Inc. 42,618 7,247<br />
Excel Trust, Inc. 50,511 640<br />
Extra Space Storage, Inc. 120,255 5,834<br />
Federal Realty Investment Trust 73,759 8,462<br />
FelCor Lodging Trust, Inc. 138,104 1,248<br />
First Industrial Realty Trust, Inc. 121,492 2,347<br />
First Potomac Realty Trust 64,370 832<br />
NUMBER<br />
OF SHARES<br />
continued<br />
VALUE<br />
(000S)<br />
COMMON STOCKS - 98.4%<br />
United States - 43.5% continued<br />
Forest City Enterprises, Inc., Class A* 164,318 $3,138<br />
Franklin Street Properties Corp. 97,218 1,225<br />
General Growth Properties, Inc. 556,286 12,238<br />
Getty Realty Corp. 27,589 521<br />
Glimcher Realty Trust 160,281 1,608<br />
Government Properties Income Trust 60,143 1,516<br />
HCP, Inc. 500,133 19,400<br />
Health Care REIT, Inc. 320,234 19,086<br />
Healthcare Realty Trust, Inc. 105,802 2,555<br />
Healthcare Trust of America, Inc., Class A 261,500 2,978<br />
Hersha Hospitality Trust 190,069 1,108<br />
Highwoods Properties, Inc. 99,106 3,807<br />
Home Properties, Inc. 62,713 3,770<br />
Hospitality Properties Trust 165,199 4,745<br />
Host Hotels & Resorts, Inc. 822,363 16,645<br />
Hudson Pacific Properties, Inc. 60,637 1,399<br />
Inland Real Estate Corp. 94,339 995<br />
Investors Real Estate Trust 117,878 1,059<br />
Kilroy Realty Corp. 90,817 5,320<br />
Kimco Realty Corp. 448,138 9,805<br />
Kite Realty Group Trust 143,077 858<br />
LaSalle Hotel Properties 114,838 3,596<br />
Lexington Realty Trust 252,115 2,751<br />
Liberty Property Trust 161,236 5,959<br />
LTC Properties, Inc. 38,387 1,444<br />
Macerich (The) Co. 155,157 9,671<br />
Mack-Cali Realty Corp. 97,033 2,017<br />
Medical Properties Trust, Inc. 178,478 2,283<br />
Mid-America Apartment Communities, Inc. 82,220 5,613<br />
National Health Investors, Inc. 32,134 1,943<br />
National Retail Properties, Inc. 133,881 4,595<br />
Omega Healthcare Investors, Inc. 137,160 4,598<br />
Parkway Properties, Inc. 77,703 1,418<br />
Pebblebrook Hotel Trust 70,808 2,391<br />
Pennsylvania Real Estate Investment Trust 72,388 1,307<br />
Piedmont Office Realty Trust, Inc., Class A 170,253 2,920<br />
Post Properties, Inc. 59,769 2,935<br />
Prologis, Inc. 550,265 22,467<br />
PS Business Parks, Inc. 22,098 1,848<br />
Public Storage 157,800 26,588<br />
Ramco-Gershenson Properties Trust 72,479 1,181<br />
Realty Income Corp. 229,260 9,368<br />
Regency Centers Corp. 101,176 5,166<br />
Retail Opportunity Investments Corp. 79,503 1,188<br />
See Notes to the Financial Statements.<br />
EQUITY INDEX FUNDS 42 NORTHERN FUNDS ANNUAL REPORT
MARCH 31, 2014<br />
NUMBER<br />
OF SHARES<br />
continued<br />
VALUE<br />
(000S)<br />
COMMON STOCKS - 98.4%<br />
United States - 43.5% continued<br />
Retail Properties of America, Inc., Class A 207,200 $2,805<br />
RLJ Lodging Trust 135,463 3,622<br />
Rouse Properties, Inc. 39,918 688<br />
Sabra Health Care REIT, Inc. 41,900 1,169<br />
Saul Centers, Inc. 14,405 682<br />
Select Income REIT 30,600 926<br />
Senior Housing Properties Trust 207,793 4,669<br />
Silver Bay Realty Trust Corp. 40,570 630<br />
Simon Property Group, Inc. 347,005 56,909<br />
SL Green Realty Corp. 104,707 10,536<br />
Sovran Self Storage, Inc. 35,381 2,599<br />
Spirit Realty Capital, Inc. 392,520 4,310<br />
STAG Industrial, Inc. 48,800 1,176<br />
Strategic Hotels & Resorts, Inc.* 184,910 1,884<br />
Sun Communities, Inc. 42,749 1,928<br />
Sunstone Hotel Investors, Inc. 201,787 2,771<br />
Tanger Factory Outlet Centers, Inc. 103,605 3,626<br />
Taubman Centers, Inc. 70,356 4,980<br />
TravelCenters of America LLC -<br />
(Fractional Shares)* 50,000 —<br />
UDR, Inc. 276,253 7,136<br />
Universal Health Realty Income Trust 13,918 588<br />
Urstadt Biddle Properties, Inc., Class A 25,639 530<br />
Ventas, Inc. 324,931 19,681<br />
Vornado Realty Trust 185,037 18,237<br />
Washington Real Estate Investment Trust 72,820 1,739<br />
Weingarten Realty Investors 120,165 3,605<br />
Winthrop Realty Trust 35,752 414<br />
WP Carey, Inc. 93,002 5,587<br />
603,738<br />
Total Common Stocks (3)<br />
(Cost $1,140,641) 1,365,977<br />
PRINCIPAL<br />
AMOUNT<br />
(000S)<br />
VALUE<br />
(000S)<br />
CONVERTIBLE BONDS - 0.0%<br />
YTL Land & Development Bhd.,<br />
3.00%, 10/31/21 $114 $15<br />
Total Convertible Bonds (3)<br />
(Cost $18) 15<br />
(1)<br />
(2)<br />
(3)<br />
(4)<br />
(5)<br />
*<br />
NUMBER<br />
OF SHARES<br />
VALUE<br />
(000S)<br />
RIGHTS - 0.0%<br />
Hong Kong - 0.0%<br />
New World Development Co. Ltd.* 1,383,292 $286<br />
United Kingdom - 0.0%<br />
Intu Properties PLC* 213,626 338<br />
Total Rights (3)<br />
(Cost $698) 624<br />
INVESTMENT COMPANIES - 0.6%<br />
CPN Retail Growth Leasehold<br />
Property Fund 1,341,400 $637<br />
F&C Commercial Property Trust Ltd. 542,726 1,088<br />
F&C UK Real Estate Investment Ltd. 232,577 314<br />
Medicx Fund Ltd. 379,346 534<br />
<strong>Northern</strong> Institutional <strong>Funds</strong> -<br />
Diversified Assets Portfolio, 0.01% (4) (5) 4,229,668 4,230<br />
Picton Property Income Ltd. 419,204 397<br />
Standard Life Investment Property Income<br />
Trust PLC 162,987 203<br />
UK Commercial Property Trust Ltd. 440,748 593<br />
Total Investment Companies (3)<br />
(Cost $7,636) 7,996<br />
Total Investments - 99.0%<br />
(Cost $1,148,993) 1,374,612<br />
Other Assets less Liabilities - 1.0% 13,674<br />
NET ASSETS - 100.0% $1,388,286<br />
Value rounds to less than one thousand.<br />
Level 3 asset that is worthless, bankrupt or has been delisted.<br />
In accordance with the Fund’s prospectus, adjustment factors were provided<br />
by an independent evaluation service to determine the value of certain<br />
foreign securities.<br />
At March 31, 2013, the value of the Fund’s investment in the Diversified Assets<br />
Portfolio of the <strong>Northern</strong> Institutional <strong>Funds</strong> was approximately $19,343,000<br />
with net sales of approximately $15,113,000 during the fiscal year ended<br />
March 31, 2014.<br />
Investment in affiliated Portfolio. <strong>Northern</strong> Trust Investments, Inc. is the<br />
investment adviser to the Fund and the investment adviser to the <strong>Northern</strong><br />
Institutional <strong>Funds</strong>.<br />
Non-Income Producing Security<br />
Percentages shown are based on Net Assets. The classifications shown on the<br />
Schedule of Investments and in the tables herein are unaudited.<br />
See Notes to the Financial Statements.<br />
NORTHERN FUNDS ANNUAL REPORT 43 EQUITY INDEX FUNDS
SCHEDULE OF INVESTMENTS<br />
GLOBAL REAL ESTATE INDEX FUND continued<br />
At March 31, 2014, the Fund had open futures contracts as follows:<br />
TYPE<br />
NUMBER OF<br />
CONTRACTS<br />
NOTIONAL<br />
AMOUNT<br />
(000S)<br />
CONTRACT<br />
POSITION<br />
CONTRACT<br />
EXP.<br />
UNREALIZED<br />
GAINS (LOSSES)<br />
(000S)<br />
E-Mini S&P<br />
Midcap 400<br />
(U.S. Dollar) 70 $9,624 Long 6/14 $94<br />
Euro Stoxx<br />
50 (Euro) 28 1,196 Long 6/14 58<br />
Hang Seng<br />
<strong>Index</strong><br />
(Hong Kong<br />
Dollar) 15 2,141 Long 4/14 46<br />
SPI 200<br />
<strong>Index</strong><br />
(Australian<br />
Dollar) 19 2,376 Long 6/14 25<br />
TOPIX <strong>Index</strong><br />
(Japanese<br />
Yen) 5 583 Long 6/14 17<br />
Yen<br />
Denominated<br />
Nikkei 225<br />
(Japanese<br />
Yen) 32 2,297 Long 6/14 (19)<br />
Total $221<br />
At March 31, 2014, the Fund’s investments were denominated in the following<br />
currencies (unaudited):<br />
% OF LONG-TERM<br />
CONCENTRATION BY CURRENCY<br />
INVESTMENTS<br />
United States Dollar 44.9%<br />
Japanese Yen 11.4<br />
Honk Kong Dollar 9.6<br />
Euro 6.8<br />
Australian Dollar 5.9<br />
British Pound 5.4<br />
All other currencies less than 5% 16.0<br />
Total 100.0%<br />
At March 31, 2014, the industry sectors (unaudited) for the Fund were:<br />
% OF LONG-TERM<br />
INDUSTRY SECTOR<br />
INVESTMENTS<br />
Diversified Real Estate Activity 13.0%<br />
Diversified REITs 14.8<br />
Health Care REITs 6.1<br />
Office REITs 9.9<br />
Real Estate Development 6.3<br />
Real Estate Operating Companies 8.5<br />
Residential REITs 8.3<br />
Retail REITs 21.2<br />
Other Industries less than 5% 11.9<br />
Total 100.0%<br />
At March 31, 2014, the Fund had outstanding forward foreign currency<br />
exchange contracts as follows:<br />
CONTRACTS<br />
TO<br />
DELIVER<br />
CURRENCY<br />
AMOUNT<br />
(LOCAL<br />
CURRENCY)<br />
(000S)<br />
IN<br />
EXCHANGE<br />
FOR<br />
CURRENCY<br />
AMOUNT<br />
(LOCAL<br />
UNREALIZED<br />
GAINS<br />
(LOSSES)<br />
(000S)<br />
CURRENCY) SETTLEMENT<br />
COUNTERPARTY<br />
(000S) DATE<br />
United States<br />
Morgan Stanley Australian Dollar 2,546 Dollar 2,301 6/18/14 $(47)<br />
United States<br />
Goldman Sachs British Pound 241 Dollar 400 6/18/14 (1)<br />
United States<br />
Citibank Canadian Dollar 17 Dollar 15 6/18/14 —*<br />
United States<br />
UBS Japanese Yen 304,475 Dollar 3,000 6/18/14 49<br />
Australian<br />
UBS United States Dollar 2,000 Dollar 2,204 6/18/14 33<br />
Citibank United States Dollar 629 British Pound 378 6/18/14 1<br />
Goldman Sachs United States Dollar 638 Euro 458 6/18/14 (7)<br />
Hong Kong<br />
Citibank United States Dollar 899 Dollar 6,977 6/18/14 1<br />
Citibank United States Dollar 5 Japanese Yen 543 6/18/14 —*<br />
Citibank United States Dollar 3,200 Japanese Yen 326,675 6/18/14 (34)<br />
Singapore<br />
Citibank United States Dollar 388 Dollar 491 6/18/14 2<br />
Citibank United States Dollar 10 Swedish Krona 66 6/18/14 —*<br />
Morgan Stanley United States Dollar 1 Swiss Franc 1 6/18/14 —*<br />
Total $(3)<br />
*<br />
Amount rounds to less than one thousand.<br />
See Notes to the Financial Statements.<br />
EQUITY INDEX FUNDS 44 NORTHERN FUNDS ANNUAL REPORT
MARCH 31, 2014<br />
Various inputs are used in determining the value of the Fund’s investments. These<br />
inputs are summarized in three levels listed below:<br />
Level 1 - Unadjusted quoted market prices in active markets for identical securities<br />
on the measurement date.<br />
Level 2 - Other observable inputs (e.g., quoted prices in active markets for similar<br />
securities, securities valuations based on commonly quoted benchmark interest<br />
rates and yield curves, maturities, ratings and/or securities indices). The Fund<br />
adjusted the price of certain foreign equity securities held in its portfolio<br />
on March 31, 2014 using adjustment factors designed to reflect more accurately<br />
the fair value of the securities. See Note 2 for a discussion of this procedure. The<br />
fair valuation of these securities resulted in their categorization as Level 2<br />
investments.<br />
Level 3 - Significant unobservable inputs (e.g., information about assumptions,<br />
including risk, market participants would use in pricing a security).<br />
The inputs or methodologies used for valuing securities are not necessarily an<br />
indication of the risk associated with investing in those securities and other<br />
financial instruments, if any. The following table summarizes the valuation of the<br />
Fund’s investments by the above fair value hierarchy as of March 31, 2014:<br />
LEVEL 1<br />
(000S)<br />
LEVEL 2<br />
(000S)<br />
LEVEL 3<br />
(000S)<br />
TOTAL<br />
(000S)<br />
INVESTMENTS<br />
Common Stocks<br />
Brazil $ 17,743 $ — $ — $ 17,743<br />
Canada 44,917 — — 44,917<br />
Chile 1,109 — — 1,109<br />
Mexico 7,459 — 1 7,460<br />
Russia 719 — — 719<br />
United States 603,738 — — 603,738<br />
All other Countries — 690,291 (1) — 690,291<br />
Convertible Bonds — 15 — 15<br />
Rights<br />
Hong Kong — 286 — 286<br />
United Kingdom — 338 — 338<br />
Investment Companies 4,230 3,766 — 7,996<br />
Total Investments $679,915 $694,696 $ 1 $1,374,612<br />
The Fund discloses all transfers between levels based on valuations at the end of<br />
each reporting period.<br />
At March 31, 2014, the Fund had transfers from Level 1 to Level 2 as<br />
disclosed below:<br />
Transfers from Level 1 to Level 2<br />
Country<br />
Value<br />
(000S)<br />
Reason<br />
Common Stocks<br />
China<br />
$3,641 Valuations at last trade with foreign value adjustments<br />
Japan<br />
146,723 Valuations at last trade with foreign value adjustments<br />
Malaysia 5,101 Valuations at last trade with foreign value adjustments<br />
Taiwan 204 Valuations at last trade with foreign value adjustments<br />
Thailand 4,698 Valuations at last trade with foreign value adjustments<br />
Turkey 2,846 Valuations at last trade with foreign value adjustments<br />
Investment Companies<br />
Thailand 637 Valuations at last trade with foreign value adjustments<br />
Total $ 163,850<br />
OTHER FINANCIAL<br />
INSTRUMENTS<br />
Assets<br />
Futures Contracts $ 240 $ — $ — $ 240<br />
Forward Foreign<br />
Currency Exchange<br />
Contracts — 86 — 86<br />
Liabilities<br />
Futures Contracts (19) — — (19)<br />
Forward Foreign<br />
Currency Exchange<br />
Contracts — (89) — (89)<br />
Total Other Financial<br />
Instruments $ 221 $ (3) $ — $ 218<br />
(1)<br />
Classifications as defined in the Schedule of Investments.<br />
See Notes to the Financial Statements.<br />
NORTHERN FUNDS ANNUAL REPORT 45 EQUITY INDEX FUNDS
SCHEDULE OF INVESTMENTS<br />
GLOBAL REAL ESTATE INDEX FUND continued MARCH 31, 2014<br />
The following is a reconciliation of investments in which significant unobservable inputs (Level 3) were used in determining fair value:<br />
BALANCE<br />
AS OF<br />
3/31/13<br />
(000S)<br />
ACCRUED<br />
DISCOUNTS<br />
(PREMIUMS)<br />
(000S)<br />
REALIZED<br />
GAINS<br />
(LOSSES)<br />
(000S)<br />
CHANGE IN<br />
UNREALIZED<br />
APPRECIATION<br />
(DEPRECIATION)<br />
(000S)<br />
PURCHASES<br />
(000S)<br />
SALES<br />
(000S)<br />
TRANSFERS<br />
INTO<br />
LEVEL 3<br />
(000S)<br />
TRANSFERS<br />
OUT OF<br />
LEVEL 3<br />
(000S)<br />
BALANCE<br />
AS OF<br />
3/31/14<br />
(000S)<br />
CHANGE IN UNREALIZED<br />
APPRECIATION<br />
(DEPRECIATION) FROM<br />
INVESTMENTS STILL HELD<br />
AT 3/31/14<br />
(000S)<br />
Common<br />
Stocks<br />
Mexico $— $ — $ — $ — $— $ — $1 $ — $1 $(498)<br />
The Fund valued the securities included in the balance as of 3/31/14 above using prices provided by the Asset Management PVC.<br />
FAIR VALUE AT<br />
3/31/14<br />
(000S)<br />
VALUATION<br />
TECHNIQUES<br />
UNOBSERVABLE<br />
INPUTS<br />
Common Stock $1 Consensus Pricing Distressed/Defaulted Market Discount, Estimated Recovery Value<br />
The unobservable inputs are reviewed and compared to publicly available<br />
information for reasonableness. Values are reviewed based on available<br />
restructuring and recovery information. Values are compared to historical<br />
averages and general sector trends are taken into account. In general, an<br />
increase (decrease) in recovery or reduction (increase) in dilution would, in<br />
isolation, result in a significantly higher (lower) fair value measurement.<br />
See Notes to the Financial Statements.<br />
EQUITY INDEX FUNDS 46 NORTHERN FUNDS ANNUAL REPORT
SCHEDULE OF INVESTMENTS<br />
GLOBAL SUSTAINABILITY INDEX FUND MARCH 31, 2014<br />
NUMBER<br />
OF SHARES<br />
VALUE<br />
(000S)<br />
COMMON STOCKS - 96.9%<br />
Australia - 4.1%<br />
AGL Energy Ltd. 6,029 $85<br />
Amcor Ltd. 13,032 126<br />
AMP Ltd. 33,584 155<br />
APA Group 9,169 55<br />
Asciano Ltd. 10,806 52<br />
Australia & New Zealand Banking<br />
Group Ltd. 30,696 943<br />
Bendigo and Adelaide Bank Ltd. 4,880 52<br />
Boral Ltd. 8,582 45<br />
Brambles Ltd. 17,607 151<br />
Caltex Australia Ltd. 1,329 27<br />
CFS Retail Property Trust Group 21,038 37<br />
Coca-Cola Amatil Ltd. 6,315 65<br />
Commonwealth Bank of Australia 18,019 1,297<br />
Dexus Property Group 58,668 58<br />
Fortescue Metals Group Ltd. 16,459 81<br />
Goodman Group 18,638 82<br />
GPT Group 19,686 67<br />
Insurance Australia Group Ltd. 26,168 135<br />
Lend Lease Group 6,036 66<br />
Metcash Ltd. 10,365 25<br />
Mirvac Group 39,086 62<br />
National Australia Bank Ltd. 26,287 866<br />
Newcrest Mining Ltd.* 8,137 75<br />
Orica Ltd. 3,946 80<br />
Origin Energy Ltd. 12,357 164<br />
QBE Insurance Group Ltd. 13,729 163<br />
Ramsay Health Care Ltd. 1,447 65<br />
Sonic Healthcare Ltd. 4,193 67<br />
SP AusNet 19,898 24<br />
Stockland 25,065 87<br />
Sydney Airport 11,660 45<br />
Toll Holdings Ltd. 7,715 37<br />
Transurban Group 15,378 104<br />
Wesfarmers Ltd. 12,824 490<br />
Westpac Banking Corp. 34,768 1,115<br />
Woodside Petroleum Ltd. 7,313 265<br />
WorleyParsons Ltd. 2,032 29<br />
7,342<br />
Austria - 0.0%<br />
OMV A.G. 1,612 73<br />
Belgium - 0.2%<br />
Colruyt S.A. 837 46<br />
Delhaize Group S.A. 1,120 82<br />
NUMBER<br />
OF SHARES<br />
continued<br />
VALUE<br />
(000S)<br />
COMMON STOCKS - 96.9%<br />
Belgium - 0.2% continued<br />
KBC Groep N.V. 2,833 $175<br />
Umicore S.A. 1,245 63<br />
366<br />
Canada - 4.5%<br />
Agnico Eagle Mines Ltd. 2,074 63<br />
Agrium, Inc. 1,590 155<br />
AltaGas Ltd. 1,300 53<br />
ARC Resources Ltd. 3,335 92<br />
Atco Ltd., Class I 800 38<br />
Bank of Nova Scotia 13,543 784<br />
Canadian National Railway Co. 9,396 528<br />
Canadian Tire Corp. Ltd., Class A 829 78<br />
Canadian Utilities Ltd., Class A 1,392 52<br />
Cenovus Energy, Inc. 8,532 247<br />
CGI Group, Inc., Class A* 2,200 68<br />
Crescent Point Energy Corp. 4,466 163<br />
Empire Co. Ltd., Class A 600 37<br />
Enbridge, Inc. 8,836 401<br />
Encana Corp. 8,429 180<br />
Enerplus Corp. 2,206 44<br />
Gildan Activewear, Inc. 1,213 61<br />
Keyera Corp. 800 51<br />
Kinross Gold Corp. 12,443 51<br />
Loblaw Cos. Ltd. 1,172 50<br />
Magna International, Inc. 2,500 240<br />
MEG Energy Corp.* 1,600 54<br />
Metro, Inc. 974 57<br />
Open Text Corp. 1,400 67<br />
Pengrowth Energy Corp. 5,302 32<br />
Penn West Petroleum Ltd. 5,451 46<br />
Potash Corp. of Saskatchewan, Inc. 9,695 351<br />
Rogers Communications, Inc., Class B 4,105 170<br />
Royal Bank of Canada 16,107 1,062<br />
Shaw Communications, Inc., Class B 4,400 105<br />
Shoppers Drug Mart Corp. 2,300 127<br />
Silver Wheaton Corp. 3,800 86<br />
Suncor Energy, Inc. 16,647 581<br />
Teck Resources Ltd., Class B 6,144 133<br />
TELUS Corp. 2,100 75<br />
TELUS Corp. 300 11<br />
Tim Hortons, Inc. 1,600 88<br />
Toronto-Dominion Bank (The) 20,590 965<br />
TransAlta Corp. 2,643 31<br />
See Notes to the Financial Statements.<br />
NORTHERN FUNDS ANNUAL REPORT 47 EQUITY INDEX FUNDS
SCHEDULE OF INVESTMENTS<br />
GLOBAL SUSTAINABILITY INDEX FUND continued<br />
COMMON STOCKS - 96.9%<br />
Canada - 4.5% continued<br />
NUMBER<br />
OF SHARES<br />
continued<br />
VALUE<br />
(000S)<br />
Valeant Pharmaceuticals<br />
International, Inc.* 3,600 $474<br />
7,951<br />
Denmark - 0.7%<br />
Novo Nordisk A/S, Class B 22,273 1,016<br />
Novozymes A/S, Class B 2,570 113<br />
Tryg A/S 267 27<br />
1,156<br />
Finland - 0.1%<br />
Metso OYJ 1,394 46<br />
Neste Oil OYJ 1,226 25<br />
Orion OYJ, Class B 959 29<br />
Stora Enso OYJ (Registered) 5,704 61<br />
UPM-Kymmene OYJ 6,068 104<br />
265<br />
France - 3.3%<br />
Accor S.A. 1,826 94<br />
Aeroports de Paris 296 37<br />
Air Liquide S.A. 3,500 475<br />
AtoS 740 67<br />
AXA S.A. 20,128 524<br />
Bouygues S.A. 2,090 87<br />
Bureau Veritas S.A. 2,379 73<br />
Cap Gemini S.A. 1,634 124<br />
Carrefour S.A. 6,740 261<br />
Casino Guichard Perrachon S.A. 609 72<br />
CGG S.A.* 1,845 30<br />
Christian Dior S.A. 586 113<br />
Cie de St-Gobain 4,687 284<br />
CNP Assurances 1,914 40<br />
Danone S.A. 6,375 451<br />
Eurazeo S.A. 312 28<br />
Gecina S.A. 255 34<br />
ICADE 371 37<br />
Imerys S.A. 353 31<br />
JCDecaux S.A. 772 34<br />
Kering 857 175<br />
Lafarge S.A. 2,089 164<br />
Lagardere S.C.A. 1,248 50<br />
Legrand S.A. 2,959 184<br />
L’Oreal S.A. 2,714 448<br />
Natixis 9,964 73<br />
Renault S.A. 2,129 207<br />
NUMBER<br />
OF SHARES<br />
continued<br />
VALUE<br />
(000S)<br />
COMMON STOCKS - 96.9%<br />
France - 3.3% continued<br />
Rexel S.A. 2,578 $68<br />
Schneider Electric S.A. 5,978 531<br />
Schneider Electric S.A.<br />
(LSE European Quoting Service) 178 16<br />
SES S.A. 3,460 129<br />
Societe BIC S.A. 324 42<br />
Suez Environnement Co. 2,995 61<br />
Technip S.A. 1,161 120<br />
Unibail-Rodamco S.E. 1,096 285<br />
Vallourec S.A. 1,180 64<br />
Vinci S.A. 5,404 403<br />
5,916<br />
Germany - 3.3%<br />
Adidas A.G. 2,295 249<br />
Allianz S.E. (Registered) 5,108 863<br />
BASF S.E. 10,271 1,141<br />
Bayerische Motoren Werke A.G. 3,716 469<br />
Beiersdorf A.G. 1,086 106<br />
Deutsche Boerse A.G. 2,157 172<br />
Deutsche Lufthansa A.G. (Registered)* 2,542 67<br />
Deutsche Post A.G. (Registered) 10,193 379<br />
Fraport A.G. Frankfurt Airport<br />
Services Worldwide 422 32<br />
GEA Group A.G. 1,950 89<br />
HeidelbergCement A.G. 1,600 137<br />
Henkel A.G. & Co. KGaA 1,458 146<br />
Hochtief A.G. 336 30<br />
K+S A.G. (Registered) 2,005 66<br />
Linde A.G. 2,085 417<br />
Merck KGaA 730 123<br />
Metro A.G. 1,339 55<br />
Muenchener Rueckversicherungs<br />
A.G. (Registered) 2,013 440<br />
ProSiebenSat.1 Media A.G. (Registered) 2,500 115<br />
SAP A.G. 10,310 834<br />
Suedzucker A.G. 801 23<br />
5,953<br />
Hong Kong - 0.5%<br />
Cathay Pacific Airways Ltd. 13,000 24<br />
CLP Holdings Ltd. 20,099 152<br />
Hang Seng Bank Ltd. 8,678 138<br />
Hong Kong & China Gas Co. Ltd. 65,547 143<br />
Hong Kong Exchanges and Clearing Ltd. 12,368 188<br />
Li & Fung Ltd. 66,000 98<br />
See Notes to the Financial Statements.<br />
EQUITY INDEX FUNDS 48 NORTHERN FUNDS ANNUAL REPORT
MARCH 31, 2014<br />
NUMBER<br />
OF SHARES<br />
continued<br />
VALUE<br />
(000S)<br />
COMMON STOCKS - 96.9%<br />
Hong Kong - 0.5% continued<br />
MTR Corp. Ltd. 14,791 $55<br />
Yue Yuen Industrial Holdings Ltd. 7,500 25<br />
823<br />
Ireland - 0.2%<br />
CRH PLC 8,274 231<br />
Kerry Group PLC, Class A 1,675 128<br />
359<br />
Israel - 0.0%<br />
Delek Group Ltd. 44 18<br />
Italy - 0.7%<br />
Assicurazioni Generali S.p.A. 13,152 294<br />
Atlantia S.p.A. 4,251 109<br />
Enel Green Power S.p.A. 19,140 54<br />
Exor S.p.A. 1,087 49<br />
Intesa Sanpaolo S.p.A. 130,582 443<br />
Pirelli & C. S.p.A. 2,656 42<br />
Snam S.p.A. 22,898 134<br />
Tenaris S.A. 5,389 119<br />
1,244<br />
Japan - 8.8%<br />
Aeon Co. Ltd. 6,600 74<br />
AEON Financial Service Co. Ltd. 1,190 27<br />
Aeon Mall Co. Ltd. 1,180 30<br />
Air Water, Inc. 2,000 28<br />
Aisin Seiki Co. Ltd. 2,100 76<br />
Ajinomoto Co., Inc. 7,000 100<br />
Alfresa Holdings Corp. 400 26<br />
Amada Co. Ltd. 4,000 28<br />
ANA Holdings, Inc. 11,000 24<br />
Asahi Glass Co. Ltd. 11,000 64<br />
Asahi Kasei Corp. 14,000 95<br />
Asics Corp. 1,800 35<br />
Astellas Pharma, Inc. 24,000 284<br />
Benesse Holdings, Inc. 700 27<br />
Canon, Inc. 12,700 393<br />
Casio Computer Co. Ltd. 2,300 27<br />
Central Japan Railway Co. 1,600 187<br />
Chiyoda Corp. 2,000 26<br />
Chugai Pharmaceutical Co. Ltd. 2,410 61<br />
Citizen Holdings Co. Ltd. 2,600 20<br />
Dai Nippon Printing Co. Ltd. 6,000 57<br />
Daicel Corp. 3,000 25<br />
Daido Steel Co. Ltd. 3,000 15<br />
NUMBER<br />
OF SHARES<br />
continued<br />
VALUE<br />
(000S)<br />
COMMON STOCKS - 96.9%<br />
Japan - 8.8% continued<br />
Daikin Industries Ltd. 2,700 $151<br />
Dainippon Sumitomo Pharma Co. Ltd. 1,535 24<br />
Daiwa House Industry Co. Ltd. 7,000 119<br />
Denso Corp. 5,500 263<br />
Dentsu, Inc. 2,300 87<br />
East Japan Railway Co. 3,800 280<br />
Eisai Co. Ltd. 2,705 105<br />
FamilyMart Co. Ltd. 600 26<br />
Fast Retailing Co. Ltd. 600 217<br />
Fuji Heavy Industries Ltd. 6,608 178<br />
FUJIFILM Holdings Corp. 5,000 134<br />
Fujitsu Ltd.* 20,000 121<br />
Hino Motors Ltd. 2,600 39<br />
Hitachi Chemical Co. Ltd. 1,017 14<br />
Hitachi Construction Machinery Co. Ltd. 1,000 19<br />
Hitachi High-Technologies Corp. 543 13<br />
Hitachi Metals Ltd. 2,000 28<br />
Honda Motor Co. Ltd. 18,300 643<br />
Ibiden Co. Ltd. 1,200 24<br />
Inpex Corp. 10,000 130<br />
Isetan Mitsukoshi Holdings Ltd. 3,800 47<br />
Japan Steel Works (The) Ltd. 3,000 13<br />
JFE Holdings, Inc. 5,600 105<br />
JSR Corp. 1,800 33<br />
JTEKT Corp. 2,200 33<br />
Kajima Corp. 10,000 35<br />
Kaneka Corp. 3,000 18<br />
Kansai Paint Co. Ltd. 3,000 43<br />
Kao Corp. 5,700 202<br />
Kawasaki Heavy Industries Ltd. 15,000 55<br />
KDDI Corp. 6,100 355<br />
Keio Corp. 6,000 42<br />
Keyence Corp. 500 206<br />
Kikkoman Corp. 2,000 38<br />
Kobe Steel Ltd. 33,551 45<br />
Komatsu Ltd. 10,500 217<br />
Konica Minolta, Inc. 5,000 47<br />
Kubota Corp. 12,000 160<br />
Kuraray Co. Ltd. 3,800 43<br />
Kurita Water Industries Ltd. 1,100 24<br />
Kyocera Corp. 3,600 162<br />
Kyowa Hakko Kirin Co. Ltd. 3,000 32<br />
Lawson, Inc. 700 49<br />
Makita Corp. 1,200 66<br />
See Notes to the Financial Statements.<br />
NORTHERN FUNDS ANNUAL REPORT 49 EQUITY INDEX FUNDS
SCHEDULE OF INVESTMENTS<br />
GLOBAL SUSTAINABILITY INDEX FUND continued<br />
NUMBER<br />
OF SHARES<br />
continued<br />
VALUE<br />
(000S)<br />
COMMON STOCKS - 96.9%<br />
Japan - 8.8% continued<br />
Marubeni Corp. 18,123 $122<br />
Marui Group Co. Ltd. 2,200 19<br />
Mazda Motor Corp. 29,000 128<br />
McDonald’s Holdings Co. Japan Ltd. 700 19<br />
Miraca Holdings, Inc. 600 26<br />
Mitsubishi Corp. 15,400 286<br />
Mitsubishi Electric Corp. 22,000 247<br />
Mitsubishi Motors Corp. 6,591 69<br />
Mitsubishi UFJ Lease & Finance Co. Ltd. 5,830 29<br />
Mitsui Chemicals, Inc. 8,000 20<br />
Mitsui Fudosan Co. Ltd. 9,000 274<br />
Mitsui OSK Lines Ltd. 11,000 43<br />
Mizuho Financial Group, Inc. 257,873 509<br />
Murata Manufacturing Co. Ltd. 2,215 208<br />
Nabtesco Corp. 1,200 28<br />
NGK Insulators Ltd. 3,000 62<br />
NGK Spark Plug Co. Ltd. 2,000 45<br />
Nikon Corp. 3,600 58<br />
Nippon Meat Packers, Inc. 2,000 30<br />
Nippon Steel & Sumitomo Metal Corp. 84,520 230<br />
Nippon Telegraph & Telephone Corp. 4,200 228<br />
Nippon Yusen K.K. 18,000 53<br />
Nissan Motor Co. Ltd. 27,400 244<br />
Nisshin Seifun Group, Inc. 2,200 24<br />
Nissin Foods Holdings Co. Ltd. 600 27<br />
Nitto Denko Corp. 1,900 92<br />
NKSJ Holdings, Inc. 3,800 97<br />
Nomura Research Institute Ltd. 1,066 34<br />
NSK Ltd. 5,000 51<br />
NTT Data Corp. 1,400 54<br />
NTT DOCOMO, Inc. 17,200 271<br />
Omron Corp. 2,200 91<br />
Osaka Gas Co. Ltd. 20,000 76<br />
Panasonic Corp. 24,400 278<br />
Resona Holdings, Inc. 25,200 122<br />
Rinnai Corp. 400 35<br />
Santen Pharmaceutical Co. Ltd. 800 35<br />
Secom Co. Ltd. 2,400 138<br />
Sekisui Chemical Co. Ltd. 5,000 52<br />
Sekisui House Ltd. 6,300 78<br />
Seven & I Holdings Co. Ltd. 8,500 324<br />
Sharp Corp.* 17,000 52<br />
Shimadzu Corp. 3,000 27<br />
Shimizu Corp. 6,000 31<br />
NUMBER<br />
OF SHARES<br />
continued<br />
VALUE<br />
(000S)<br />
COMMON STOCKS - 96.9%<br />
Japan - 8.8% continued<br />
Shin-Etsu Chemical Co. Ltd. 4,600 $263<br />
Showa Shell Sekiyu K.K. 1,900 17<br />
SoftBank Corp. 10,700 807<br />
Sony Corp. 11,600 221<br />
Stanley Electric Co. Ltd. 1,633 36<br />
Sumitomo Chemical Co. Ltd. 16,000 59<br />
Sumitomo Electric Industries Ltd. 8,600 128<br />
Sumitomo Heavy Industries Ltd. 6,000 24<br />
Sumitomo Metal Mining Co. Ltd. 6,000 75<br />
Sumitomo Mitsui Financial Group, Inc. 14,300 610<br />
Sumitomo Rubber Industries Ltd. 1,700 22<br />
Suruga Bank Ltd. 2,170 38<br />
Suzuken Co. Ltd. 853 33<br />
Suzuki Motor Corp. 4,171 109<br />
Sysmex Corp. 1,542 49<br />
T&D Holdings, Inc. 6,400 76<br />
Taiyo Nippon Sanso Corp. 3,000 24<br />
Takashimaya Co. Ltd. 3,000 28<br />
Takeda Pharmaceutical Co. Ltd. 8,900 421<br />
TDK Corp. 1,300 54<br />
Teijin Ltd. 9,000 22<br />
Toho Co. Ltd. 1,100 22<br />
Toho Gas Co. Ltd. 4,000 22<br />
Tokyo Electron Ltd. 2,000 123<br />
Tokyo Gas Co. Ltd. 27,000 137<br />
Tokyu Corp. 12,000 74<br />
Toppan Printing Co. Ltd. 6,000 43<br />
Toray Industries, Inc. 16,000 106<br />
TOTO Ltd. 3,000 42<br />
Toyo Seikan Group Holdings Ltd. 1,600 26<br />
Toyo Suisan Kaisha Ltd. 1,000 33<br />
Toyoda Gosei Co. Ltd. 700 13<br />
Toyota Boshoku Corp. 500 5<br />
Toyota Industries Corp. 1,900 91<br />
Toyota Tsusho Corp. 2,300 58<br />
Tsumura & Co. 600 14<br />
USS Co. Ltd. 2,500 35<br />
Yakult Honsha Co. Ltd. 900 45<br />
Yamada Denki Co. Ltd. 10,460 35<br />
Yamaha Corp. 1,500 19<br />
Yamaha Motor Co. Ltd. 3,100 49<br />
Yaskawa Electric Corp. 3,000 41<br />
Yokogawa Electric Corp. 2,100 34<br />
15,563<br />
See Notes to the Financial Statements.<br />
EQUITY INDEX FUNDS 50 NORTHERN FUNDS ANNUAL REPORT
MARCH 31, 2014<br />
NUMBER<br />
OF SHARES<br />
continued<br />
VALUE<br />
(000S)<br />
COMMON STOCKS - 96.9%<br />
Netherlands - 2.1%<br />
Aegon N.V. 20,511 $189<br />
Akzo Nobel N.V. 2,658 218<br />
ASML Holding N.V. 4,018 372<br />
CNH Industrial N.V.* 10,777 124<br />
Core Laboratories N.V. 500 99<br />
Delta Lloyd N.V. 2,034 56<br />
FugroN.V.-CVA 764 47<br />
ING Groep N.V. - CVA* 43,023 612<br />
Koninklijke Ahold N.V. 10,506 211<br />
Koninklijke DSM N.V. 1,760 121<br />
Koninklijke KPN N.V.* 36,449 129<br />
Koninklijke Philips N.V. 10,543 371<br />
Koninklijke Vopak N.V. 776 43<br />
Randstad Holding N.V. 1,306 77<br />
Reed Elsevier N.V. 7,871 170<br />
Unilever N.V. - CVA 18,237 750<br />
Wolters Kluwer N.V. 3,275 93<br />
3,682<br />
New Zealand - 0.1%<br />
Auckland International Airport Ltd. 10,502 34<br />
Contact Energy Ltd. 3,201 15<br />
Fletcher Building Ltd. 7,599 63<br />
112<br />
Norway - 0.4%<br />
Aker Solutions ASA 1,622 25<br />
DNB ASA 10,781 188<br />
Norsk Hydro ASA 14,855 74<br />
Orkla ASA 8,940 76<br />
Statoil ASA 12,283 347<br />
710<br />
Portugal - 0.1%<br />
Banco Espirito Santo S.A. (Registered)* 20,739 39<br />
EDP - Energias de Portugal S.A. 21,481 100<br />
Galp Energia SGPS S.A. 3,854 66<br />
Jeronimo Martins SGPS S.A. 2,778 47<br />
252<br />
Singapore - 0.2%<br />
Ascendas Real Estate Investment Trust 20,000 36<br />
CapitaLand Ltd. 27,000 62<br />
CapitaMall Trust 27,000 40<br />
CapitaMalls Asia Ltd. 14,000 20<br />
City Developments Ltd. 4,000 32<br />
Jardine Cycle & Carriage Ltd. 1,000 36<br />
NUMBER<br />
OF SHARES<br />
continued<br />
VALUE<br />
(000S)<br />
COMMON STOCKS - 96.9%<br />
Singapore - 0.2% continued<br />
Keppel Land Ltd. 7,000 $19<br />
Singapore Airlines Ltd. 6,000 50<br />
Singapore Press Holdings Ltd. 17,000 57<br />
352<br />
Spain - 1.4%<br />
Abertis Infraestructuras S.A. 4,413 101<br />
Amadeus IT Holding S.A., Class A 4,312 179<br />
Banco Bilbao Vizcaya Argentaria S.A. 64,751 779<br />
CaixaBank S.A. 19,841 128<br />
Distribuidora Internacional de<br />
Alimentacion S.A. 6,015 55<br />
Enagas S.A. 2,217 67<br />
Ferrovial S.A. 4,332 94<br />
Iberdrola S.A. 54,065 379<br />
Inditex S.A. 2,404 361<br />
Red Electrica Corp. S.A. 1,179 96<br />
Repsol S.A. 9,622 246<br />
2,485<br />
Sweden - 2.0%<br />
Alfa Laval AB 3,427 93<br />
Assa Abloy AB, Class B 3,776 202<br />
Atlas Copco AB, Class A 7,476 216<br />
Atlas Copco AB, Class B 4,456 122<br />
Autoliv, Inc. 1,113 112<br />
Boliden AB 2,834 43<br />
Electrolux AB, Series B 2,800 61<br />
Hennes & Mauritz AB, Class B 10,651 454<br />
Industrivarden AB, Class C 1,183 23<br />
Investment AB Kinnevik, Class B 2,571 95<br />
Nordea Bank AB 34,078 484<br />
Sandvik AB 12,086 171<br />
Scania AB, Class B 3,447 101<br />
Skandinaviska Enskilda Banken AB,<br />
Class A 16,874 231<br />
Skanska AB, Class B 4,355 103<br />
SKF AB, Class B 4,519 116<br />
Svenska Cellulosa AB S.C.A., Class B 6,507 192<br />
Swedbank AB, Class A 10,199 274<br />
TeliaSonera AB 26,921 203<br />
Volvo AB, Class B 16,853 267<br />
3,563<br />
Switzerland - 4.2%<br />
ACE Ltd. 3,784 375<br />
Actelion Ltd. (Registered)* 1,157 110<br />
See Notes to the Financial Statements.<br />
NORTHERN FUNDS ANNUAL REPORT 51 EQUITY INDEX FUNDS
SCHEDULE OF INVESTMENTS<br />
GLOBAL SUSTAINABILITY INDEX FUND continued<br />
NUMBER<br />
OF SHARES<br />
continued<br />
VALUE<br />
(000S)<br />
COMMON STOCKS - 96.9%<br />
Switzerland - 4.2% continued<br />
Aryzta A.G.* 952 $84<br />
Coca-Cola HBC A.G. - CDI 2,191 55<br />
Geberit A.G. (Registered) 408 134<br />
Givaudan S.A. (Registered)* 105 162<br />
Holcim Ltd. (Registered)* 2,550 212<br />
Lindt & Spruengli A.G. (Registered) 1 59<br />
Lindt & Spruengli A.G.<br />
(Participation Certificate) 9 45<br />
Lonza Group A.G. (Registered)* 572 58<br />
Novartis A.G. (Registered) 25,702 2,183<br />
Pentair Ltd. (Registered) 2,179 173<br />
Roche Holding A.G. (Genusschein) 7,850 2,360<br />
SGS S.A. (Registered) 62 153<br />
Sika A.G. (Bearer) 25 102<br />
STMicroelectronics N.V. 7,391 68<br />
Sulzer A.G. (Registered) 237 33<br />
Swiss Re A.G.* 3,958 367<br />
Swisscom A.G. (Registered) 264 162<br />
Tyco International Ltd. 5,100 216<br />
Weatherford International Ltd.* 8,700 151<br />
Wolseley PLC 2,978 170<br />
7,432<br />
United Kingdom - 8.8%<br />
3i Group PLC 10,418 69<br />
Aberdeen Asset Management PLC 10,129 66<br />
Aggreko PLC 2,925 73<br />
AMEC PLC 3,220 60<br />
Associated British Foods PLC 3,957 184<br />
Aviva PLC 33,227 265<br />
BG Group PLC 38,172 712<br />
British Land Co. PLC 10,867 119<br />
BT Group PLC 88,631 564<br />
Bunzl PLC 3,821 102<br />
Capita PLC 7,493 137<br />
Centrica PLC 57,375 316<br />
Delphi Automotive PLC 3,200 217<br />
easyJet PLC 1,749 50<br />
Ensco PLC, Class A 2,700 143<br />
Fresnillo PLC 2,068 29<br />
GKN PLC 18,720 122<br />
GlaxoSmithKline PLC 54,333 1,447<br />
Hammerson PLC 7,602 70<br />
HSBC Holdings PLC 209,482 2,121<br />
InterContinental Hotels Group PLC 2,818 91<br />
NUMBER<br />
OF SHARES<br />
COMMON STOCKS - 96.9% continued<br />
United Kingdom - 8.8% continued<br />
VALUE<br />
(000S)<br />
Intertek Group PLC 1,765 $91<br />
Intu Properties PLC 7,745 36<br />
Investec PLC 6,523 53<br />
J Sainsbury PLC 13,050 69<br />
Johnson Matthey PLC 2,218 121<br />
Kingfisher PLC 26,330 185<br />
Land Securities Group PLC 8,931 152<br />
Legal & General Group PLC 65,343 223<br />
Liberty Global PLC, Class A* 2,297 96<br />
Liberty Global PLC, Class C* 5,937 242<br />
London Stock Exchange Group PLC 1,905 63<br />
Marks & Spencer Group PLC 18,088 136<br />
Meggitt PLC 8,453 68<br />
National Grid PLC 41,809 574<br />
Next PLC 1,752 193<br />
Noble Corp. PLC 2,900 95<br />
Old Mutual PLC 55,440 186<br />
Pearson PLC 9,143 162<br />
Petrofac Ltd. 2,812 68<br />
Prudential PLC 28,665 607<br />
Reckitt Benckiser Group PLC 7,259 592<br />
Reed Elsevier PLC 13,032 199<br />
Rexam PLC 8,693 71<br />
RSA Insurance Group PLC 39,544 59<br />
Schroders PLC 1,137 49<br />
Segro PLC 8,179 45<br />
Smiths Group PLC 4,265 91<br />
SSE PLC 10,892 267<br />
Standard Chartered PLC 27,203 569<br />
Standard Life PLC 26,940 170<br />
Subsea 7 S.A. 2,821 52<br />
Tate & Lyle PLC 5,144 57<br />
Tesco PLC 90,739 447<br />
Travis Perkins PLC 2,666 84<br />
Tullow Oil PLC 10,217 128<br />
Unilever PLC 14,383 614<br />
Vodafone Group PLC 295,598 1,088<br />
Whitbread PLC 1,957 136<br />
William Hill PLC 9,456 54<br />
Willis Group Holdings PLC 1,800 79<br />
WM Morrison Supermarkets PLC 25,486 91<br />
WPP PLC 14,752 305<br />
15,624<br />
See Notes to the Financial Statements.<br />
EQUITY INDEX FUNDS 52 NORTHERN FUNDS ANNUAL REPORT
MARCH 31, 2014<br />
NUMBER<br />
OF SHARES<br />
continued<br />
VALUE<br />
(000S)<br />
COMMON STOCKS - 96.9%<br />
United States - 51.2%<br />
3M Co. 7,116 $966<br />
Abbott Laboratories 17,300 666<br />
Accenture PLC, Class A 7,100 566<br />
Adobe Systems, Inc.* 5,389 354<br />
Advance Auto Parts, Inc. 800 101<br />
Aetna, Inc. 4,063 305<br />
Aflac, Inc. 5,145 324<br />
Agilent Technologies, Inc. 3,660 205<br />
Air Products & Chemicals, Inc. 2,322 276<br />
Albemarle Corp. 900 60<br />
Alexion Pharmaceuticals, Inc.* 2,150 327<br />
American Express Co. 10,816 974<br />
American Tower Corp. 4,400 360<br />
American Water Works Co., Inc. 1,900 86<br />
AmerisourceBergen Corp. 2,600 171<br />
AMETEK, Inc. 2,750 142<br />
Amgen, Inc. 8,400 1,036<br />
Analog Devices, Inc. 3,505 186<br />
Annaly Capital Management, Inc. 10,800 118<br />
Apache Corp. 4,399 365<br />
Applied Materials, Inc. 13,591 278<br />
Autodesk, Inc.* 2,600 128<br />
AutoZone, Inc.* 383 206<br />
AvalonBay Communities, Inc. 1,400 184<br />
Avery Dennison Corp. 1,000 51<br />
Avon Products, Inc. 4,600 67<br />
Axis Capital Holdings Ltd. 1,100 50<br />
Baker Hughes, Inc. 4,900 319<br />
Ball Corp. 1,440 79<br />
Bank of New York Mellon (The) Corp. 12,938 457<br />
BB&T Corp. 7,940 319<br />
Becton Dickinson and Co. 2,213 259<br />
Bed Bath & Beyond, Inc.* 2,350 162<br />
Berkshire Hathaway, Inc., Class B* 12,397 1,549<br />
Best Buy Co., Inc. 3,125 83<br />
Biogen Idec, Inc.* 2,640 807<br />
BlackRock, Inc. 1,491 469<br />
BorgWarner, Inc. 2,620 161<br />
Boston Properties, Inc. 1,670 191<br />
Bristol-Myers Squibb Co. 18,383 955<br />
Bunge Ltd. 1,600 127<br />
C.H. Robinson Worldwide, Inc. 1,770 93<br />
CA, Inc. 3,400 105<br />
Cablevision Systems Corp.,<br />
Class A (New York Group) 1,991 34<br />
NUMBER<br />
OF SHARES<br />
continued<br />
VALUE<br />
(000S)<br />
COMMON STOCKS - 96.9%<br />
United States - 51.2% continued<br />
Calpine Corp.* 3,969 $83<br />
Cameron International Corp.* 2,700 167<br />
Campbell Soup Co. 2,200 99<br />
Capital One Financial Corp. 6,500 502<br />
CarMax, Inc.* 2,400 112<br />
CBRE Group, Inc., Class A* 3,223 88<br />
Celanese Corp., Series A 1,700 94<br />
CenterPoint Energy, Inc. 4,380 104<br />
CenturyLink, Inc. 6,696 220<br />
Cerner Corp.* 3,500 197<br />
Charles Schwab (The) Corp. 13,013 356<br />
Cheniere Energy, Inc.* 2,300 127<br />
Chipotle Mexican Grill, Inc.* 348 198<br />
Chubb (The) Corp. 2,832 253<br />
Cigna Corp. 3,069 257<br />
Cimarex Energy Co. 1,000 119<br />
Cisco Systems, Inc. 59,756 1,339<br />
CIT Group, Inc. 2,200 108<br />
Clorox (The) Co. 1,400 123<br />
CME Group, Inc. 3,605 267<br />
Coca-Cola Enterprises, Inc. 2,800 134<br />
Cognizant Technology Solutions Corp.,<br />
Class A* 6,660 337<br />
Colgate-Palmolive Co. 10,328 670<br />
Comerica, Inc. 2,100 109<br />
ConAgra Foods, Inc. 4,700 146<br />
Concho Resources, Inc.* 1,173 144<br />
Consolidated Edison, Inc. 3,323 178<br />
Continental Resources, Inc.* 557 69<br />
Corning, Inc. 16,300 339<br />
Crown Castle International Corp. 3,657 270<br />
CSX Corp. 11,380 330<br />
Cummins, Inc. 1,959 292<br />
Danaher Corp. 6,664 500<br />
Darden Restaurants, Inc. 1,530 78<br />
DaVita HealthCare Partners, Inc.* 2,100 145<br />
Deere & Co. 4,054 368<br />
Denbury Resources, Inc. 4,100 67<br />
DENTSPLY International, Inc. 1,500 69<br />
Devon Energy Corp. 4,305 288<br />
Digital Realty Trust, Inc. 1,400 74<br />
Discover Financial Services 5,290 308<br />
Discovery Communications, Inc., Class A* 1,600 132<br />
Discovery Communications, Inc., Class C* 900 69<br />
Dover Corp. 1,859 152<br />
See Notes to the Financial Statements.<br />
NORTHERN FUNDS ANNUAL REPORT 53 EQUITY INDEX FUNDS
SCHEDULE OF INVESTMENTS<br />
GLOBAL SUSTAINABILITY INDEX FUND continued<br />
NUMBER<br />
OF SHARES<br />
continued<br />
VALUE<br />
(000S)<br />
COMMON STOCKS - 96.9%<br />
United States - 51.2% continued<br />
Dr. Pepper Snapple Group, Inc. 2,289 $125<br />
Duke Energy Corp. 7,900 563<br />
Duke Realty Corp. 3,600 61<br />
Dun & Bradstreet (The) Corp. 423 42<br />
Eastman Chemical Co. 1,700 147<br />
Eaton Corp. PLC 5,189 390<br />
Ecolab, Inc. 3,072 332<br />
Edwards Lifesciences Corp.* 1,200 89<br />
EMC Corp. 23,000 630<br />
Emerson Electric Co. 7,855 525<br />
Energen Corp. 800 65<br />
Energizer Holdings, Inc. 700 71<br />
EOG Resources, Inc. 3,089 606<br />
EQT Corp. 1,705 165<br />
Equifax, Inc. 1,300 88<br />
<strong>Equity</strong> Residential 3,800 220<br />
Estee Lauder (The) Cos., Inc., Class A 2,600 174<br />
Expeditors International of<br />
Washington, Inc. 2,190 87<br />
Fastenal Co. 3,128 154<br />
Federal Realty Investment Trust 700 80<br />
FleetCor Technologies, Inc.* 800 92<br />
Flextronics International Ltd.* 6,253 58<br />
Fluor Corp. 1,800 140<br />
FMC Technologies, Inc.* 2,700 141<br />
Ford Motor Co. 41,200 643<br />
Franklin Resources, Inc. 4,524 245<br />
Frontier Communications Corp. 11,600 66<br />
GameStop Corp., Class A 1,200 49<br />
Gap (The), Inc. 2,775 111<br />
General Mills, Inc. 7,160 371<br />
Genuine Parts Co. 1,720 149<br />
Gilead Sciences, Inc.* 17,124 1,213<br />
Google, Inc., Class A* 3,089 3,443<br />
Harley-Davidson, Inc. 2,555 170<br />
Hartford Financial Services Group (The),<br />
Inc. 4,800 169<br />
Hasbro, Inc. 1,400 78<br />
HCP, Inc. 5,100 198<br />
Health Care REIT, Inc. 3,300 197<br />
Henry Schein, Inc.* 933 111<br />
Herbalife Ltd. 900 52<br />
Hertz Global Holdings, Inc.* 5,100 136<br />
Hess Corp. 3,446 286<br />
Hewlett-Packard Co. 21,483 695<br />
NUMBER<br />
OF SHARES<br />
continued<br />
VALUE<br />
(000S)<br />
COMMON STOCKS - 96.9%<br />
United States - 51.2% continued<br />
Hologic, Inc.* 2,900 $62<br />
Hormel Foods Corp. 1,700 84<br />
Host Hotels & Resorts, Inc. 8,529 173<br />
Humana, Inc. 1,747 197<br />
IHS, Inc., Class A* 725 88<br />
Illinois Tool Works, Inc. 4,721 384<br />
Ingersoll-Rand PLC 3,280 188<br />
Integrys Energy Group, Inc. 800 48<br />
Intel Corp. 55,595 1,435<br />
IntercontinentalExchange Group, Inc. 1,248 247<br />
International Business Machines Corp. 11,511 2,216<br />
International Flavors & Fragrances, Inc. 900 86<br />
International Paper Co. 4,622 212<br />
Intuit, Inc. 3,100 241<br />
Invesco Ltd. 5,000 185<br />
Iron Mountain, Inc. 1,606 44<br />
Jacobs Engineering Group, Inc.* 1,400 89<br />
JB Hunt Transport Services, Inc. 1,000 72<br />
JM Smucker (The) Co. 1,200 117<br />
Johnson & Johnson 31,501 3,094<br />
Johnson Controls, Inc. 7,721 365<br />
Joy Global, Inc. 1,134 66<br />
Kellogg Co. 2,900 182<br />
Keurig Green Mountain, Inc. 1,421 150<br />
KeyCorp 10,219 146<br />
Kimberly-Clark Corp. 4,235 467<br />
Kinder Morgan Management LLC* 1,196 86<br />
Kohl’s Corp. 2,200 125<br />
Kraft Foods Group, Inc. 6,700 376<br />
Kroger (The) Co. 5,600 244<br />
Laboratory Corp. of America Holdings* 1,000 98<br />
Lam Research Corp.* 1,900 104<br />
Legg Mason, Inc. 1,200 59<br />
Level 3 Communications, Inc.* 1,800 70<br />
Liberty Interactive Corp., Class A* 5,300 153<br />
Liberty Media Corp., Class A* 1,100 144<br />
Liberty Property Trust 1,700 63<br />
LKQ Corp.* 3,200 84<br />
Lowe’s Cos., Inc. 11,800 577<br />
LyondellBasell Industries N.V., Class A 5,245 466<br />
M&T Bank Corp. 1,341 163<br />
Macerich (The) Co. 1,500 93<br />
Macy’s, Inc. 4,100 243<br />
Manpowergroup, Inc. 900 71<br />
See Notes to the Financial Statements.<br />
EQUITY INDEX FUNDS 54 NORTHERN FUNDS ANNUAL REPORT
MARCH 31, 2014<br />
NUMBER<br />
OF SHARES<br />
continued<br />
VALUE<br />
(000S)<br />
COMMON STOCKS - 96.9%<br />
United States - 51.2% continued<br />
Marathon Oil Corp. 7,900 $281<br />
Marathon Petroleum Corp. 3,400 296<br />
Marriott International, Inc., Class A 2,716 152<br />
Marsh & McLennan Cos., Inc. 6,200 306<br />
Masco Corp. 3,940 87<br />
Mattel, Inc. 3,848 154<br />
McCormick & Co., Inc. (Non Voting) 1,300 93<br />
McDonald’s Corp. 11,102 1,088<br />
MDU Resources Group, Inc. 2,000 69<br />
Mead Johnson Nutrition Co. 2,234 186<br />
MeadWestvaco Corp. 1,938 73<br />
Medtronic, Inc. 11,175 688<br />
Merck & Co., Inc. 32,700 1,856<br />
Mettler-Toledo International, Inc.* 300 71<br />
MGM Resorts International* 4,200 109<br />
Microchip Technology, Inc. 2,300 110<br />
Mohawk Industries, Inc.* 665 90<br />
Mondelez International, Inc., Class A 18,663 645<br />
Mosaic (The) Co. 3,300 165<br />
Motorola Solutions, Inc. 2,508 161<br />
NASDAQ OMX Group (The), Inc. 1,300 48<br />
National Oilwell Varco, Inc. 4,712 367<br />
Netflix, Inc.* 596 210<br />
NetSuite, Inc.* 400 38<br />
New York Community Bancorp, Inc. 4,700 76<br />
Newell Rubbermaid, Inc. 3,115 93<br />
NextEra Energy, Inc. 4,882 467<br />
NIKE, Inc., Class B 7,960 588<br />
NiSource, Inc. 3,400 121<br />
Noble Energy, Inc. 3,900 277<br />
Nordstrom, Inc. 1,657 103<br />
Norfolk Southern Corp. 3,407 331<br />
Northeast Utilities 3,511 160<br />
<strong>Northern</strong> Trust Corp. (1) (2) 2,400 157<br />
Nucor Corp. 3,574 181<br />
Occidental Petroleum Corp. 9,000 858<br />
Oceaneering International, Inc. 1,200 86<br />
ONEOK, Inc. 2,200 130<br />
Oracle Corp. 40,700 1,665<br />
O’Reilly Automotive, Inc.* 1,200 178<br />
Owens-Illinois, Inc.* 1,879 64<br />
PACCAR, Inc. 3,975 268<br />
Pall Corp. 1,200 107<br />
Parker Hannifin Corp. 1,690 202<br />
NUMBER<br />
OF SHARES<br />
continued<br />
VALUE<br />
(000S)<br />
COMMON STOCKS - 96.9%<br />
United States - 51.2% continued<br />
PartnerRe Ltd. 500 $52<br />
Patterson Cos., Inc. 881 37<br />
People’s United Financial, Inc. 3,347 50<br />
Pepco Holdings, Inc. 2,700 55<br />
PepsiCo, Inc. 17,128 1,430<br />
PetSmart, Inc. 1,100 76<br />
PG&E Corp. 4,935 213<br />
Phillips 66 6,400 493<br />
Pinnacle West Capital Corp. 1,200 66<br />
Pioneer Natural Resources Co. 1,550 290<br />
Plum Creek Timber Co., Inc. 1,900 80<br />
PNC Financial Services Group (The), Inc. 5,929 516<br />
Polaris Industries, Inc. 700 98<br />
Praxair, Inc. 3,344 438<br />
Precision Castparts Corp. 1,600 404<br />
Principal Financial Group, Inc. 3,302 152<br />
Procter & Gamble (The) Co. 30,368 2,448<br />
Progressive (The) Corp. 6,471 157<br />
Prologis, Inc. 5,595 228<br />
Prudential Financial, Inc. 5,172 438<br />
Public Service Enterprise Group, Inc. 5,700 217<br />
PVH Corp. 900 112<br />
QEP Resources, Inc. 1,849 54<br />
QUALCOMM, Inc. 18,900 1,490<br />
Quanta Services, Inc.* 2,300 85<br />
Range Resources Corp. 1,800 149<br />
RenaissanceRe Holdings Ltd. 518 51<br />
Robert Half International, Inc. 1,600 67<br />
Rock-Tenn Co., Class A 854 90<br />
Rockwell Automation, Inc. 1,567 195<br />
Rockwell Collins, Inc. 1,432 114<br />
Roper Industries, Inc. 1,089 145<br />
Ross Stores, Inc. 2,502 179<br />
Royal Caribbean Cruises Ltd. 1,800 98<br />
Safeway, Inc. 2,700 100<br />
Salesforce.com, Inc.* 6,300 360<br />
SBA Communications Corp., Class A* 1,400 127<br />
Scripps Networks Interactive, Inc., Class A 900 68<br />
Sealed Air Corp. 2,200 72<br />
Sempra Energy 2,627 254<br />
Sherwin-Williams (The) Co. 1,000 197<br />
Sigma-Aldrich Corp. 1,300 121<br />
Simon Property Group, Inc. 3,441 564<br />
Southwestern Energy Co.* 3,900 179<br />
See Notes to the Financial Statements.<br />
NORTHERN FUNDS ANNUAL REPORT 55 EQUITY INDEX FUNDS
SCHEDULE OF INVESTMENTS<br />
GLOBAL SUSTAINABILITY INDEX FUND continued<br />
NUMBER<br />
OF SHARES<br />
continued<br />
VALUE<br />
(000S)<br />
COMMON STOCKS - 96.9%<br />
United States - 51.2% continued<br />
Spectra Energy Corp. 7,400 $273<br />
Sprint Corp.* 11,092 102<br />
Staples, Inc. 7,155 81<br />
Starbucks Corp. 8,412 617<br />
Starwood Hotels & Resorts<br />
Worldwide, Inc. 2,080 166<br />
State Street Corp. 4,826 336<br />
Superior Energy Services, Inc. 1,778 55<br />
Symantec Corp. 7,800 156<br />
Sysco Corp. 6,417 232<br />
T Rowe Price Group, Inc. 2,929 241<br />
Target Corp. 6,771 410<br />
TD Ameritrade Holding Corp. 2,400 81<br />
Teradata Corp.* 1,900 93<br />
Tesla Motors, Inc.* 960 200<br />
Tesoro Corp. 1,400 71<br />
Texas Instruments, Inc. 12,272 579<br />
Thermo Fisher Scientific, Inc. 4,100 493<br />
Tiffany & Co. 1,467 126<br />
Time Warner Cable, Inc. 3,200 439<br />
Time Warner, Inc. 10,100 660<br />
TJX (The) Cos., Inc. 8,036 487<br />
Tractor Supply Co. 1,500 106<br />
Travelers (The) Cos., Inc. 4,097 349<br />
TripAdvisor, Inc.* 1,300 118<br />
UDR, Inc. 2,700 70<br />
Ulta Salon Cosmetics & Fragrance, Inc.* 700 68<br />
Under Armour, Inc., Class A* 900 103<br />
Union Pacific Corp. 5,150 966<br />
United Parcel Service, Inc., Class B 8,041 783<br />
US Bancorp 20,405 875<br />
Varian Medical Systems, Inc.* 1,200 101<br />
Ventas, Inc. 3,300 200<br />
Vertex Pharmaceuticals, Inc.* 2,500 177<br />
VF Corp. 3,944 244<br />
Vornado Realty Trust 1,836 181<br />
Waste Management, Inc. 4,900 206<br />
Waters Corp.* 1,000 108<br />
Weyerhaeuser Co. 6,600 194<br />
Whirlpool Corp. 860 129<br />
Whiting Petroleum Corp.* 1,342 93<br />
Whole Foods Market, Inc. 3,900 198<br />
Williams (The) Cos., Inc. 7,700 312<br />
Windstream Holdings, Inc. 6,990 58<br />
Wisconsin Energy Corp. 2,600 121<br />
(1)<br />
NUMBER<br />
OF SHARES<br />
continued<br />
VALUE<br />
(000S)<br />
COMMON STOCKS - 96.9%<br />
United States - 51.2% continued<br />
WW Grainger, Inc. 661 $167<br />
Xcel Energy, Inc. 5,500 167<br />
Xerox Corp. 12,631 143<br />
Xylem, Inc. 2,100 76<br />
Yahoo!, Inc.* 10,800 388<br />
90,949<br />
Total Common Stocks (3)<br />
(Cost $125,091) 172,190<br />
PREFERRED STOCKS - 0.4%<br />
Germany - 0.4%<br />
Bayerische Motoren Werke A.G. 600 57<br />
Henkel A.G. & Co. KGaA 2,013 216<br />
Volkswagen A.G. 1,624 421<br />
694<br />
Total Preferred Stocks (3)<br />
(Cost $508) 694<br />
RIGHTS - 0.0%<br />
Spain - 0.0%<br />
Banco Bilbao Vizcaya Argentaria S.A.* 64,751 15<br />
United Kingdom - 0.0%<br />
Intu Properties PLC* 2,212 4<br />
RSA Insurance Group PLC* 14,829 8<br />
12<br />
Total Rights (3)<br />
(Cost $24) 27<br />
INVESTMENT COMPANIES - 1.7%<br />
<strong>Northern</strong> Institutional <strong>Funds</strong> -<br />
Diversified Assets Portfolio, 0.01% (4) (5) 3,015,497 3,015<br />
Total Investment Companies<br />
(Cost $3,015) 3,015<br />
Total Investments - 99.0%<br />
(Cost $128,638) 175,926<br />
Other Assets less Liabilities - 1.0% 1,749<br />
NET ASSETS - 100.0% $177,675<br />
At March 31, 2013, the value of the Fund’s investment in <strong>Northern</strong> Trust Corp.<br />
was approximately $109,000. There were net purchases of approximately<br />
$25,000 during the fiscal year ended March 31, 2014. The change in net<br />
See Notes to the Financial Statements.<br />
EQUITY INDEX FUNDS 56 NORTHERN FUNDS ANNUAL REPORT
MARCH 31, 2014<br />
(2)<br />
(3)<br />
(4)<br />
(5)<br />
*<br />
unrealized appreciation during the fiscal year<br />
ended March 31, 2014, was approximately $23,000.<br />
Investment in affiliate.<br />
In accordance with the Fund’s prospectus, adjustment factors were provided<br />
by an independent evaluation service to determine the value of certain<br />
foreign securities.<br />
At March 31, 2013, the value of the Fund’s investment in the Diversified Assets<br />
Portfolio of the <strong>Northern</strong> Institutional <strong>Funds</strong> was approximately $2,326,000<br />
with net purchases of approximately $689,000 during the fiscal year<br />
ended March 31, 2014.<br />
Investment in affiliated Portfolio. <strong>Northern</strong> Trust Investments, Inc. is the<br />
investment adviser to the Fund and the investment adviser to the <strong>Northern</strong><br />
Institutional <strong>Funds</strong>.<br />
Non-Income Producing Security<br />
Percentages shown are based on Net Assets. The classifications shown on the<br />
Schedule of Investments and in the tables herein are unaudited.<br />
At March 31, 2014, the Fund had open futures contracts as follows:<br />
TYPE<br />
NUMBER OF<br />
CONTRACTS<br />
NOTIONAL<br />
AMOUNT<br />
(000S)<br />
CONTRACT<br />
POSITION<br />
CONTRACT<br />
EXP.<br />
UNREALIZED<br />
GAINS (LOSSES)<br />
(000S)<br />
E-mini S&P<br />
500<br />
(United States<br />
Dollar) 30 $2,797 Long 6/14 $26<br />
Euro Stoxx<br />
50<br />
(Euro) 16 683 Long 6/14 33<br />
FTSE 100<br />
<strong>Index</strong><br />
(British<br />
Pound) 5 545 Long 6/14 5<br />
S&P/TSX 60<br />
<strong>Index</strong><br />
(Canadian<br />
Dollar) 1 148 Long 6/14 1<br />
SPI 200<br />
<strong>Index</strong><br />
(Australian<br />
Dollar) 2 250 Long 6/14 4<br />
Topix <strong>Index</strong><br />
(Japanese<br />
Yen) 1 117 Long 6/14 3<br />
Yen<br />
Denominated<br />
Nikkei 225<br />
(Japanese<br />
Yen) 5 359 Long 6/14 15<br />
Total $87<br />
At March 31, 2014, the Fund’s investments were denominated in the following<br />
currencies (unaudited):<br />
% OF LONG-TERM<br />
CONCENTRATION BY CURRENCY<br />
INVESTMENTS<br />
United States Dollar 53.8%<br />
Euro 12.3<br />
Japanese Yen 9.0<br />
British Pound 8.6<br />
All other currencies less than 5% 16.3<br />
Total 100.0%<br />
At March 31, 2014, the industry sectors (unaudited) for the Fund were:<br />
% OF LONG-TERM<br />
INDUSTRY SECTOR<br />
INVESTMENTS<br />
Consumer Discretionary 12.3%<br />
Consumer Staples 9.6<br />
Energy 7.3<br />
Financials 21.9<br />
Health Care 13.2<br />
Industrials 11.5<br />
Information Technology 12.3<br />
Materials 5.8<br />
Telecommunication Services 2.7<br />
Utilities 3.4<br />
Total 100.0%<br />
At March 31, 2014, the Fund had outstanding forward foreign currency<br />
exchange contracts as follows:<br />
CONTRACTS<br />
TO<br />
DELIVER<br />
CURRENCY<br />
AMOUNT<br />
(LOCAL<br />
CURRENCY)<br />
(000S)<br />
IN<br />
EXCHANGE<br />
FOR<br />
CURRENCY<br />
AMOUNT<br />
(LOCAL<br />
UNREALIZED<br />
GAINS<br />
(LOSSES)<br />
(000S)<br />
CURRENCY) SETTLEMENT<br />
COUNTERPARTY<br />
(000S) DATE<br />
United States<br />
Goldman Sachs British Pound 205 Dollar 340 6/18/14 $(2)<br />
United States<br />
Goldman Sachs Canadian Dollar 190 Dollar 170 6/18/14 (2)<br />
United States<br />
Morgan Stanley Euro 290 Dollar 400 6/18/14 1<br />
United States<br />
Morgan Stanley Japanese Yen 30,687 Dollar 300 6/18/14 3<br />
United States<br />
Morgan Stanley Swiss Franc 111 Dollar 125 6/18/14 —*<br />
Australian<br />
Morgan Stanley United States Dollar 110 Dollar 122 6/18/14 2<br />
Citibank United States Dollar 93 British Pound 56 6/18/14 —*<br />
Morgan Stanley United States Dollar 430 British Pound 261 6/18/14 4<br />
Citibank United States Dollar 157 Canadian Dollar 174 6/18/14 —*<br />
Morgan Stanley United States Dollar 150 Canadian Dollar 169 6/18/14 3<br />
Morgan Stanley United States Dollar 700 Euro 508 6/18/14 —*<br />
Citibank United States Dollar 360 Japanese Yen 36,845 6/18/14 (3)<br />
Citibank United States Dollar 242 Japanese Yen 24,553 6/18/14 (4)<br />
See Notes to the Financial Statements.<br />
NORTHERN FUNDS ANNUAL REPORT 57 EQUITY INDEX FUNDS
SCHEDULE OF INVESTMENTS<br />
GLOBAL SUSTAINABILITY INDEX FUND continued MARCH 31, 2014<br />
CONTRACTS<br />
TO<br />
AMOUNT<br />
(LOCAL<br />
IN<br />
EXCHANGE<br />
AMOUNT<br />
(LOCAL<br />
UNREALIZED<br />
GAINS<br />
DELIVER CURRENCY) FOR CURRENCY) SETTLEMENT (LOSSES)<br />
COUNTERPARTY CURRENCY (000S) CURRENCY (000S) DATE (000S)<br />
Morgan Stanley United States Dollar 150 Swiss Franc 133 6/18/14 $—*<br />
*<br />
Total $2<br />
Amount rounds to less than one thousand.<br />
Various inputs are used in determining the value of the Fund’s investments. These<br />
inputs are summarized in three levels listed below:<br />
Level 1 - Unadjusted quoted market prices in active markets for identical securities<br />
on the measurement date.<br />
Level 2 - Other observable inputs (e.g., quoted prices in active markets for similar<br />
securities, securities valuations based on commonly quoted benchmark interest<br />
rates and yield curves, maturities, ratings and/or securities indices). The Fund<br />
adjusted the price of certain foreign equity securities held in its portfolio<br />
on March 31, 2014 using adjustment factors designed to reflect more accurately<br />
the fair value of the securities. See Note 2 for a discussion of this procedure. The<br />
fair valuation of these securities resulted in their categorization as Level 2<br />
investments.<br />
Level 3 - Significant unobservable inputs (e.g., information about assumptions,<br />
including risk, market participants would use in pricing a security).<br />
The inputs or methodologies used for valuing securities are not necessarily an<br />
indication of the risk associated with investing in those securities and other<br />
financial instruments, if any. The following table summarizes the valuation of the<br />
Fund’s investments by the above fair value hierarchy as of March 31, 2014:<br />
LEVEL 1<br />
(000S)<br />
LEVEL 2<br />
(000S)<br />
LEVEL 3<br />
(000S)<br />
TOTAL<br />
(000S)<br />
INVESTMENTS<br />
Common Stocks<br />
Canada $ 7,951 $ — $ — $ 7,951<br />
Netherlands 99 3,583 — 3,682<br />
Sweden 112 3,451 — 3,563<br />
Switzerland 915 6,517 — 7,432<br />
United Kingdom 871 14,753 — 15,624<br />
United States 90,949 — — 90,949<br />
All Other Countries — 42,989 (1) — 42,989<br />
Preferred Stocks — 694 (1) — 694<br />
Rights — 27 (1) — 27<br />
Investment Companies 3,015 — — 3,015<br />
Total Investments $103,912 $72,014 $ — $175,926<br />
INVESTMENTS<br />
OTHER FINANCIAL<br />
INSTRUMENTS<br />
LEVEL 1<br />
(000S)<br />
LEVEL 2<br />
(000S)<br />
LEVEL 3<br />
(000S)<br />
TOTAL<br />
(000S)<br />
Assets<br />
Futures Contracts $87 $— $— $87<br />
Forward Foreign<br />
Currency Exchange<br />
Contracts — 13 — 13<br />
Liabilities<br />
Forward Foreign<br />
Currency Exchange<br />
Contracts — (11) — (11)<br />
Total Other Financial<br />
Instruments $87 $ 2 $— $89<br />
(1)<br />
Classifications as defined in the Schedule of Investments.<br />
The Fund discloses all transfers between levels based on valuations at the end of<br />
each reporting period.<br />
At March 31, 2014, the Fund had transfers from Level 1 to Level 2 as disclosed<br />
below:<br />
Transfers from Level 1 to Level 2<br />
Country<br />
Common Stocks<br />
Japan<br />
Value<br />
(000S)<br />
Total $ 13,969<br />
Reason<br />
13,969 Valuations at last trade with foreign value adjustments<br />
See Notes to the Financial Statements.<br />
EQUITY INDEX FUNDS 58 NORTHERN FUNDS ANNUAL REPORT
SCHEDULE OF INVESTMENTS<br />
INTERNATIONAL EQUITY INDEX FUND MARCH 31, 2014<br />
NUMBER<br />
OF SHARES<br />
VALUE<br />
(000S)<br />
COMMON STOCKS - 96.7%<br />
Australia - 7.7%<br />
AGL Energy Ltd. 189,247 $2,665<br />
ALS Ltd. 118,745 808<br />
Alumina Ltd.* 859,995 954<br />
Amcor Ltd. 418,581 4,036<br />
AMP Ltd. 995,948 4,607<br />
APA Group 298,093 1,778<br />
Asciano Ltd. 329,960 1,592<br />
ASX Ltd. 68,552 2,294<br />
Aurizon Holdings Ltd. 682,746 3,262<br />
Australia & New Zealand Banking<br />
Group Ltd. 927,813 28,515<br />
Bank of Queensland Ltd. 104,202 1,245<br />
Bendigo and Adelaide Bank Ltd. 152,340 1,611<br />
BGP Holdings PLC - (Fractional Shares) (1) * 1,085,479 —<br />
BHP Billiton Ltd. 1,086,552 36,787<br />
Boral Ltd. 264,005 1,384<br />
Brambles Ltd. 534,286 4,591<br />
Caltex Australia Ltd. 45,247 929<br />
CFS Retail Property Trust Group 701,819 1,230<br />
Coca-Cola Amatil Ltd. 199,882 2,045<br />
Cochlear Ltd. 19,198 1,015<br />
Commonwealth Bank of Australia 547,584 39,418<br />
Computershare Ltd. 162,416 1,824<br />
Crown Resorts Ltd. 135,797 2,096<br />
CSL Ltd. 164,208 10,597<br />
Dexus Property Group 1,864,171 1,833<br />
Echo Entertainment Group Ltd. 266,882 607<br />
Federation Centres Ltd. 476,350 1,043<br />
Flight Centre Travel Group Ltd. 18,647 908<br />
Fortescue Metals Group Ltd. 529,682 2,595<br />
Goodman Group 586,346 2,573<br />
GPT Group 573,564 1,947<br />
Harvey Norman Holdings Ltd. 158,740 486<br />
Iluka Resources Ltd. 141,286 1,300<br />
Incitec Pivot Ltd. 556,113 1,528<br />
Insurance Australia Group Ltd. 787,580 4,076<br />
James Hardie Industries PLC - CDI 150,182 1,997<br />
Leighton Holdings Ltd. 57,203 1,120<br />
Lend Lease Group 196,427 2,160<br />
Macquarie Group Ltd. 98,159 5,294<br />
Metcash Ltd. 275,252 669<br />
Mirvac Group 1,320,918 2,083<br />
National Australia Bank Ltd. 794,404 26,182<br />
Newcrest Mining Ltd.* 261,078 2,400<br />
Orica Ltd. 125,564 2,549<br />
NUMBER<br />
OF SHARES<br />
continued<br />
VALUE<br />
(000S)<br />
COMMON STOCKS - 96.7%<br />
Australia - 7.7% continued<br />
Origin Energy Ltd. 372,602 $4,940<br />
Qantas Airways Ltd.* 335,634 345<br />
QBE Insurance Group Ltd. 413,030 4,914<br />
Ramsay Health Care Ltd. 47,054 2,101<br />
REA Group Ltd. 17,163 776<br />
Rio Tinto Ltd. 147,754 8,739<br />
Santos Ltd. 338,407 4,239<br />
Seek Ltd. 109,228 1,781<br />
Sonic Healthcare Ltd. 136,320 2,185<br />
SP AusNet 562,712 684<br />
Stockland 761,996 2,651<br />
Suncorp Group Ltd. 436,027 5,207<br />
Sydney Airport 383,141 1,493<br />
Tabcorp Holdings Ltd. 242,237 768<br />
Tatts Group Ltd. 479,516 1,290<br />
Telstra Corp. Ltd. 1,479,498 6,979<br />
Toll Holdings Ltd. 211,695 1,022<br />
Transurban Group 471,981 3,179<br />
Treasury Wine Estates Ltd. 215,985 707<br />
Wesfarmers Ltd. 389,096 14,871<br />
Westfield Group 672,061 6,391<br />
Westfield Retail Trust 1,026,659 2,838<br />
Westpac Banking Corp. 1,056,432 33,881<br />
Woodside Petroleum Ltd. 223,167 8,079<br />
Woolworths Ltd. 423,518 14,035<br />
WorleyParsons Ltd. 63,968 899<br />
353,627<br />
Austria - 0.3%<br />
Andritz A.G. 24,938 1,542<br />
Erste Group Bank A.G. 87,295 2,988<br />
IMMOFINANZ A.G.* 333,732 1,561<br />
OMV A.G. 50,759 2,305<br />
Raiffeisen Bank International A.G. 40,597 1,357<br />
Telekom Austria A.G. 66,437 659<br />
Vienna Insurance Group A.G.<br />
Wiener Versicherung Gruppe 11,517 569<br />
Voestalpine A.G. 38,185 1,683<br />
12,664<br />
Belgium - 1.2%<br />
Ageas 75,967 3,388<br />
Anheuser-Busch InBev N.V. 273,100 28,705<br />
Belgacom S.A. 55,766 1,750<br />
Colruyt S.A. 25,327 1,398<br />
Delhaize Group S.A. 36,494 2,674<br />
See Notes to the Financial Statements.<br />
NORTHERN FUNDS ANNUAL REPORT 59 EQUITY INDEX FUNDS
SCHEDULE OF INVESTMENTS<br />
INTERNATIONAL EQUITY INDEX FUND continued<br />
NUMBER<br />
OF SHARES<br />
continued<br />
VALUE<br />
(000S)<br />
COMMON STOCKS - 96.7%<br />
Belgium - 1.2% continued<br />
Groupe Bruxelles Lambert S.A. 28,140 $2,812<br />
KBC Groep N.V. 84,293 5,195<br />
Solvay S.A., Class A 19,889 3,126<br />
Telenet Group Holding N.V. 16,476 1,015<br />
UCB S.A. 38,385 3,078<br />
Umicore S.A. 38,252 1,953<br />
55,094<br />
Denmark - 1.4%<br />
AP Moeller - Maersk A/S, Class A 189 2,185<br />
AP Moeller - Maersk A/S, Class B 440 5,290<br />
Carlsberg A/S, Class B 37,407 3,727<br />
Coloplast A/S, Class B 38,031 3,082<br />
Danske Bank A/S 221,341 6,172<br />
DSV A/S 64,132 2,072<br />
Novo Nordisk A/S, Class B 675,623 30,821<br />
Novozymes A/S, Class B 77,239 3,401<br />
RTL Group S.A. 13,410 1,528<br />
TDC A/S 274,145 2,534<br />
Tryg A/S 8,332 824<br />
William Demant Holding A/S* 7,788 667<br />
62,303<br />
Finland - 0.9%<br />
Elisa OYJ 48,371 1,393<br />
Fortum OYJ 149,775 3,405<br />
Kone OYJ, Class B 105,538 4,432<br />
Metso OYJ 43,892 1,434<br />
Neste Oil OYJ 43,640 890<br />
Nokia OYJ* 1,266,933 9,328<br />
Nokian Renkaat OYJ 38,833 1,574<br />
Orion OYJ, Class B 31,079 939<br />
Pohjola Bank PLC, Class A 47,581 1,059<br />
Sampo OYJ, Class A 152,589 7,928<br />
Stora Enso OYJ (Registered) 194,903 2,088<br />
UPM-Kymmene OYJ 179,732 3,078<br />
Wartsila OYJ Abp 60,043 3,272<br />
40,820<br />
France - 10.0%<br />
Accor S.A. 55,792 2,860<br />
Aeroports de Paris 10,004 1,248<br />
Air Liquide S.A. 106,182 14,403<br />
Airbus Group N.V. 198,981 14,270<br />
Alcatel-Lucent* 941,411 3,720<br />
Alstom S.A. 74,441 2,036<br />
NUMBER<br />
OF SHARES<br />
continued<br />
VALUE<br />
(000S)<br />
COMMON STOCKS - 96.7%<br />
France - 10.0% continued<br />
ArcelorMittal 338,045 $5,476<br />
Arkema S.A. 21,625 2,453<br />
AtoS 22,820 2,065<br />
AXA S.A. 605,104 15,755<br />
BNP Paribas S.A. 338,362 26,157<br />
Bouygues S.A. 67,151 2,807<br />
Bureau Veritas S.A. 77,123 2,364<br />
Cap Gemini S.A. 48,072 3,645<br />
Carrefour S.A. 207,315 8,034<br />
Casino Guichard Perrachon S.A. 20,073 2,393<br />
CGG S.A.* 54,111 869<br />
Christian Dior S.A. 18,255 3,519<br />
Cie de St-Gobain 139,383 8,439<br />
Cie Generale des Etablissements Michelin 62,887 7,877<br />
CNP Assurances 60,302 1,278<br />
Credit Agricole S.A.* 337,098 5,324<br />
Danone S.A. 191,418 13,540<br />
Dassault Systemes S.A. 21,475 2,517<br />
Edenred 68,075 2,138<br />
Electricite de France 81,309 3,220<br />
Essilor International S.A. 68,844 6,957<br />
Eurazeo S.A. 9,274 834<br />
Eutelsat Communications S.A. 49,304 1,676<br />
Fonciere Des Regions 8,527 790<br />
GDF Suez 446,987 12,248<br />
Gecina S.A. 7,531 1,002<br />
Groupe Eurotunnel S.A. (Registered) 196,622 2,512<br />
ICADE 12,381 1,226<br />
Iliad S.A. 8,866 2,558<br />
Imerys S.A. 11,462 1,019<br />
JCDecaux S.A. 23,061 1,010<br />
Kering 25,474 5,203<br />
Klepierre 34,168 1,530<br />
Lafarge S.A. 63,847 5,005<br />
Lagardere S.C.A. 38,602 1,534<br />
Legrand S.A. 90,390 5,621<br />
L’Oreal S.A. 82,206 13,562<br />
LVMH Moet Hennessy Louis Vuitton S.A. 86,373 15,723<br />
Natixis 326,708 2,401<br />
Orange S.A. 626,434 9,264<br />
Pernod Ricard S.A. 71,489 8,329<br />
Publicis Groupe S.A. 61,246 5,539<br />
Remy Cointreau S.A. 7,675 617<br />
Renault S.A. 64,775 6,311<br />
See Notes to the Financial Statements.<br />
EQUITY INDEX FUNDS 60 NORTHERN FUNDS ANNUAL REPORT
MARCH 31, 2014<br />
NUMBER<br />
OF SHARES<br />
continued<br />
VALUE<br />
(000S)<br />
COMMON STOCKS - 96.7%<br />
France - 10.0% continued<br />
Rexel S.A. 82,282 $2,160<br />
Safran S.A. 91,639 6,355<br />
Sanofi 405,885 42,415<br />
Schneider Electric S.A. 181,945 16,176<br />
Schneider Electric S.A. 4,873 432<br />
SCOR S.E. 55,657 1,950<br />
SES S.A. 103,444 3,862<br />
Societe BIC S.A. 9,682 1,272<br />
Societe Generale S.A. 242,728 14,984<br />
Sodexo 31,411 3,298<br />
Suez Environnement Co. 95,634 1,943<br />
Technip S.A. 34,258 3,537<br />
Thales S.A. 30,233 2,007<br />
Total S.A. 726,535 47,719<br />
Unibail-Rodamco S.E. 32,767 8,520<br />
Valeo S.A. 25,738 3,630<br />
Vallourec S.A. 37,900 2,060<br />
Veolia Environnement S.A. 122,705 2,433<br />
Vinci S.A. 163,808 12,206<br />
Vivendi S.A. 406,641 11,344<br />
Wendel S.A. 11,250 1,750<br />
Zodiac Aerospace 61,495 2,173<br />
463,104<br />
Germany - 8.5%<br />
Adidas A.G. 71,047 7,697<br />
Allianz S.E. (Registered) 155,143 26,219<br />
Axel Springer S.E. 13,993 896<br />
BASF S.E. 310,855 34,547<br />
Bayer A.G. (Registered) 280,929 37,992<br />
Bayerische Motoren Werke A.G. 111,953 14,132<br />
Beiersdorf A.G. 34,308 3,346<br />
Brenntag A.G. 17,674 3,282<br />
Celesio A.G. 15,425 527<br />
Commerzbank A.G.* 327,782 6,031<br />
Continental A.G. 37,264 8,930<br />
Daimler A.G. (Registered) 327,180 30,920<br />
Deutsche Bank A.G. (Registered) 344,928 15,429<br />
Deutsche Boerse A.G. 65,546 5,216<br />
Deutsche Lufthansa A.G. (Registered)* 82,653 2,165<br />
Deutsche Post A.G. (Registered) 307,856 11,436<br />
Deutsche Telekom A.G. (Registered) 980,301 15,856<br />
Deutsche Wohnen A.G. (Bearer) 99,312 2,130<br />
E.ON S.E. 610,100 11,926<br />
COMMON STOCKS - 96.7%<br />
Germany - 8.5% continued<br />
NUMBER<br />
OF SHARES<br />
continued<br />
VALUE<br />
(000S)<br />
Fraport A.G. Frankfurt Airport<br />
Services Worldwide 11,638 $870<br />
Fresenius Medical Care A.G. & Co. KGaA 73,432 5,123<br />
Fresenius S.E. & Co. KGaA 42,650 6,674<br />
GEA Group A.G. 62,601 2,861<br />
Hannover Rueck S.E. 20,988 1,877<br />
HeidelbergCement A.G. 47,808 4,097<br />
Henkel A.G. & Co. KGaA 44,683 4,492<br />
Hochtief A.G. 10,566 960<br />
Hugo Boss A.G. 11,681 1,556<br />
Infineon Technologies A.G. 370,768 4,424<br />
K+S A.G. (Registered) 58,651 1,926<br />
Kabel Deutschland Holding A.G. 1,206 166<br />
Lanxess A.G. 29,975 2,261<br />
Linde A.G. 62,998 12,610<br />
MAN S.E. 12,310 1,569<br />
Merck KGaA 21,947 3,696<br />
Metro A.G. 44,246 1,808<br />
Muenchener Rueckversicherungs<br />
A.G. (Registered) 60,765 13,275<br />
OSRAM Licht A.G.* 29,217 1,898<br />
ProSiebenSat.1 Media A.G. (Registered) 75,168 3,447<br />
RWE A.G. 165,711 6,724<br />
SAP A.G. 311,870 25,244<br />
Siemens A.G. (Registered) 268,353 36,114<br />
Sky Deutschland A.G.* 151,141 1,303<br />
Suedzucker A.G. 27,744 791<br />
Telefonica Deutschland Holding A.G. 95,747 763<br />
ThyssenKrupp A.G.* 153,180 4,112<br />
United Internet A.G. (Registered) 36,045 1,692<br />
Volkswagen A.G. 9,963 2,525<br />
393,535<br />
Hong Kong - 2.7%<br />
AIA Group Ltd. 4,073,493 19,354<br />
ASM Pacific Technology Ltd. 70,000 680<br />
Bank of East Asia Ltd. 451,459 1,769<br />
BOC Hong Kong Holdings Ltd. 1,270,608 3,627<br />
Cathay Pacific Airways Ltd. 357,506 667<br />
Cheung Kong Holdings Ltd. 476,729 7,921<br />
Cheung Kong Infrastructure Holdings Ltd. 222,353 1,426<br />
CLP Holdings Ltd. 598,022 4,523<br />
First Pacific Co. Ltd. 731,539 730<br />
Galaxy Entertainment Group Ltd.* 710,148 6,202<br />
Hang Lung Properties Ltd. 751,501 2,162<br />
See Notes to the Financial Statements.<br />
NORTHERN FUNDS ANNUAL REPORT 61 EQUITY INDEX FUNDS
SCHEDULE OF INVESTMENTS<br />
INTERNATIONAL EQUITY INDEX FUND continued<br />
NUMBER<br />
OF SHARES<br />
continued<br />
VALUE<br />
(000S)<br />
COMMON STOCKS - 96.7%<br />
Hong Kong - 2.7% continued<br />
Hang Seng Bank Ltd. 262,579 $4,189<br />
Henderson Land Development Co. Ltd. 372,171 2,178<br />
HKT Trust and HKT Ltd. 748,000 790<br />
Hong Kong & China Gas Co. Ltd. 1,967,306 4,298<br />
Hong Kong Exchanges and Clearing Ltd. 366,518 5,560<br />
Hopewell Holdings Ltd. 178,000 613<br />
Hutchison Whampoa Ltd. 727,698 9,661<br />
Hysan Development Co. Ltd. 237,501 1,035<br />
Kerry Properties Ltd. 191,203 637<br />
Li & Fung Ltd. 1,973,218 2,925<br />
Link REIT (The) 808,271 3,978<br />
MGM China Holdings Ltd. 321,316 1,134<br />
MTR Corp. Ltd. 508,481 1,887<br />
New World Development Co. Ltd. 1,278,788 1,287<br />
Noble Group Ltd. 1,622,944 1,536<br />
NWS Holdings Ltd. 483,290 815<br />
PCCW Ltd. 1,304,374 655<br />
Power Assets Holdings Ltd. 469,933 4,082<br />
Sands China Ltd. 817,141 6,136<br />
Shangri-La Asia Ltd. 490,574 806<br />
Sino Land Co. Ltd. 993,174 1,461<br />
SJM Holdings Ltd. 675,572 1,906<br />
Sun Hung Kai Properties Ltd. 541,756 6,643<br />
Swire Pacific Ltd., Class A 228,551 2,668<br />
Swire Properties Ltd. 357,800 1,023<br />
Wharf Holdings Ltd. 512,766 3,283<br />
Wheelock & Co. Ltd. 311,021 1,218<br />
Wynn Macau Ltd. 548,546 2,284<br />
Yangzijiang Shipbuilding Holdings Ltd. 624,566 537<br />
Yue Yuen Industrial Holdings Ltd. 247,210 807<br />
125,093<br />
Ireland - 0.3%<br />
Bank of Ireland* 7,644,693 3,251<br />
CRH PLC 247,587 6,902<br />
CRH PLC (London Stock Exchange) 1,049 29<br />
Irish Bank Resolution Corp. Ltd. (1) * 99,788 —<br />
Kerry Group PLC, Class A 51,393 3,923<br />
Ryanair Holdings PLC* 3,150 33<br />
Ryanair Holdings PLC ADR* 5,370 316<br />
14,454<br />
Israel - 0.5%<br />
Bank Hapoalim B.M. 380,068 2,168<br />
Bank Leumi Le-Israel B.M.* 421,931 1,647<br />
COMMON STOCKS - 96.7%<br />
Israel - 0.5% continued<br />
NUMBER<br />
OF SHARES<br />
continued<br />
VALUE<br />
(000S)<br />
Bezeq The Israeli Telecommunication<br />
Corp. Ltd. 643,933 $1,147<br />
Delek Group Ltd. 1,283 512<br />
Israel (The) Corp. Ltd.* 844 471<br />
Israel Chemicals Ltd. 149,937 1,311<br />
Mizrahi Tefahot Bank Ltd. 43,765 599<br />
NICE Systems Ltd. 21,927 978<br />
Teva Pharmaceutical Industries Ltd. 288,412 15,209<br />
24,042<br />
Italy - 2.4%<br />
Assicurazioni Generali S.p.A. 393,614 8,784<br />
Atlantia S.p.A. 124,623 3,209<br />
Banca Monte dei Paschi di Siena S.p.A.* 1,876,821 685<br />
Enel Green Power S.p.A. 608,012 1,709<br />
Enel S.p.A. 2,228,481 12,627<br />
Eni S.p.A. 859,533 21,585<br />
Exor S.p.A. 34,499 1,550<br />
Fiat S.p.A.* 298,335 3,472<br />
Finmeccanica S.p.A.* 137,897 1,366<br />
Intesa Sanpaolo S.p.A. 3,934,234 13,360<br />
Luxottica Group S.p.A. 56,501 3,267<br />
Mediobanca S.p.A.* 179,831 2,060<br />
Pirelli & C. S.p.A. 82,244 1,292<br />
Prysmian S.p.A. 70,191 1,752<br />
Saipem S.p.A. 93,005 2,272<br />
Snam S.p.A. 696,637 4,082<br />
Telecom Italia S.p.A. 3,404,260 4,019<br />
Telecom Italia S.p.A. (RSP) 2,072,016 1,941<br />
Tenaris S.A. 159,420 3,528<br />
Terna Rete Elettrica Nazionale S.p.A. 514,785 2,759<br />
UniCredit S.p.A. 1,468,406 13,442<br />
Unione di Banche Italiane S.c.p.A. 303,559 2,866<br />
UnipolSai S.p.A.* 304,486 1,168<br />
112,795<br />
Japan - 19.1%<br />
ABC-Mart, Inc. 6,900 299<br />
Acom Co. Ltd.* 106,800 341<br />
Advantest Corp. 50,800 546<br />
Aeon Co. Ltd. 216,000 2,432<br />
AEON Financial Service Co. Ltd. 38,300 862<br />
Aeon Mall Co. Ltd. 39,080 1,003<br />
Air Water, Inc. 56,569 781<br />
Aisin Seiki Co. Ltd. 63,900 2,302<br />
Ajinomoto Co., Inc. 206,000 2,951<br />
See Notes to the Financial Statements.<br />
EQUITY INDEX FUNDS 62 NORTHERN FUNDS ANNUAL REPORT
MARCH 31, 2014<br />
NUMBER<br />
OF SHARES<br />
continued<br />
VALUE<br />
(000S)<br />
COMMON STOCKS - 96.7%<br />
Japan - 19.1% continued<br />
Alfresa Holdings Corp. 13,500 $879<br />
Amada Co. Ltd. 111,000 779<br />
ANA Holdings, Inc. 351,000 760<br />
Aozora Bank Ltd. 368,000 1,047<br />
Asahi Glass Co. Ltd. 351,000 2,032<br />
Asahi Group Holdings Ltd. 130,600 3,664<br />
Asahi Kasei Corp. 441,000 2,994<br />
Asics Corp. 54,400 1,067<br />
Astellas Pharma, Inc. 732,500 8,678<br />
Bank of Kyoto (The) Ltd. 114,971 948<br />
Bank of Yokohama (The) Ltd. 390,000 1,944<br />
Benesse Holdings, Inc. 23,700 904<br />
Bridgestone Corp. 219,000 7,756<br />
Brother Industries Ltd. 80,600 1,131<br />
Calbee, Inc. 22,000 519<br />
Canon, Inc. 383,200 11,859<br />
Casio Computer Co. Ltd. 75,400 891<br />
Central Japan Railway Co. 48,200 5,648<br />
Chiba Bank (The) Ltd. 264,000 1,625<br />
Chiyoda Corp. 51,746 672<br />
Chubu Electric Power Co., Inc.* 218,300 2,565<br />
Chugai Pharmaceutical Co. Ltd. 78,355 1,998<br />
Chugoku Bank (The) Ltd. 56,400 751<br />
Chugoku Electric Power (The) Co., Inc. 101,700 1,415<br />
Citizen Holdings Co. Ltd. 90,700 682<br />
Coca-Cola West Co. Ltd. 20,000 349<br />
Credit Saison Co. Ltd. 53,800 1,068<br />
Dai Nippon Printing Co. Ltd. 201,000 1,924<br />
Daicel Corp. 98,000 809<br />
Daido Steel Co. Ltd. 95,000 474<br />
Daihatsu Motor Co. Ltd. 71,900 1,268<br />
Dai-ichi Life Insurance (The) Co. Ltd. 289,400 4,198<br />
Daiichi Sankyo Co. Ltd. 231,700 3,897<br />
Daikin Industries Ltd. 79,200 4,429<br />
Dainippon Sumitomo Pharma Co. Ltd. 53,900 855<br />
Daito Trust Construction Co. Ltd. 24,600 2,273<br />
Daiwa House Industry Co. Ltd. 204,000 3,454<br />
Daiwa Securities Group, Inc. 560,000 4,864<br />
Dena Co. Ltd. 35,600 642<br />
Denso Corp. 163,000 7,804<br />
Dentsu, Inc. 73,918 2,799<br />
Don Quijote Holdings Co. Ltd. 20,300 1,047<br />
East Japan Railway Co. 112,912 8,313<br />
Eisai Co. Ltd. 85,000 3,306<br />
NUMBER<br />
OF SHARES<br />
continued<br />
VALUE<br />
(000S)<br />
COMMON STOCKS - 96.7%<br />
Japan - 19.1% continued<br />
Electric Power Development Co. Ltd. 39,500 $1,114<br />
FamilyMart Co. Ltd. 19,800 869<br />
FANUC Corp. 65,000 11,445<br />
Fast Retailing Co. Ltd. 17,900 6,480<br />
Fuji Electric Co. Ltd. 189,000 842<br />
Fuji Heavy Industries Ltd. 197,600 5,335<br />
FUJIFILM Holdings Corp. 160,900 4,312<br />
Fujitsu Ltd.* 624,000 3,767<br />
Fukuoka Financial Group, Inc. 290,000 1,190<br />
Gree, Inc. 35,781 394<br />
GungHo Online Entertainment, Inc. 117,000 637<br />
Gunma Bank (The) Ltd. 137,000 745<br />
Hachijuni Bank (The) Ltd. 125,395 711<br />
Hakuhodo DY Holdings, Inc. 80,100 558<br />
Hamamatsu Photonics K.K. 22,185 1,005<br />
Hankyu Hanshin Holdings, Inc. 379,000 2,062<br />
Hino Motors Ltd. 82,000 1,214<br />
Hirose Electric Co. Ltd. 10,900 1,495<br />
Hiroshima Bank (The) Ltd. 143,000 600<br />
Hisamitsu Pharmaceutical Co., Inc. 20,300 916<br />
Hitachi Chemical Co. Ltd. 31,000 421<br />
Hitachi Construction Machinery Co. Ltd. 33,800 650<br />
Hitachi High-Technologies Corp. 16,700 388<br />
Hitachi Ltd. 1,632,000 12,022<br />
Hitachi Metals Ltd. 65,000 923<br />
Hokkaido Electric Power Co., Inc.* 56,600 478<br />
Hokuhoku Financial Group, Inc. 338,000 648<br />
Hokuriku Electric Power Co. 52,600 684<br />
Honda Motor Co. Ltd. 554,400 19,493<br />
Hoya Corp. 147,800 4,621<br />
Hulic Co. Ltd. 91,500 1,250<br />
Ibiden Co. Ltd. 38,500 757<br />
Idemitsu Kosan Co. Ltd. 29,900 616<br />
IHI Corp. 455,000 1,910<br />
Iida Group Holdings Co. Ltd. 44,764 622<br />
Inpex Corp. 299,300 3,876<br />
Isetan Mitsukoshi Holdings Ltd. 130,660 1,625<br />
Isuzu Motors Ltd. 397,000 2,298<br />
ITOCHU Corp. 508,800 5,935<br />
Itochu Techno-Solutions Corp. 8,100 342<br />
Iyo Bank (The) Ltd. 91,500 873<br />
J Front Retailing Co. Ltd. 180,000 1,248<br />
Japan Airlines Co. Ltd. 20,300 998<br />
Japan Exchange Group, Inc. 86,200 2,099<br />
See Notes to the Financial Statements.<br />
NORTHERN FUNDS ANNUAL REPORT 63 EQUITY INDEX FUNDS
SCHEDULE OF INVESTMENTS<br />
INTERNATIONAL EQUITY INDEX FUND continued<br />
NUMBER<br />
OF SHARES<br />
continued<br />
VALUE<br />
(000S)<br />
COMMON STOCKS - 96.7%<br />
Japan - 19.1% continued<br />
Japan Petroleum Exploration Co. 9,400 $312<br />
Japan Prime Realty Investment Corp. 264 854<br />
Japan Real Estate Investment Corp. 390 1,956<br />
Japan Retail Fund Investment Corp. 768 1,511<br />
Japan Steel Works (The) Ltd. 87,000 390<br />
Japan Tobacco, Inc. 371,200 11,639<br />
JFE Holdings, Inc. 171,200 3,219<br />
JGC Corp. 71,000 2,467<br />
Joyo Bank (The) Ltd. 207,000 1,031<br />
JSR Corp. 60,600 1,121<br />
JTEKT Corp. 70,300 1,043<br />
JX Holdings, Inc. 777,697 3,739<br />
Kajima Corp. 285,000 998<br />
Kakaku.com, Inc. 47,100 764<br />
Kamigumi Co. Ltd. 75,000 732<br />
Kaneka Corp. 94,000 569<br />
Kansai Electric Power (The) Co., Inc.* 238,400 2,444<br />
Kansai Paint Co. Ltd. 80,000 1,142<br />
Kao Corp. 173,800 6,150<br />
Kawasaki Heavy Industries Ltd. 495,000 1,820<br />
KDDI Corp. 181,600 10,568<br />
Keikyu Corp. 168,000 1,415<br />
Keio Corp. 197,000 1,371<br />
Keisei Electric Railway Co. Ltd. 92,000 797<br />
Keyence Corp. 15,439 6,352<br />
Kikkoman Corp. 54,000 1,017<br />
Kinden Corp. 49,000 474<br />
Kintetsu Corp. 618,000 2,196<br />
Kirin Holdings Co. Ltd. 303,000 4,212<br />
Kobe Steel Ltd. 1,034,000 1,379<br />
Koito Manufacturing Co. Ltd. 38,814 656<br />
Komatsu Ltd. 315,800 6,531<br />
Konami Corp. 31,900 739<br />
Konica Minolta, Inc. 171,000 1,593<br />
Kubota Corp. 360,000 4,809<br />
Kuraray Co. Ltd. 117,600 1,343<br />
Kurita Water Industries Ltd. 32,200 698<br />
Kyocera Corp. 110,700 4,983<br />
Kyowa Hakko Kirin Co. Ltd. 74,000 788<br />
Kyushu Electric Power Co., Inc. 152,900 1,868<br />
Lawson, Inc. 22,600 1,597<br />
LIXIL Group Corp. 92,000 2,533<br />
M3, Inc. 44,000 721<br />
Mabuchi Motor Co. Ltd. 7,000 458<br />
NUMBER<br />
OF SHARES<br />
continued<br />
VALUE<br />
(000S)<br />
COMMON STOCKS - 96.7%<br />
Japan - 19.1% continued<br />
Makita Corp. 39,400 $2,175<br />
Marubeni Corp. 575,000 3,855<br />
Marui Group Co. Ltd. 76,000 656<br />
Maruichi Steel Tube Ltd. 15,200 392<br />
Mazda Motor Corp. 930,000 4,118<br />
McDonald’s Holdings Co. Japan Ltd. 20,400 548<br />
Medipal Holdings Corp. 44,400 678<br />
MEIJI Holdings Co. Ltd. 20,463 1,289<br />
Miraca Holdings, Inc. 18,041 789<br />
Mitsubishi Chemical Holdings Corp. 469,200 1,948<br />
Mitsubishi Corp. 474,000 8,790<br />
Mitsubishi Electric Corp. 655,000 7,354<br />
Mitsubishi Estate Co. Ltd. 424,000 10,090<br />
Mitsubishi Gas Chemical Co., Inc. 117,000 659<br />
Mitsubishi Heavy Industries Ltd. 1,026,000 5,972<br />
Mitsubishi Logistics Corp. 49,000 681<br />
Mitsubishi Materials Corp. 405,000 1,157<br />
Mitsubishi Motors Corp. 213,000 2,225<br />
Mitsubishi Tanabe Pharma Corp. 73,600 1,028<br />
Mitsubishi UFJ Financial Group, Inc. 4,332,695 23,768<br />
Mitsubishi UFJ Lease & Finance Co. Ltd. 205,300 1,004<br />
Mitsui & Co. Ltd. 586,600 8,278<br />
Mitsui Chemicals, Inc. 277,000 678<br />
Mitsui Fudosan Co. Ltd. 285,000 8,676<br />
Mitsui OSK Lines Ltd. 388,000 1,509<br />
Mizuho Financial Group, Inc. 7,759,589 15,310<br />
MS&AD Insurance Group Holdings 171,143 3,913<br />
Murata Manufacturing Co. Ltd. 68,697 6,465<br />
Nabtesco Corp. 36,999 855<br />
Namco Bandai Holdings, Inc. 65,500 1,547<br />
NEC Corp. 826,000 2,533<br />
Nexon Co. Ltd. 29,700 250<br />
NGK Insulators Ltd. 86,000 1,788<br />
NGK Spark Plug Co. Ltd. 57,000 1,278<br />
NHK Spring Co. Ltd. 48,000 444<br />
Nidec Corp. 68,600 4,165<br />
Nikon Corp. 117,200 1,884<br />
Nintendo Co. Ltd. 35,800 4,264<br />
Nippon Building Fund, Inc. 468 2,442<br />
Nippon Electric Glass Co. Ltd. 104,500 537<br />
Nippon Express Co. Ltd. 273,000 1,334<br />
Nippon Meat Packers, Inc. 59,000 881<br />
Nippon Paint Co. Ltd. 58,000 877<br />
Nippon Prologis REIT, Inc. 341 687<br />
See Notes to the Financial Statements.<br />
EQUITY INDEX FUNDS 64 NORTHERN FUNDS ANNUAL REPORT
MARCH 31, 2014<br />
NUMBER<br />
OF SHARES<br />
continued<br />
VALUE<br />
(000S)<br />
COMMON STOCKS - 96.7%<br />
Japan - 19.1% continued<br />
Nippon Steel & Sumitomo Metal Corp. 2,571,615 $7,012<br />
Nippon Telegraph & Telephone Corp. 126,678 6,886<br />
Nippon Yusen K.K. 552,000 1,612<br />
Nishi-Nippon City Bank (The) Ltd. 204,000 458<br />
Nissan Motor Co. Ltd. 837,400 7,453<br />
Nisshin Seifun Group, Inc. 68,650 754<br />
Nissin Foods Holdings Co. Ltd. 19,100 860<br />
Nitori Holdings Co. Ltd. 23,500 1,018<br />
Nitto Denko Corp. 56,100 2,702<br />
NKSJ Holdings, Inc. 112,445 2,885<br />
NOK Corp. 30,500 498<br />
Nomura Holdings, Inc. 1,222,600 7,829<br />
Nomura Real Estate Holdings, Inc. 42,500 810<br />
Nomura Research Institute Ltd. 34,800 1,097<br />
NSK Ltd. 160,000 1,643<br />
NTT Data Corp. 43,200 1,677<br />
NTT DOCOMO, Inc. 515,500 8,119<br />
NTT Urban Development Corp. 36,900 347<br />
Obayashi Corp. 218,000 1,227<br />
Odakyu Electric Railway Co. Ltd. 214,000 1,851<br />
Oji Holdings Corp. 273,000 1,220<br />
Olympus Corp.* 81,300 2,619<br />
Omron Corp. 69,400 2,856<br />
Ono Pharmaceutical Co. Ltd. 27,600 2,402<br />
Oracle Corp. Japan 12,100 547<br />
Oriental Land Co. Ltd. 17,600 2,674<br />
ORIX Corp. 442,800 6,219<br />
Osaka Gas Co. Ltd. 634,000 2,399<br />
Otsuka Corp. 5,300 692<br />
Otsuka Holdings Co. Ltd. 123,215 3,679<br />
Panasonic Corp. 746,100 8,512<br />
Park24 Co. Ltd. 29,300 556<br />
Rakuten, Inc. 246,000 3,276<br />
Resona Holdings, Inc. 757,710 3,657<br />
Ricoh Co. Ltd. 227,000 2,630<br />
Rinnai Corp. 10,600 930<br />
Rohm Co. Ltd. 32,900 1,465<br />
Sankyo Co. Ltd. 17,800 748<br />
Sanrio Co. Ltd. 16,597 559<br />
Santen Pharmaceutical Co. Ltd. 24,700 1,094<br />
SBI Holdings, Inc. 68,960 829<br />
Secom Co. Ltd. 72,100 4,149<br />
Sega Sammy Holdings, Inc. 66,200 1,480<br />
Seiko Epson Corp. 44,200 1,383<br />
NUMBER<br />
OF SHARES<br />
continued<br />
VALUE<br />
(000S)<br />
COMMON STOCKS - 96.7%<br />
Japan - 19.1% continued<br />
Sekisui Chemical Co. Ltd. 148,000 $1,536<br />
Sekisui House Ltd. 189,300 2,345<br />
Seven & I Holdings Co. Ltd. 255,100 9,730<br />
Seven Bank Ltd. 209,200 819<br />
Sharp Corp.* 521,000 1,582<br />
Shikoku Electric Power Co., Inc.* 61,200 829<br />
Shimadzu Corp. 79,000 701<br />
Shimamura Co. Ltd. 7,600 657<br />
Shimano, Inc. 26,500 2,661<br />
Shimizu Corp. 199,000 1,029<br />
Shin-Etsu Chemical Co. Ltd. 138,400 7,899<br />
Shinsei Bank Ltd. 617,000 1,211<br />
Shionogi & Co. Ltd. 104,300 1,930<br />
Shiseido Co. Ltd. 124,800 2,193<br />
Shizuoka Bank (The) Ltd. 205,000 1,998<br />
Showa Denko K.K. 447,000 632<br />
Showa Shell Sekiyu K.K. 56,500 504<br />
SMC Corp. 17,800 4,684<br />
SoftBank Corp. 324,900 24,504<br />
Sojitz Corp. 390,600 665<br />
Sony Corp. 352,500 6,720<br />
Sony Financial Holdings, Inc. 61,100 999<br />
Stanley Electric Co. Ltd. 49,300 1,092<br />
Sumco Corp. 30,400 236<br />
Sumitomo Chemical Co. Ltd. 512,000 1,886<br />
Sumitomo Corp. 383,000 4,868<br />
Sumitomo Electric Industries Ltd. 261,600 3,887<br />
Sumitomo Heavy Industries Ltd. 187,000 763<br />
Sumitomo Metal Mining Co. Ltd. 171,000 2,143<br />
Sumitomo Mitsui Financial Group, Inc. 432,942 18,455<br />
Sumitomo Mitsui Trust Holdings, Inc. 1,122,190 5,060<br />
Sumitomo Realty & Development Co. Ltd. 120,000 4,690<br />
Sumitomo Rubber Industries Ltd. 59,300 757<br />
Suntory Beverage & Food Ltd. 46,600 1,604<br />
Suruga Bank Ltd. 61,000 1,072<br />
Suzuken Co. Ltd. 23,297 900<br />
Suzuki Motor Corp. 123,800 3,225<br />
Sysmex Corp. 53,298 1,710<br />
T&D Holdings, Inc. 196,200 2,329<br />
Taiheiyo Cement Corp. 428,000 1,540<br />
Taisei Corp. 326,000 1,453<br />
Taisho Pharmaceutical Holdings Co. Ltd. 10,300 833<br />
Taiyo Nippon Sanso Corp. 82,000 644<br />
Takashimaya Co. Ltd. 83,000 777<br />
See Notes to the Financial Statements.<br />
NORTHERN FUNDS ANNUAL REPORT 65 EQUITY INDEX FUNDS
SCHEDULE OF INVESTMENTS<br />
INTERNATIONAL EQUITY INDEX FUND continued<br />
NUMBER<br />
OF SHARES<br />
continued<br />
VALUE<br />
(000S)<br />
COMMON STOCKS - 96.7%<br />
Japan - 19.1% continued<br />
Takeda Pharmaceutical Co. Ltd. 268,200 $12,697<br />
TDK Corp. 41,700 1,738<br />
Teijin Ltd. 322,000 797<br />
Terumo Corp. 102,200 2,228<br />
THK Co. Ltd. 38,600 865<br />
Tobu Railway Co. Ltd. 366,000 1,768<br />
Toho Co. Ltd. 33,200 669<br />
Toho Gas Co. Ltd. 125,000 680<br />
Tohoku Electric Power Co., Inc. 155,200 1,596<br />
Tokio Marine Holdings, Inc. 234,200 7,021<br />
Tokyo Electric Power Co., Inc.* 489,400 1,979<br />
Tokyo Electron Ltd. 58,100 3,567<br />
Tokyo Gas Co. Ltd. 807,000 4,092<br />
Tokyo Tatemono Co. Ltd. 149,000 1,275<br />
Tokyu Corp. 386,000 2,372<br />
Tokyu Fudosan Holdings Corp. 175,400 1,306<br />
TonenGeneral Sekiyu K.K. 86,000 758<br />
Toppan Printing Co. Ltd. 200,000 1,430<br />
Toray Industries, Inc. 493,000 3,254<br />
Toshiba Corp. 1,360,000 5,748<br />
TOTO Ltd. 92,000 1,273<br />
Toyo Seikan Group Holdings Ltd. 55,700 903<br />
Toyo Suisan Kaisha Ltd. 33,000 1,100<br />
Toyoda Gosei Co. Ltd. 22,400 429<br />
Toyota Boshoku Corp. 14,400 146<br />
Toyota Industries Corp. 55,600 2,666<br />
Toyota Motor Corp. 936,700 52,716<br />
Toyota Tsusho Corp. 72,900 1,848<br />
Trend Micro, Inc. 38,100 1,178<br />
Tsumura & Co. 19,400 467<br />
Ube Industries Ltd. 360,000 661<br />
Unicharm Corp. 37,400 2,002<br />
United Urban Investment Corp. 864 1,268<br />
USS Co. Ltd. 67,900 952<br />
West Japan Railway Co. 57,900 2,360<br />
Yahoo Japan Corp. 502,900 2,461<br />
Yakult Honsha Co. Ltd. 29,700 1,489<br />
Yamada Denki Co. Ltd. 313,290 1,043<br />
Yamaguchi Financial Group, Inc. 64,000 575<br />
Yamaha Corp. 52,600 676<br />
Yamaha Motor Co. Ltd. 95,200 1,514<br />
Yamato Holdings Co. Ltd. 121,200 2,609<br />
Yamato Kogyo Co. Ltd. 13,400 419<br />
Yamazaki Baking Co. Ltd. 34,905 413<br />
NUMBER<br />
OF SHARES<br />
continued<br />
VALUE<br />
(000S)<br />
COMMON STOCKS - 96.7%<br />
Japan - 19.1% continued<br />
Yaskawa Electric Corp. 73,000 $1,007<br />
Yokogawa Electric Corp. 73,000 1,177<br />
Yokohama Rubber (The) Co. Ltd. 71,000 666<br />
880,659<br />
Netherlands - 2.8%<br />
Aegon N.V. 604,373 5,559<br />
Akzo Nobel N.V. 80,865 6,626<br />
ASML Holding N.V. 120,969 11,199<br />
CNH Industrial N.V.* 320,496 3,693<br />
Corio N.V. 22,969 1,050<br />
Delta Lloyd N.V. 65,632 1,822<br />
FugroN.V.-CVA 23,618 1,454<br />
Gemalto N.V. 24,660 2,872<br />
Gemalto N.V. 2,196 256<br />
Heineken Holding N.V. 35,784 2,311<br />
Heineken N.V. 77,460 5,398<br />
ING Groep N.V. - CVA* 1,295,599 18,414<br />
Koninklijke Ahold N.V. 313,195 6,296<br />
Koninklijke Boskalis Westminster N.V. 26,095 1,439<br />
Koninklijke DSM N.V. 53,673 3,686<br />
Koninklijke KPN N.V.* 1,082,493 3,831<br />
Koninklijke Philips N.V. 318,516 11,205<br />
Koninklijke Vopak N.V. 23,385 1,307<br />
OCI N.V.* 32,159 1,460<br />
QIAGEN N.V.* 85,968 1,803<br />
Randstad Holding N.V. 42,801 2,512<br />
Reed Elsevier N.V. 237,542 5,140<br />
TNT Express N.V. 146,857 1,446<br />
Unilever N.V. - CVA 553,545 22,760<br />
Wolters Kluwer N.V. 102,892 2,906<br />
Ziggo N.V. 52,674 2,341<br />
128,786<br />
New Zealand - 0.1%<br />
Auckland International Airport Ltd. 354,087 1,171<br />
Contact Energy Ltd. 121,618 561<br />
Fletcher Building Ltd. 234,298 1,939<br />
Ryman Healthcare Ltd. 122,990 937<br />
Telecom Corp. of New Zealand Ltd. 622,314 1,318<br />
5,926<br />
Norway - 0.8%<br />
Aker Solutions ASA 55,248 860<br />
DNB ASA 329,646 5,737<br />
Gjensidige Forsikring ASA 68,231 1,388<br />
See Notes to the Financial Statements.<br />
EQUITY INDEX FUNDS 66 NORTHERN FUNDS ANNUAL REPORT
MARCH 31, 2014<br />
NUMBER<br />
OF SHARES<br />
continued<br />
VALUE<br />
(000S)<br />
COMMON STOCKS - 96.7%<br />
Norway - 0.8% continued<br />
Norsk Hydro ASA 454,630 $2,271<br />
Orkla ASA 274,637 2,341<br />
Seadrill Ltd. 125,952 4,446<br />
Statoil ASA 378,525 10,691<br />
Telenor ASA 230,506 5,108<br />
Yara International ASA 63,161 2,790<br />
35,632<br />
Portugal - 0.2%<br />
Banco Espirito Santo S.A. (Registered)* 573,165 1,076<br />
EDP - Energias de Portugal S.A. 684,077 3,181<br />
Galp Energia SGPS S.A. 122,313 2,115<br />
Jeronimo Martins SGPS S.A. 90,795 1,525<br />
Portugal Telecom SGPS S.A. (Registered) 218,213 930<br />
8,827<br />
Singapore - 1.4%<br />
Ascendas Real Estate Investment Trust 665,879 1,196<br />
CapitaCommercial Trust 641,000 758<br />
CapitaLand Ltd. 888,750 2,046<br />
CapitaMall Trust 898,800 1,350<br />
CapitaMalls Asia Ltd. 436,658 621<br />
City Developments Ltd. 132,000 1,062<br />
ComfortDelGro Corp. Ltd. 656,000 1,036<br />
DBS Group Holdings Ltd. 581,626 7,488<br />
Genting Singapore PLC 2,089,380 2,222<br />
Global Logistic Properties Ltd. 1,051,939 2,215<br />
Golden Agri-Resources Ltd. 2,317,892 1,061<br />
Hutchison Port Holdings Trust, Class U 1,956,000 1,273<br />
Jardine Cycle & Carriage Ltd. 35,446 1,281<br />
Keppel Corp. Ltd. 496,550 4,296<br />
Keppel Land Ltd. 218,473 585<br />
Olam International Ltd. 433,479 767<br />
Oversea-Chinese Banking Corp. Ltd. 874,944 6,615<br />
Sembcorp Industries Ltd. 321,644 1,406<br />
Sembcorp Marine Ltd. 268,800 865<br />
Singapore Airlines Ltd. 195,734 1,632<br />
Singapore Exchange Ltd. 288,000 1,588<br />
Singapore Press Holdings Ltd. 525,295 1,753<br />
Singapore Technologies Engineering Ltd. 555,000 1,688<br />
Singapore Telecommunications Ltd. 2,716,925 7,900<br />
StarHub Ltd. 189,000 632<br />
United Overseas Bank Ltd. 435,875 7,519<br />
UOL Group Ltd. 146,739 730<br />
NUMBER<br />
OF SHARES<br />
continued<br />
VALUE<br />
(000S)<br />
COMMON STOCKS - 96.7%<br />
Singapore - 1.4% continued<br />
Wilmar International Ltd. 683,000 $1,881<br />
63,466<br />
Spain - 3.4%<br />
Abertis Infraestructuras S.A. 130,514 2,983<br />
ACS Actividades de Construccion y<br />
Servicios S.A. 60,878 2,395<br />
Amadeus IT Holding S.A., Class A 129,873 5,400<br />
Banco Bilbao Vizcaya Argentaria S.A. 1,955,772 23,532<br />
Banco de Sabadell S.A. 1,175,154 3,635<br />
Banco Popular Espanol S.A. 562,813 4,259<br />
Banco Santander S.A. 3,923,879 37,470<br />
Bankia S.A.* 1,378,423 2,915<br />
CaixaBank S.A. 605,291 3,899<br />
Distribuidora Internacional de<br />
Alimentacion S.A. 202,358 1,852<br />
Enagas S.A. 65,102 1,981<br />
Ferrovial S.A. 139,773 3,036<br />
Gas Natural SDG S.A. 118,168 3,327<br />
Grifols S.A. 47,637 2,615<br />
Grifols S.A., Class B 4,066 168<br />
Iberdrola S.A. 1,620,963 11,347<br />
Inditex S.A. 73,614 11,065<br />
Mapfre S.A. 344,384 1,454<br />
Red Electrica Corp. S.A. 36,614 2,979<br />
Repsol S.A. 292,990 7,487<br />
Telefonica S.A. 1,383,287 21,903<br />
Zardoya Otis S.A. 64,189 1,095<br />
156,797<br />
Sweden - 3.2%<br />
Alfa Laval AB 109,423 2,970<br />
Assa Abloy AB, Class B 112,212 5,993<br />
Atlas Copco AB, Class A 225,723 6,533<br />
Atlas Copco AB, Class B 131,045 3,593<br />
Boliden AB 86,712 1,318<br />
Electrolux AB, Class B 85,800 1,873<br />
Elekta AB, Class B 134,040 1,786<br />
Getinge AB, Class B 68,854 1,941<br />
Hennes & Mauritz AB, Class B 320,369 13,653<br />
Hexagon AB, Class B 82,539 2,810<br />
Husqvarna AB, Class B 138,180 965<br />
Industrivarden AB, Class C 39,114 759<br />
Investment AB Kinnevik, Class B 74,951 2,771<br />
Investor AB, Class B 153,471 5,560<br />
Lundin Petroleum AB* 81,068 1,666<br />
See Notes to the Financial Statements.<br />
NORTHERN FUNDS ANNUAL REPORT 67 EQUITY INDEX FUNDS
SCHEDULE OF INVESTMENTS<br />
INTERNATIONAL EQUITY INDEX FUND continued<br />
NUMBER<br />
OF SHARES<br />
continued<br />
VALUE<br />
(000S)<br />
COMMON STOCKS - 96.7%<br />
Sweden - 3.2% continued<br />
Millicom International Cellular S.A. SDR 23,025 $2,344<br />
Nordea Bank AB 1,024,054 14,544<br />
Sandvik AB 362,229 5,132<br />
Scania AB, Class B 109,130 3,210<br />
Securitas AB, Class B 107,187 1,244<br />
Skandinaviska Enskilda Banken AB,<br />
Class A 511,039 7,011<br />
Skanska AB, Class B 131,178 3,094<br />
SKF AB, Class B 135,512 3,474<br />
Svenska Cellulosa AB S.C.A., Class B 197,944 5,828<br />
Svenska Handelsbanken AB, Class A 168,132 8,450<br />
Swedbank AB, Class A 305,353 8,189<br />
Swedish Match AB 70,953 2,318<br />
Tele2 AB, Class B 108,733 1,348<br />
Telefonaktiebolaget LM Ericsson, Class B 1,029,416 13,715<br />
TeliaSonera AB 802,850 6,060<br />
Volvo AB, Class B 511,912 8,123<br />
148,275<br />
Switzerland - 9.7%<br />
ABB Ltd. (Registered)* 744,465 19,276<br />
Actelion Ltd. (Registered)* 35,303 3,347<br />
Adecco S.A. (Registered)* 45,334 3,781<br />
Aryzta A.G.* 26,500 2,343<br />
Aryzta A.G. (Aquis Exchange)* 4,637 409<br />
Baloise Holding A.G. (Registered) 16,674 2,097<br />
Barry Callebaut A.G. (Registered)* 714 963<br />
Cie Financiere Richemont S.A. (Registered) 176,688 16,918<br />
Coca-Cola HBC A.G. - CDI 12,024 300<br />
Coca-Cola HBC A.G. ADR 54,938 1,366<br />
Credit Suisse Group A.G. (Registered)* 511,984 16,579<br />
EMS-Chemie Holding A.G. (Registered) 2,667 1,011<br />
Geberit A.G. (Registered) 12,815 4,202<br />
Givaudan S.A. (Registered)* 3,124 4,837<br />
Glencore Xstrata PLC 3,587,563 18,505<br />
Holcim Ltd. (Registered)* 77,576 6,442<br />
Julius Baer Group Ltd.* 75,742 3,367<br />
Kuehne + Nagel International<br />
A.G. (Registered) 18,698 2,619<br />
Lindt & Spruengli A.G. (Registered) 33 1,943<br />
Lindt & Spruengli A.G.<br />
(Participation Certificate) 282 1,398<br />
Lonza Group A.G. (Registered)* 17,696 1,810<br />
Nestle S.A. (Registered) 1,094,490 82,469<br />
Novartis A.G. (Registered) 780,492 66,291<br />
Pargesa Holding S.A. (Bearer) 9,032 782<br />
NUMBER<br />
OF SHARES<br />
continued<br />
VALUE<br />
(000S)<br />
COMMON STOCKS - 96.7%<br />
Switzerland - 9.7% continued<br />
Partners Group Holding A.G. 5,896 $1,658<br />
Roche Holding A.G. (Genusschein) 238,437 71,671<br />
Schindler Holding A.G. (Registered) 7,950 1,168<br />
Schindler Holding A.G.<br />
(Participation Certificate) 15,528 2,294<br />
SGS S.A. (Registered) 1,891 4,671<br />
Sika A.G. (Bearer) 736 3,013<br />
Sonova Holding A.G. (Registered)* 17,597 2,574<br />
STMicroelectronics N.V. 217,926 2,018<br />
Sulzer A.G. (Registered) 7,936 1,092<br />
Swatch Group (The) A.G. (Bearer) 10,420 6,549<br />
Swatch Group (The) A.G. (Registered) 14,745 1,712<br />
Swiss Life Holding A.G. (Registered)* 11,105 2,729<br />
Swiss Prime Site A.G. (Registered)* 17,943 1,526<br />
Swiss Re A.G.* 119,123 11,053<br />
Swisscom A.G. (Registered) 7,988 4,905<br />
Syngenta A.G. (Registered) 31,515 11,954<br />
Transocean Ltd. 121,894 5,030<br />
UBS A.G. (Registered)* 1,240,194 25,605<br />
Wolseley PLC 90,738 5,174<br />
Zurich Insurance Group A.G.* 50,321 15,464<br />
444,915<br />
United Kingdom - 20.0%<br />
3i Group PLC 337,241 2,240<br />
Aberdeen Asset Management PLC 323,721 2,111<br />
Admiral Group PLC 65,986 1,572<br />
Aggreko PLC 93,318 2,340<br />
AMEC PLC 103,535 1,938<br />
Anglo American PLC 471,766 12,032<br />
Antofagasta PLC 134,018 1,870<br />
ARM Holdings PLC 474,078 7,994<br />
ASOS PLC* 18,333 1,587<br />
Associated British Foods PLC 120,224 5,575<br />
AstraZeneca PLC 426,057 27,606<br />
Aviva PLC 993,606 7,914<br />
Babcock International Group PLC 123,584 2,778<br />
BAE Systems PLC 1,086,830 7,550<br />
Barclays PLC 5,166,658 20,153<br />
BG Group PLC 1,156,843 21,575<br />
BHP Billiton PLC 713,867 22,035<br />
BP PLC 6,332,280 50,711<br />
British American Tobacco PLC 641,827 35,733<br />
British Land Co. PLC 319,478 3,487<br />
British Sky Broadcasting Group PLC 351,372 5,355<br />
See Notes to the Financial Statements.<br />
EQUITY INDEX FUNDS 68 NORTHERN FUNDS ANNUAL REPORT
MARCH 31, 2014<br />
NUMBER<br />
OF SHARES<br />
COMMON STOCKS - 96.7% continued<br />
United Kingdom - 20.0% continued<br />
VALUE<br />
(000S)<br />
BT Group PLC 2,672,859 $17,011<br />
Bunzl PLC 113,975 3,038<br />
Burberry Group PLC 149,775 3,491<br />
Capita PLC 222,595 4,074<br />
Carnival Corp. 2,945 111<br />
Centrica PLC 1,737,673 9,569<br />
Cobham PLC 387,281 1,934<br />
Compass Group PLC 607,732 9,289<br />
Croda International PLC 48,164 2,051<br />
Diageo PLC 851,707 26,434<br />
Direct Line Insurance Group PLC 384,788 1,525<br />
easyJet PLC 53,613 1,535<br />
Experian PLC 339,941 6,132<br />
Fresnillo PLC 62,609 881<br />
G4S PLC 506,854 2,044<br />
GKN PLC 551,274 3,589<br />
GlaxoSmithKline PLC 1,650,279 43,963<br />
Hammerson PLC 252,494 2,334<br />
Hargreaves Lansdown PLC 72,889 1,773<br />
HSBC Holdings PLC 6,366,103 64,458<br />
ICAP PLC 187,609 1,183<br />
IMI PLC 93,541 2,276<br />
Imperial Tobacco Group PLC 327,226 13,233<br />
Inmarsat PLC 160,059 1,940<br />
InterContinental Hotels Group PLC 91,615 2,949<br />
International Consolidated Airlines<br />
Group S.A.* 352,136 2,457<br />
Intertek Group PLC 54,850 2,815<br />
Intu Properties PLC 223,135 1,051<br />
Investec PLC 199,361 1,614<br />
ITV PLC 1,271,202 4,066<br />
J Sainsbury PLC 419,440 2,213<br />
Johnson Matthey PLC 69,273 3,781<br />
Kingfisher PLC 802,544 5,650<br />
Land Securities Group PLC 264,898 4,514<br />
Legal & General Group PLC 1,993,456 6,813<br />
Lloyds Banking Group PLC* 16,882,929 21,191<br />
London Stock Exchange Group PLC 59,730 1,964<br />
Marks & Spencer Group PLC 545,226 4,108<br />
Meggitt PLC 279,475 2,240<br />
Melrose Industries PLC 375,469 1,861<br />
National Grid PLC 1,258,348 17,282<br />
Next PLC 52,887 5,831<br />
Old Mutual PLC 1,648,579 5,535<br />
Pearson PLC 278,241 4,934<br />
NUMBER<br />
OF SHARES<br />
COMMON STOCKS - 96.7% continued<br />
United Kingdom - 20.0% continued<br />
VALUE<br />
(000S)<br />
Persimmon PLC* 106,935 $2,400<br />
Petrofac Ltd. 87,797 2,111<br />
Prudential PLC 863,762 18,298<br />
Randgold Resources Ltd. 30,685 2,301<br />
Reckitt Benckiser Group PLC 218,549 17,811<br />
Reed Elsevier PLC 401,959 6,147<br />
Resolution Ltd. 486,846 2,427<br />
Rexam PLC 277,435 2,255<br />
Rio Tinto PLC 429,838 23,972<br />
Rolls-Royce Holdings PLC* 637,825 11,442<br />
Royal Bank of Scotland Group PLC* 730,267 3,794<br />
Royal Dutch Shell PLC, Class A 1,310,826 47,915<br />
Royal Dutch Shell PLC, Class A<br />
(LSE European Quoting Service) 272 10<br />
Royal Dutch Shell PLC, Class B 842,238 32,859<br />
Royal Mail PLC* 220,354 2,070<br />
RSA Insurance Group PLC 1,261,018 1,882<br />
SABMiller PLC 324,963 16,231<br />
Sage Group (The) PLC 370,786 2,584<br />
Schroders PLC 35,074 1,521<br />
Segro PLC 246,344 1,365<br />
Serco Group PLC 168,126 1,180<br />
Severn Trent PLC 83,739 2,545<br />
Shire PLC 199,124 9,798<br />
Smith & Nephew PLC 300,912 4,559<br />
Smiths Group PLC 133,347 2,831<br />
SSE PLC 332,033 8,141<br />
Standard Chartered PLC 818,951 17,128<br />
Standard Life PLC 810,803 5,109<br />
Subsea 7 S.A. 94,370 1,754<br />
Tate & Lyle PLC 166,228 1,852<br />
Tesco PLC 2,728,589 13,448<br />
Travis Perkins PLC 83,880 2,644<br />
TUITravelPLC 148,975 1,089<br />
Tullow Oil PLC 307,076 3,836<br />
Unilever PLC 433,503 18,515<br />
United Utilities Group PLC 236,730 3,113<br />
Vodafone Group PLC 8,977,836 33,052<br />
Weir Group (The) PLC 74,009 3,134<br />
Whitbread PLC 61,000 4,232<br />
William Hill PLC 305,955 1,741<br />
WM Morrison Supermarkets PLC 749,383 2,664<br />
WPP PLC 452,597 9,363<br />
922,016<br />
See Notes to the Financial Statements.<br />
NORTHERN FUNDS ANNUAL REPORT 69 EQUITY INDEX FUNDS
SCHEDULE OF INVESTMENTS<br />
INTERNATIONAL EQUITY INDEX FUND continued<br />
NUMBER<br />
OF SHARES<br />
continued<br />
VALUE<br />
(000S)<br />
COMMON STOCKS - 96.7%<br />
United States - 0.1%<br />
Carnival PLC 60,504 $2,309<br />
Total Common Stocks (2)<br />
(Cost $3,696,099) 4,455,139<br />
PREFERRED STOCKS - 0.6%<br />
Germany - 0.6%<br />
Bayerische Motoren Werke A.G. 18,807 1,778<br />
Fuchs Petrolub S.E. 12,125 1,216<br />
Henkel A.G. & Co. KGaA 60,758 6,539<br />
Porsche Automobil Holding S.E. 51,980 5,338<br />
Volkswagen A.G. 48,877 12,664<br />
27,535<br />
Total Preferred Stocks (2)<br />
(Cost $18,196) 27,535<br />
RIGHTS - 0.0%<br />
Austria - 0.0%<br />
Immoeast A.G. (1) * 63,165 —<br />
Immoeast A.G. (1) * 62,543 —<br />
—<br />
Hong Kong - 0.0%<br />
New World Development Co. Ltd.* 426,262 88<br />
Spain - 0.0%<br />
Banco Bilbao Vizcaya Argentaria S.A.* 1,955,772 458<br />
United Kingdom - 0.0%<br />
Intu Properties PLC* 63,752 101<br />
RSA Insurance Group PLC* 472,881 264<br />
365<br />
Total Rights (2)<br />
(Cost $834) 911<br />
(1)<br />
(2)<br />
(3)<br />
(4)<br />
*<br />
NUMBER<br />
OF SHARES<br />
VALUE<br />
(000S)<br />
INVESTMENT COMPANIES - 1.6%<br />
iShares MSCI EAFE ETF 496,875 $33,375<br />
<strong>Northern</strong> Institutional <strong>Funds</strong> -<br />
Diversified Assets Portfolio, 0.01% (3) (4) 39,660,683 39,661<br />
Total Investment Companies<br />
(Cost $71,705) 73,036<br />
Total Investments - 98.9%<br />
(Cost $3,786,834) 4,556,621<br />
Other Assets less Liabilities - 1.1% 52,340<br />
NET ASSETS - 100.0% $4,608,961<br />
Level 3 asset that is worthless, bankrupt or has been delisted.<br />
In accordance with the Fund’s prospectus, adjustment factors were provided<br />
by an independent evaluation service to determine the value of certain<br />
foreign securities.<br />
At March 31, 2013, the value of the Fund’s investment in the Diversified Assets<br />
Portfolio of the <strong>Northern</strong> Institutional <strong>Funds</strong> was approximately $45,426,000<br />
with net sales of approximately $5,765,000 during the fiscal year<br />
ended March 31, 2014.<br />
Investment in affiliated Portfolio. <strong>Northern</strong> Trust Investments, Inc. is the<br />
investment adviser to the Fund and the investment adviser to the <strong>Northern</strong><br />
Institutional <strong>Funds</strong>.<br />
Non-Income Producing Security<br />
Percentages shown are based on Net Assets. The classifications shown on the<br />
Schedule of Investments and in the tables herein are unaudited.<br />
At March 31, 2014, the Fund had open futures contracts as follows:<br />
TYPE<br />
NUMBER OF<br />
CONTRACTS<br />
NOTIONAL<br />
AMOUNT<br />
(000S)<br />
CONTRACT<br />
POSITION<br />
CONTRACT<br />
EXP.<br />
UNREALIZED<br />
GAINS (LOSSES)<br />
(000S)<br />
Euro Stoxx<br />
50<br />
(Euro) 863 $36,856 Long 6/14 $1,758<br />
FTSE 100<br />
<strong>Index</strong><br />
(British<br />
Pound) 212 23,127 Long 6/14 221<br />
Hang Seng<br />
<strong>Index</strong><br />
(Hong Kong<br />
Dollar) 13 1,855 Long 4/14 45<br />
SPI 200<br />
<strong>Index</strong><br />
(Australian<br />
Dollar) 69 8,628 Long 6/14 86<br />
Topix <strong>Index</strong><br />
(Japanese<br />
Yen) 110 12,821 Long 6/14 (82)<br />
See Notes to the Financial Statements.<br />
EQUITY INDEX FUNDS 70 NORTHERN FUNDS ANNUAL REPORT
MARCH 31, 2014<br />
TYPE<br />
NUMBER OF<br />
CONTRACTS<br />
NOTIONAL<br />
AMOUNT<br />
(000S)<br />
CONTRACT<br />
POSITION<br />
CONTRACT<br />
EXP.<br />
UNREALIZED<br />
GAINS (LOSSES)<br />
(000S)<br />
Yen<br />
Denominated<br />
Nikkei 225<br />
(Japanese<br />
Yen) 87 $6,244 Long 6/14 $(146)<br />
Total $1,882<br />
At March 31, 2014, the Fund’s investments were denominated in the following<br />
currencies (unaudited):<br />
% OF LONG-TERM<br />
CONCENTRATION BY CURRENCY<br />
INVESTMENTS<br />
Euro 31.5%<br />
British Pound 20.9<br />
Japanese Yen 19.5<br />
Swiss Franc 9.2<br />
Australian Dollar 7.8<br />
All other currencies less than 5% 11.1<br />
Total 100.0%<br />
COUNTERPARTY<br />
CONTRACTS<br />
TO<br />
DELIVER<br />
CURRENCY<br />
AMOUNT<br />
(LOCAL<br />
CURRENCY)<br />
(000S)<br />
UBS Japanese Yen 30,448<br />
Goldman Sachs Swiss Franc 1,049<br />
Morgan Stanley<br />
Citibank<br />
Goldman Sachs<br />
Citibank<br />
UBS<br />
Morgan Stanley<br />
Morgan Stanley<br />
United States<br />
Dollar 870<br />
IN<br />
EXCHANGE<br />
FOR<br />
CURRENCY<br />
AMOUNT<br />
(LOCAL<br />
CURRENCY)<br />
(000S)<br />
SETTLEMENT<br />
DATE<br />
UNREALIZED<br />
GAINS<br />
(LOSSES)<br />
(000S)<br />
United States<br />
Dollar 300 6/18/14 $5<br />
United States<br />
Dollar 1,200 6/18/14 13<br />
Australian<br />
Dollar 963 6/18/14 18<br />
United States<br />
Dollar 10,244 British Pound 6,160 6/18/14 20<br />
United States<br />
Dollar 18,333 Euro 13,164 6/18/14 (200)<br />
United States<br />
Dollar 12,288 Japanese Yen 1,248,579 6/18/14 (186)<br />
United States<br />
Dollar 700<br />
Singapore<br />
Dollar 886 6/18/14 5<br />
United States<br />
Dollar 850 Swiss Franc 753 6/18/14 2<br />
United States<br />
Dollar 4,735 Swiss Franc 4,127 6/18/14 (63)<br />
Total $(368)<br />
At March 31, 2014, the industry sectors (unaudited) for the Fund were:<br />
*<br />
Amount rounds to less than one thousand.<br />
% OF LONG-TERM<br />
INDUSTRY SECTOR<br />
INVESTMENTS<br />
Consumer Discretionary 11.6%<br />
Consumer Staples 10.9<br />
Energy 6.9<br />
Financials 26.1<br />
Health Care 10.4<br />
Industrials 12.9<br />
Information Technology 4.5<br />
Materials 8.1<br />
Telecommunication Services 4.9<br />
Utilities 3.7<br />
Total 100.0%<br />
At March 31, 2014, the Fund had outstanding forward foreign currency<br />
exchange contracts as follows:<br />
COUNTERPARTY<br />
CONTRACTS<br />
TO<br />
DELIVER<br />
CURRENCY<br />
AMOUNT<br />
(LOCAL<br />
CURRENCY)<br />
(000S)<br />
Citibank Australian Dollar 1,106<br />
Citibank British Pound 271<br />
Citibank British Pound 666<br />
Morgan Stanley Euro 1,815<br />
Morgan Stanley Japanese Yen 484,951<br />
IN<br />
EXCHANGE<br />
FOR<br />
CURRENCY<br />
AMOUNT<br />
(LOCAL<br />
CURRENCY)<br />
(000S)<br />
SETTLEMENT<br />
DATE<br />
UNREALIZED<br />
GAINS<br />
(LOSSES)<br />
(000S)<br />
United States<br />
Dollar 1,000 6/18/14 $(20)<br />
United States<br />
Dollar 450 6/18/14 (1)<br />
United States<br />
Dollar 1,100 6/18/14 (10)<br />
United States<br />
Dollar 2,500 6/18/14 —*<br />
United States<br />
Dollar 4,750 6/18/14 49<br />
Various inputs are used in determining the value of the Fund’s investments. These<br />
inputs are summarized in the three levels listed below:<br />
Level 1 - Unadjusted quoted market prices in active markets for identical securities<br />
on the measurement date.<br />
Level 2 - Other observable inputs (e.g., quoted prices in active markets for similar<br />
securities, securities valuations based on commonly quoted benchmark interest<br />
rates and yield curves, maturities, ratings, and/or securities indices). The Fund<br />
adjusted the price of certain foreign equity securities held in its portfolio on<br />
March 31, 2014 using adjustment factors designed to reflect more accurately the<br />
fair value of the securities. See Note 2 for a discussion of this procedure. The fair<br />
valuation of these securities resulted in their categorization as Level 2 investments.<br />
Level 3 - Significant unobservable inputs (e.g., information about assumptions<br />
including risk, market participants would use in pricing a strategy).<br />
The inputs or methodologies used for valuing securities are not necessarily an<br />
indication of the risk associated with investing in those securities and other<br />
financial instruments, if any. The following table summarizes the valuation of the<br />
Fund’s investments by the above fair value hierarchy as of March 31, 2014:<br />
LEVEL 1<br />
(000S)<br />
LEVEL 2<br />
(000S)<br />
LEVEL 3<br />
(000S)<br />
TOTAL<br />
(000S)<br />
INVESTMENTS<br />
Common Stocks<br />
Ireland 316 14,138 — 14,454<br />
Netherlands 2,872 125,914 — 128,786<br />
Switzerland 1,366 443,549 — 444,915<br />
United Kingdom 111 921,905 — 922,016<br />
All Other Countries — 2,944,968 (1) — 2,944,968<br />
Preferred Stocks — 27,535 (1) — 27,535<br />
Rights — 911 (1) — 911<br />
Investment Companies 73,036 — — 73,036<br />
Total Investments $77,701 $4,478,920 $ — $4,556,621<br />
See Notes to the Financial Statements.<br />
NORTHERN FUNDS ANNUAL REPORT 71 EQUITY INDEX FUNDS
SCHEDULE OF INVESTMENTS<br />
INTERNATIONAL EQUITY INDEX FUND continued MARCH 31, 2014<br />
INVESTMENTS<br />
OTHER FINANCIAL<br />
INSTRUMENTS<br />
LEVEL 1<br />
(000S)<br />
LEVEL 2<br />
(000S)<br />
LEVEL 3<br />
(000S)<br />
TOTAL<br />
(000S)<br />
Assets<br />
Futures Contracts $2,110 $ — $ — $2,110<br />
Forward Foreign<br />
Currency Exchange<br />
Contracts — 112 — 112<br />
Liabilities<br />
Futures Contracts (228) — — (228)<br />
Forward Foreign<br />
Currency Exchange<br />
Contracts — (480) — (480)<br />
Total Other Financial<br />
Instruments $1,882 $(368) $ — $1,514<br />
(1)<br />
Classifications as defined in the Schedule of Investments.<br />
The Fund discloses all transfers between levels based on valuations at the end of<br />
each reporting period.<br />
At March 31, 2014, the Fund had transfers from Level 1 to Level 2 as disclosed<br />
below:<br />
Transfers from Level 1 to Level 2<br />
Country<br />
Common Stocks<br />
Japan<br />
Value<br />
(000S)<br />
Reason<br />
$868,921 Valuations at last trade with foreign value adjustments<br />
See Notes to the Financial Statements.<br />
EQUITY INDEX FUNDS 72 NORTHERN FUNDS ANNUAL REPORT
SCHEDULE OF INVESTMENTS<br />
MID CAP INDEX FUND MARCH 31, 2014<br />
NUMBER<br />
OF SHARES<br />
VALUE<br />
(000S)<br />
COMMON STOCKS - 97.9%<br />
Advertising - 0.2%<br />
Lamar Advertising Co., Class A* 53,750 $2,741<br />
Aerospace/Defense - 1.5%<br />
Alliant Techsystems, Inc. 26,133 3,715<br />
B/E Aerospace, Inc.* 81,114 7,040<br />
Esterline Technologies Corp.* 26,070 2,777<br />
Exelis, Inc. 155,601 2,958<br />
Triumph Group, Inc. 43,109 2,784<br />
19,274<br />
Agriculture - 0.1%<br />
Universal Corp. 19,046 1,064<br />
Airlines - 0.5%<br />
Alaska Air Group, Inc. 56,410 5,264<br />
JetBlue Airways Corp.* 186,934 1,624<br />
6,888<br />
Apparel - 1.5%<br />
Carter’s, Inc. 44,099 3,424<br />
Deckers Outdoor Corp.* 28,447 2,268<br />
Hanesbrands, Inc. 81,691 6,248<br />
Under Armour, Inc., Class A* 65,996 7,566<br />
19,506<br />
Auto Manufacturers - 0.3%<br />
Oshkosh Corp. 69,106 4,068<br />
Banks - 4.3%<br />
Associated Banc-Corp. 132,135 2,386<br />
BancorpSouth, Inc. 69,074 1,724<br />
Bank of Hawaii Corp. 36,509 2,213<br />
Cathay General Bancorp 60,793 1,531<br />
City National Corp. 39,017 3,071<br />
Commerce Bancshares, Inc. 67,006 3,111<br />
Cullen/Frost Bankers, Inc. 43,401 3,365<br />
East West Bancorp, Inc. 117,590 4,292<br />
First Horizon National Corp. 194,079 2,395<br />
FirstMerit Corp. 135,542 2,823<br />
Fulton Financial Corp. 157,047 1,976<br />
Hancock Holding Co. 67,548 2,476<br />
International Bancshares Corp. 47,023 1,179<br />
Prosperity Bancshares, Inc. 46,782 3,095<br />
Signature Bank* 38,833 4,877<br />
SVB Financial Group* 37,678 4,852<br />
Synovus Financial Corp. 798,347 2,706<br />
TCF Financial Corp. 135,843 2,263<br />
Trustmark Corp. 55,358 1,403<br />
NUMBER<br />
OF SHARES<br />
continued<br />
VALUE<br />
(000S)<br />
COMMON STOCKS - 97.9%<br />
Banks - 4.3% continued<br />
Valley National Bancorp 164,356 $1,711<br />
Webster Financial Corp. 74,162 2,304<br />
Westamerica Bancorporation 21,663 1,172<br />
56,925<br />
Biotechnology - 1.0%<br />
Bio-Rad Laboratories, Inc., Class A* 16,499 2,114<br />
Charles River Laboratories<br />
International, Inc.* 39,168 2,363<br />
Cubist Pharmaceuticals, Inc.* 61,459 4,496<br />
United Therapeutics Corp.* 38,150 3,587<br />
12,560<br />
Building Materials - 1.5%<br />
Eagle Materials, Inc. 41,035 3,638<br />
Fortune Brands Home & Security, Inc. 136,021 5,724<br />
Lennox International, Inc. 37,010 3,364<br />
Louisiana-Pacific Corp.* 115,933 1,956<br />
Martin Marietta Materials, Inc. 37,913 4,866<br />
19,548<br />
Chemicals - 2.7%<br />
Albemarle Corp. 65,458 4,348<br />
Ashland, Inc. 59,473 5,916<br />
Cabot Corp. 49,147 2,903<br />
Cytec Industries, Inc. 29,290 2,859<br />
Intrepid Potash, Inc.* 44,857 693<br />
Minerals Technologies, Inc. 28,246 1,824<br />
NewMarket Corp. 9,156 3,578<br />
Olin Corp. 65,260 1,802<br />
RPM International, Inc. 109,376 4,576<br />
Sensient Technologies Corp. 41,271 2,328<br />
Valspar (The) Corp. 64,498 4,652<br />
35,479<br />
Coal - 0.1%<br />
Alpha Natural Resources, Inc.* 183,548 780<br />
Commercial Services - 5.3%<br />
Aaron’s, Inc. 59,054 1,786<br />
Apollo Education Group, Inc.* 81,430 2,788<br />
Brink’s (The) Co. 39,563 1,129<br />
Convergys Corp. 82,684 1,812<br />
CoreLogic, Inc.* 75,167 2,258<br />
Corporate Executive Board (The) Co. 27,651 2,053<br />
Deluxe Corp. 41,383 2,171<br />
DeVry Education Group, Inc. 46,851 1,986<br />
FTI Consulting, Inc.* 33,333 1,111<br />
See Notes to the Financial Statements.<br />
NORTHERN FUNDS ANNUAL REPORT 73 EQUITY INDEX FUNDS
SCHEDULE OF INVESTMENTS<br />
MID CAP INDEX FUND continued<br />
NUMBER<br />
OF SHARES<br />
COMMON STOCKS - 97.9% continued<br />
Commercial Services - 5.3% continued<br />
VALUE<br />
(000S)<br />
Gartner, Inc.* 75,652 $5,253<br />
Global Payments, Inc. 59,063 4,200<br />
HMS Holdings Corp.* 72,058 1,373<br />
Leidos Holdings, Inc. 59,803 2,115<br />
Manpowergroup, Inc. 65,358 5,152<br />
Matthews International Corp., Class A 22,428 915<br />
Rent-A-Center, Inc. 43,203 1,149<br />
Rollins, Inc. 52,737 1,595<br />
RR Donnelley & Sons Co. 162,416 2,907<br />
Science Applications International Corp. 34,290 1,282<br />
SEI Investments Co. 116,860 3,928<br />
Service Corp. International 174,406 3,467<br />
Sotheby’s 56,752 2,472<br />
Towers Watson & Co., Class A 52,687 6,009<br />
TravelCenters of America LLC -<br />
(Fractional Shares)* 80,000 —<br />
United Rentals, Inc.* 76,574 7,270<br />
WEX, Inc.* 31,958 3,038<br />
69,219<br />
Computers - 3.0%<br />
3D Systems Corp.* 78,779 4,660<br />
Cadence Design Systems, Inc.* 237,335 3,688<br />
Diebold, Inc. 52,752 2,104<br />
DST Systems, Inc. 24,066 2,281<br />
Jack Henry & Associates, Inc. 70,202 3,914<br />
Lexmark International, Inc., Class A 50,627 2,344<br />
Mentor Graphics Corp. 80,036 1,762<br />
MICROS Systems, Inc.* 61,741 3,268<br />
NCR Corp.* 136,905 5,004<br />
Riverbed Technology, Inc.* 131,334 2,589<br />
Synopsys, Inc.* 126,491 4,858<br />
VeriFone Systems, Inc.* 91,265 3,087<br />
39,559<br />
Distribution/Wholesale - 1.5%<br />
Arrow Electronics, Inc.* 82,072 4,872<br />
Ingram Micro, Inc., Class A* 126,853 3,750<br />
LKQ Corp.* 247,442 6,520<br />
Owens & Minor, Inc. 51,823 1,815<br />
Watsco, Inc. 22,319 2,230<br />
19,187<br />
Diversified Financial Services - 2.5%<br />
Affiliated Managers Group, Inc.* 43,692 8,741<br />
CBOE Holdings, Inc. 70,993 4,018<br />
NUMBER<br />
OF SHARES<br />
COMMON STOCKS - 97.9% continued<br />
Diversified Financial Services - 2.5% continued<br />
VALUE<br />
(000S)<br />
Eaton Vance Corp. 100,766 $3,845<br />
Federated Investors, Inc., Class B 77,449 2,365<br />
Greenhill & Co., Inc. 21,857 1,136<br />
Janus Capital Group, Inc. 123,924 1,347<br />
Raymond James Financial, Inc. 101,673 5,687<br />
Waddell & Reed Financial, Inc., Class A 69,661 5,128<br />
32,267<br />
Electric - 2.6%<br />
Alliant Energy Corp. 91,139 5,178<br />
Black Hills Corp. 36,554 2,107<br />
Cleco Corp. 49,656 2,512<br />
Great Plains Energy, Inc. 126,337 3,416<br />
Hawaiian Electric Industries, Inc. 83,212 2,115<br />
IDACORP, Inc. 41,259 2,289<br />
MDU Resources Group, Inc. 155,499 5,335<br />
OGE Energy Corp. 163,121 5,996<br />
PNM Resources, Inc. 65,339 1,766<br />
Westar Energy, Inc. 105,705 3,717<br />
34,431<br />
Electrical Components & Equipment - 1.2%<br />
Acuity Brands, Inc. 35,364 4,688<br />
Energizer Holdings, Inc. 51,393 5,177<br />
General Cable Corp. 40,439 1,036<br />
Hubbell, Inc., Class B 44,262 5,306<br />
16,207<br />
Electronics - 2.4%<br />
Avnet, Inc. 113,521 5,282<br />
Gentex Corp. 119,593 3,771<br />
Itron, Inc.* 32,174 1,143<br />
Mettler-Toledo International, Inc.* 24,107 5,682<br />
National Instruments Corp. 80,665 2,314<br />
Tech Data Corp.* 31,268 1,906<br />
Trimble Navigation Ltd.* 213,345 8,293<br />
Vishay Intertechnology, Inc. 111,337 1,657<br />
Woodward, Inc. 48,857 2,029<br />
32,077<br />
Engineering & Construction - 0.7%<br />
AECOM Technology Corp.* 81,344 2,617<br />
Granite Construction, Inc. 29,753 1,188<br />
KBR, Inc. 121,676 3,246<br />
URS Corp. 59,255 2,789<br />
9,840<br />
See Notes to the Financial Statements.<br />
EQUITY INDEX FUNDS 74 NORTHERN FUNDS ANNUAL REPORT
MARCH 31, 2014<br />
NUMBER<br />
OF SHARES<br />
continued<br />
VALUE<br />
(000S)<br />
COMMON STOCKS - 97.9%<br />
Entertainment - 0.6%<br />
Bally Technologies, Inc.* 32,092 $2,127<br />
Cinemark Holdings, Inc. 85,224 2,472<br />
DreamWorks Animation SKG, Inc.,<br />
Class A* 59,011 1,567<br />
International Speedway Corp., Class A 23,296 792<br />
Scientific Games Corp., Class A* 39,130 537<br />
7,495<br />
Environmental Control - 0.6%<br />
Clean Harbors, Inc.* 45,366 2,485<br />
MSA Safety, Inc. 25,977 1,481<br />
Waste Connections, Inc. 101,519 4,453<br />
8,419<br />
Food - 2.1%<br />
Dean Foods Co. 77,917 1,205<br />
Flowers Foods, Inc. 143,830 3,085<br />
Hain Celestial Group (The), Inc.* 40,941 3,745<br />
Hillshire Brands (The) Co. 100,506 3,745<br />
Ingredion, Inc. 61,072 4,158<br />
Lancaster Colony Corp. 15,956 1,586<br />
Post Holdings, Inc.* 30,937 1,705<br />
SUPERVALU, Inc.* 162,370 1,111<br />
Tootsie Roll Industries, Inc. 17,055 511<br />
United Natural Foods, Inc.* 40,755 2,890<br />
WhiteWave Foods (The) Co., Class A* 142,507 4,067<br />
27,808<br />
Forest Products & Paper - 0.2%<br />
Domtar Corp. 26,670 2,993<br />
Gas-1.7%<br />
Atmos Energy Corp. 82,270 3,877<br />
National Fuel Gas Co. 68,791 4,818<br />
ONE Gas, Inc.* 42,613 1,531<br />
Questar Corp. 143,800 3,420<br />
UGI Corp. 94,223 4,298<br />
Vectren Corp. 67,642 2,664<br />
WGL Holdings, Inc. 42,625 1,708<br />
22,316<br />
Hand/Machine Tools - 0.8%<br />
Kennametal, Inc. 64,570 2,860<br />
Lincoln Electric Holdings, Inc. 66,557 4,793<br />
Regal-Beloit Corp. 37,011 2,691<br />
10,344<br />
NUMBER<br />
OF SHARES<br />
continued<br />
VALUE<br />
(000S)<br />
COMMON STOCKS - 97.9%<br />
Healthcare - Products - 3.7%<br />
Align Technology, Inc.* 58,883 $3,050<br />
Cooper (The) Cos., Inc. 39,326 5,402<br />
Henry Schein, Inc.* 70,145 8,373<br />
Hill-Rom Holdings, Inc. 47,094 1,815<br />
Hologic, Inc.* 225,285 4,844<br />
IDEXX Laboratories, Inc.* 42,402 5,148<br />
Masimo Corp.* 42,487 1,160<br />
ResMed, Inc. 116,263 5,196<br />
Sirona Dental Systems, Inc.* 45,345 3,386<br />
STERIS Corp. 48,406 2,311<br />
Techne Corp. 27,275 2,328<br />
Teleflex, Inc. 33,802 3,625<br />
Thoratec Corp.* 46,636 1,670<br />
48,308<br />
Healthcare - Services - 2.0%<br />
Community Health Systems, Inc.* 93,131 3,648<br />
Covance, Inc.* 46,548 4,836<br />
Health Net, Inc.* 65,671 2,234<br />
LifePoint Hospitals, Inc.* 38,759 2,114<br />
MEDNAX, Inc.* 83,058 5,148<br />
Universal Health Services, Inc., Class B 73,637 6,044<br />
WellCare Health Plans, Inc.* 35,946 2,283<br />
26,307<br />
Home Builders - 1.0%<br />
KB Home 73,159 1,243<br />
MDC Holdings, Inc. 31,745 898<br />
NVR, Inc.* 3,354 3,847<br />
Thor Industries, Inc. 36,755 2,244<br />
Toll Brothers, Inc.* 131,352 4,716<br />
12,948<br />
Home Furnishings - 0.2%<br />
Tempur Sealy International, Inc.* 49,796 2,523<br />
Household Products/Wares - 1.5%<br />
Church & Dwight Co., Inc. 112,651 7,781<br />
Jarden Corp.* 101,580 6,078<br />
Scotts Miracle-Gro (The) Co., Class A 36,244 2,221<br />
Tupperware Brands Corp. 41,348 3,463<br />
19,543<br />
Insurance - 5.0%<br />
Alleghany Corp.* 13,752 5,602<br />
American Financial Group, Inc. 58,817 3,394<br />
Arthur J Gallagher & Co. 109,870 5,228<br />
See Notes to the Financial Statements.<br />
NORTHERN FUNDS ANNUAL REPORT 75 EQUITY INDEX FUNDS
SCHEDULE OF INVESTMENTS<br />
MID CAP INDEX FUND continued<br />
NUMBER<br />
OF SHARES<br />
continued<br />
VALUE<br />
(000S)<br />
COMMON STOCKS - 97.9%<br />
Insurance - 5.0% continued<br />
Aspen Insurance Holdings Ltd. 53,507 $2,124<br />
Brown & Brown, Inc. 97,933 3,012<br />
Everest Re Group Ltd. 38,906 5,954<br />
Fidelity National Financial, Inc., Class A 226,870 7,133<br />
First American Financial Corp. 87,185 2,315<br />
Hanover Insurance Group (The), Inc. 36,034 2,214<br />
HCC Insurance Holdings, Inc. 81,950 3,728<br />
Kemper Corp. 41,970 1,644<br />
Mercury General Corp. 29,829 1,345<br />
Old Republic International Corp. 198,918 3,262<br />
Primerica, Inc. 45,108 2,125<br />
Protective Life Corp. 64,534 3,394<br />
Reinsurance Group of America, Inc. 58,141 4,630<br />
RenaissanceRe Holdings Ltd. 34,230 3,341<br />
StanCorp Financial Group, Inc. 35,929 2,400<br />
WR Berkley Corp. 85,461 3,557<br />
66,402<br />
Internet - 1.3%<br />
AOL, Inc.* 65,237 2,855<br />
Conversant, Inc.* 52,029 1,465<br />
Equinix, Inc.* 40,525 7,491<br />
Rackspace Hosting, Inc.* 95,453 3,133<br />
TIBCO Software, Inc.* 125,322 2,546<br />
17,490<br />
Iron/Steel - 0.9%<br />
Carpenter Technology Corp. 43,570 2,877<br />
Commercial Metals Co. 96,339 1,819<br />
Reliance Steel & Aluminum Co. 63,727 4,503<br />
Steel Dynamics, Inc. 183,115 3,258<br />
12,457<br />
Leisure Time - 1.0%<br />
Brunswick Corp. 76,021 3,443<br />
Life Time Fitness, Inc.* 31,621 1,521<br />
Polaris Industries, Inc. 53,944 7,536<br />
12,500<br />
Machinery - Construction & Mining - 0.3%<br />
Terex Corp. 90,873 4,026<br />
Machinery - Diversified - 1.9%<br />
AGCO Corp. 71,581 3,948<br />
Graco, Inc. 49,974 3,735<br />
IDEX Corp. 66,443 4,843<br />
Nordson Corp. 49,680 3,502<br />
NUMBER<br />
OF SHARES<br />
COMMON STOCKS - 97.9% continued<br />
Machinery - Diversified - 1.9% continued<br />
VALUE<br />
(000S)<br />
Wabtec Corp. 78,804 $6,107<br />
Zebra Technologies Corp., Class A* 41,355 2,871<br />
25,006<br />
Media - 0.9%<br />
AMC Networks, Inc., Class A* 48,660 3,556<br />
FactSet Research Systems, Inc. 32,628 3,518<br />
John Wiley & Sons, Inc., Class A 38,221 2,203<br />
Meredith Corp. 30,468 1,415<br />
New York Times (The) Co., Class A 103,306 1,768<br />
12,460<br />
Metal Fabrication/Hardware - 0.7%<br />
Timken (The) Co. 64,171 3,772<br />
Valmont Industries, Inc. 22,002 3,275<br />
Worthington Industries, Inc. 43,363 1,658<br />
8,705<br />
Mining - 0.4%<br />
Compass Minerals International, Inc. 27,499 2,269<br />
Royal Gold, Inc. 53,442 3,347<br />
5,616<br />
Miscellaneous Manufacturing - 2.5%<br />
A.O. Smith Corp. 62,888 2,894<br />
AptarGroup, Inc. 53,831 3,558<br />
Carlisle Cos., Inc. 52,269 4,147<br />
CLARCOR, Inc. 41,344 2,371<br />
Crane Co. 40,160 2,857<br />
Donaldson Co., Inc. 109,716 4,652<br />
Harsco Corp. 66,288 1,553<br />
ITT Corp. 75,058 3,210<br />
SPX Corp. 36,832 3,621<br />
Trinity Industries, Inc. 63,607 4,584<br />
33,447<br />
Office Furnishings - 0.2%<br />
Herman Miller, Inc. 48,396 1,555<br />
HNI Corp. 37,218 1,361<br />
2,916<br />
Oil&Gas-3.5%<br />
Atwood Oceanics, Inc.* 47,461 2,391<br />
Bill Barrett Corp.* 40,319 1,032<br />
Cimarex Energy Co. 71,428 8,508<br />
Energen Corp. 59,739 4,827<br />
Gulfport Energy Corp.* 69,990 4,982<br />
HollyFrontier Corp. 163,368 7,773<br />
See Notes to the Financial Statements.<br />
EQUITY INDEX FUNDS 76 NORTHERN FUNDS ANNUAL REPORT
MARCH 31, 2014<br />
NUMBER<br />
OF SHARES<br />
continued<br />
VALUE<br />
(000S)<br />
COMMON STOCKS - 97.9%<br />
Oil & Gas - 3.5% continued<br />
Murphy USA, Inc.* 36,439 $1,479<br />
Patterson-UTI Energy, Inc. 118,393 3,751<br />
Rosetta Resources, Inc.* 50,342 2,345<br />
SM Energy Co. 55,082 3,927<br />
Unit Corp.* 35,988 2,353<br />
WPX Energy, Inc.* 165,600 2,986<br />
46,354<br />
Oil & Gas Services - 2.0%<br />
CARBO Ceramics, Inc. 16,320 2,252<br />
Dresser-Rand Group, Inc.* 62,607 3,657<br />
Dril-Quip, Inc.* 33,378 3,742<br />
Helix Energy Solutions Group, Inc.* 80,751 1,855<br />
Oceaneering International, Inc. 88,795 6,381<br />
Oil States International, Inc.* 43,839 4,322<br />
Superior Energy Services, Inc. 130,233 4,006<br />
26,215<br />
Packaging & Containers - 1.4%<br />
Greif, Inc., Class A 25,023 1,313<br />
Packaging Corp. of America 80,655 5,676<br />
Rock-Tenn Co., Class A 58,887 6,217<br />
Silgan Holdings, Inc. 35,982 1,782<br />
Sonoco Products Co. 84,021 3,446<br />
18,434<br />
Pharmaceuticals - 1.8%<br />
Endo International PLC* 112,931 7,753<br />
Mallinckrodt PLC* 47,712 3,025<br />
Omnicare, Inc. 81,921 4,888<br />
Salix Pharmaceuticals Ltd.* 52,052 5,393<br />
VCA Antech, Inc.* 72,464 2,336<br />
23,395<br />
Real Estate - 0.4%<br />
Alexander & Baldwin, Inc. 35,201 1,498<br />
Jones Lang LaSalle, Inc. 36,563 4,333<br />
5,831<br />
Real Estate Investment Trusts - 8.9%<br />
Alexandria Real Estate Equities, Inc. 58,816 4,268<br />
American Campus Communities, Inc. 86,051 3,214<br />
BioMed Realty Trust, Inc. 158,039 3,238<br />
BRE Properties, Inc. 63,510 3,987<br />
Camden Property Trust 70,173 4,725<br />
Corporate Office Properties Trust 71,758 1,912<br />
Corrections Corp. of America 95,242 2,983<br />
NUMBER<br />
OF SHARES<br />
COMMON STOCKS - 97.9% continued<br />
Real Estate Investment Trusts - 8.9% continued<br />
VALUE<br />
(000S)<br />
Duke Realty Corp. 268,511 $4,532<br />
<strong>Equity</strong> One, Inc. 52,050 1,163<br />
Essex Property Trust, Inc. 31,661 5,384<br />
Extra Space Storage, Inc. 90,370 4,384<br />
Federal Realty Investment Trust 54,872 6,295<br />
Highwoods Properties, Inc. 73,795 2,834<br />
Home Properties, Inc. 46,843 2,816<br />
Hospitality Properties Trust 122,874 3,529<br />
Kilroy Realty Corp. 67,440 3,951<br />
Liberty Property Trust 120,381 4,449<br />
Mack-Cali Realty Corp. 72,708 1,512<br />
Mid-America Apartment Communities, Inc. 61,545 4,202<br />
National Retail Properties, Inc. 100,149 3,437<br />
Omega Healthcare Investors, Inc. 102,038 3,420<br />
Potlatch Corp. 33,459 1,295<br />
Rayonier, Inc. 103,790 4,765<br />
Rayonier, Inc. - (Fractional Shares)* 50,000 —<br />
Realty Income Corp. 180,310 7,367<br />
Regency Centers Corp. 75,827 3,872<br />
Senior Housing Properties Trust 154,502 3,472<br />
SL Green Realty Corp. 78,095 7,858<br />
Taubman Centers, Inc. 51,822 3,668<br />
UDR, Inc. 206,489 5,334<br />
Weingarten Realty Investors 92,107 2,763<br />
116,629<br />
Retail-6.1%<br />
Abercrombie & Fitch Co., Class A 62,737 2,415<br />
Advance Auto Parts, Inc. 59,841 7,570<br />
American Eagle Outfitters, Inc. 139,244 1,704<br />
ANN, Inc.* 37,747 1,566<br />
Ascena Retail Group, Inc.* 106,029 1,832<br />
Big Lots, Inc.* 47,967 1,817<br />
Bob Evans Farms, Inc. 20,271 1,014<br />
Brinker International, Inc. 55,090 2,890<br />
Cabela’s, Inc.* 38,300 2,509<br />
Cheesecake Factory (The), Inc. 39,024 1,859<br />
Chico’s FAS, Inc. 130,398 2,090<br />
Copart, Inc.* 91,950 3,346<br />
CST Brands, Inc. 62,109 1,940<br />
Dick’s Sporting Goods, Inc. 83,629 4,567<br />
Domino’s Pizza, Inc. 45,728 3,520<br />
Foot Locker, Inc. 120,484 5,660<br />
Guess?, Inc. 48,737 1,345<br />
HSN, Inc. 27,438 1,639<br />
See Notes to the Financial Statements.<br />
NORTHERN FUNDS ANNUAL REPORT 77 EQUITY INDEX FUNDS
SCHEDULE OF INVESTMENTS<br />
MID CAP INDEX FUND continued<br />
NUMBER<br />
OF SHARES<br />
continued<br />
VALUE<br />
(000S)<br />
COMMON STOCKS - 97.9%<br />
Retail - 6.1% continued<br />
J.C. Penney Co., Inc.* 250,085 $2,156<br />
Kate Spade & Co.* 101,300 3,757<br />
MSC Industrial Direct Co., Inc., Class A 38,817 3,359<br />
Office Depot, Inc.* 397,774 1,643<br />
Panera Bread Co., Class A* 21,652 3,821<br />
Signet Jewelers Ltd. 65,910 6,977<br />
Wendy’s (The) Co. 216,456 1,974<br />
Williams-Sonoma, Inc. 72,001 4,798<br />
World Fuel Services Corp. 58,965 2,600<br />
80,368<br />
Savings & Loans - 0.9%<br />
Astoria Financial Corp. 69,293 958<br />
First Niagara Financial Group, Inc. 290,595 2,746<br />
New York Community Bancorp, Inc. 363,031 5,834<br />
Washington Federal, Inc. 84,175 1,961<br />
11,499<br />
Semiconductors - 2.7%<br />
Advanced Micro Devices, Inc.* 506,739 2,032<br />
Atmel Corp.* 349,330 2,920<br />
Cree, Inc.* 99,830 5,646<br />
Cypress Semiconductor Corp.* 116,504 1,196<br />
Fairchild Semiconductor<br />
International, Inc.* 102,865 1,419<br />
Integrated Device Technology, Inc.* 112,017 1,370<br />
International Rectifier Corp.* 58,495 1,603<br />
Intersil Corp., Class A 104,916 1,356<br />
Rovi Corp.* 80,492 1,834<br />
Semtech Corp.* 56,378 1,429<br />
Silicon Laboratories, Inc.* 32,310 1,688<br />
Skyworks Solutions, Inc.* 155,102 5,819<br />
SunEdison, Inc.* 201,851 3,803<br />
Teradyne, Inc.* 159,220 3,167<br />
35,282<br />
Shipbuilding - 0.3%<br />
Huntington Ingalls Industries, Inc. 39,996 4,090<br />
Software - 3.3%<br />
ACI Worldwide, Inc.* 31,607 1,871<br />
Acxiom Corp.* 62,757 2,159<br />
Advent Software, Inc. 33,296 978<br />
Allscripts Healthcare Solutions, Inc.* 130,782 2,358<br />
ANSYS, Inc.* 76,024 5,855<br />
Broadridge Financial Solutions, Inc. 98,079 3,643<br />
CommVault Systems, Inc.* 36,629 2,379<br />
NUMBER<br />
OF SHARES<br />
continued<br />
VALUE<br />
(000S)<br />
COMMON STOCKS - 97.9%<br />
Software - 3.3% continued<br />
Compuware Corp. 179,070 $1,880<br />
Concur Technologies, Inc.* 39,072 3,871<br />
Fair Isaac Corp. 28,630 1,584<br />
Informatica Corp.* 89,623 3,386<br />
ManTech International Corp., Class A 19,475 573<br />
MSCI, Inc.* 95,707 4,117<br />
PTC, Inc.* 97,442 3,452<br />
SolarWinds, Inc.* 53,658 2,287<br />
Solera Holdings, Inc. 56,650 3,588<br />
43,981<br />
Telecommunications - 1.8%<br />
ADTRAN, Inc. 46,992 1,147<br />
Ciena Corp.* 86,248 1,961<br />
Fortinet, Inc.* 112,341 2,475<br />
InterDigital, Inc. 33,276 1,102<br />
JDS Uniphase Corp.* 191,729 2,684<br />
Knowles Corp.* 69,828 2,204<br />
NeuStar, Inc., Class A* 50,184 1,632<br />
Plantronics, Inc. 35,381 1,573<br />
Polycom, Inc.* 112,322 1,541<br />
RF Micro Devices, Inc.* 231,977 1,828<br />
Telephone & Data Systems, Inc. 81,233 2,129<br />
tw telecom, Inc.* 115,491 3,610<br />
23,886<br />
Transportation - 1.9%<br />
Con-way, Inc. 46,686 1,918<br />
Genesee & Wyoming, Inc., Class A* 41,809 4,069<br />
JB Hunt Transport Services, Inc. 75,112 5,402<br />
Kirby Corp.* 46,694 4,728<br />
Landstar System, Inc. 37,352 2,212<br />
Old Dominion Freight Line, Inc.* 57,252 3,249<br />
Tidewater, Inc. 40,586 1,973<br />
UTi Worldwide, Inc. 75,743 802<br />
Werner Enterprises, Inc. 38,113 972<br />
25,325<br />
Trucking & Leasing - 0.2%<br />
GATX Corp. 37,745 2,562<br />
Water-0.3%<br />
Aqua America, Inc. 145,111 3,638<br />
Total Common Stocks<br />
(Cost $910,777) 1,289,138<br />
See Notes to the Financial Statements.<br />
EQUITY INDEX FUNDS 78 NORTHERN FUNDS ANNUAL REPORT
MARCH 31, 2014<br />
(1)<br />
(2)<br />
(3)<br />
*<br />
NUMBER<br />
OF SHARES<br />
VALUE<br />
(000S)<br />
INVESTMENT COMPANIES - 1.8%<br />
<strong>Northern</strong> Institutional <strong>Funds</strong> -<br />
Diversified Assets Portfolio, 0.01% (1) (2) 23,833,504 $23,834<br />
Total Investment Companies<br />
(Cost $23,834) 23,834<br />
PRINCIPAL<br />
AMOUNT<br />
(000S)<br />
VALUE<br />
(000S)<br />
SHORT-TERM INVESTMENTS - 0.2%<br />
U.S. Treasury Bill,<br />
0.05%, 4/10/14 (3) $2,455 $2,455<br />
Total Short-Term Investments<br />
(Cost $2,455) 2,455<br />
Total Investments - 99.9%<br />
(Cost $937,066) 1,315,427<br />
Other Assets less Liabilities - 0.1% 741<br />
NET ASSETS - 100.0% $1,316,168<br />
Investment in affiliated Portfolio. <strong>Northern</strong> Trust Investments, Inc. is the<br />
investment adviser to the Fund and the investment adviser to the <strong>Northern</strong><br />
Institutional <strong>Funds</strong>.<br />
At March 31, 2013, the value of the Fund’s investment in the Diversified Assets<br />
Portfolio of the <strong>Northern</strong> Institutional <strong>Funds</strong> was approximately $27,001,000<br />
with net sales of approximately $3,167,000 during the fiscal year ended<br />
March 31, 2014.<br />
Security pledged as collateral to cover margin requirements for open futures<br />
contracts.<br />
Non-Income Producing Security<br />
Percentages shown are based on Net Assets. The classifications shown on the<br />
Schedule of Investments and in the tables herein are unaudited.<br />
At March 31, 2014, the Fund had open futures contracts as follows:<br />
TYPE<br />
NUMBER OF<br />
CONTRACTS<br />
NOTIONAL<br />
AMOUNT<br />
(000S)<br />
CONTRACT<br />
POSITION<br />
CONTRACT<br />
EXP.<br />
UNREALIZED<br />
GAINS (LOSSES)<br />
(000S)<br />
E-Mini S&P<br />
MidCap 400 197 $27,086 Long 6/14 $285<br />
At March 31, 2014, the industry sectors (unaudited) for the Fund were :<br />
% OF LONG-TERM<br />
INDUSTRY SECTOR<br />
INVESTMENTS<br />
Consumer Discretionary 13.5%<br />
Consumer Staples 3.2<br />
Energy 5.9<br />
Financials 23.1<br />
Health Care 9.5<br />
Industrials 16.7<br />
Information Technology 15.8<br />
Materials 7.2<br />
Telecommunication Services 0.4<br />
Utilities 4.7<br />
Total 100.0%<br />
Various inputs are used in determining the value of the Fund’s investments. These<br />
inputs are summarized in three levels listed below:<br />
Level1-Unadjusted quoted market prices in active markets for identical securities<br />
on the measurement date.<br />
Level2-Otherobservable inputs (e.g., quoted prices in active markets for similar<br />
securities, securities valuations based on commonly quoted benchmark interest<br />
rates and yield curves, maturities, ratings and/or securities indices).<br />
Level 3 - Significant unobservable inputs (e.g., information about assumptions,<br />
including risk, market participants would use in pricing a security).<br />
The inputs or methodologies used for valuing securities are not necessarily an<br />
indication of the risk associated with investing in those securities and other<br />
financial instruments, if any. The following table summarizes the valuation of the<br />
Fund’s investments by the above fair value hierarchy as of March 31, 2014:<br />
INVESTMENTS<br />
LEVEL 1<br />
(000S)<br />
LEVEL 2<br />
(000S)<br />
LEVEL 3<br />
(000S)<br />
TOTAL<br />
(000S)<br />
Common Stocks $1,289,138 (1) $ — $ — $1,289,138<br />
Investment Companies 23,834 — — 23,834<br />
Short-Term Investments — 2,455 — 2,455<br />
Total Investments $1,312,972 $2,455 $ — $1,315,427<br />
OTHER FINANCIAL<br />
INSTRUMENTS<br />
Assets<br />
Futures Contracts $ 285 $ — $ — $ 285<br />
(1)<br />
Classifications as defined in the Schedule of Investments.<br />
The Fund discloses all transfers between levels based on valuations at the end of<br />
each reporting period.<br />
At March 31, 2014, there were no transfers between Level 1, Level 2 or Level 3<br />
classifications based on levels assigned to the securities on March 31, 2013.<br />
See Notes to the Financial Statements.<br />
NORTHERN FUNDS ANNUAL REPORT 79 EQUITY INDEX FUNDS
SCHEDULE OF INVESTMENTS<br />
SMALL CAP INDEX FUND<br />
NUMBER<br />
OF SHARES<br />
VALUE<br />
(000S)<br />
COMMON STOCKS - 97.1%<br />
Advertising - 0.1%<br />
Harte-Hanks, Inc. 24,477 $216<br />
Marchex, Inc., Class B 13,143 138<br />
Marin Software, Inc.* 5,161 55<br />
MDC Partners, Inc., Class A 21,537 491<br />
Millennial Media, Inc.* 20,081 139<br />
Sizmek, Inc.* 13,771 146<br />
ValueVision Media, Inc., Class A* 22,349 109<br />
1,294<br />
Aerospace/Defense - 1.5%<br />
AAR Corp. 22,614 587<br />
Aerovironment, Inc.* 10,547 424<br />
API Technologies Corp.* 17,720 52<br />
Astronics Corp.* 8,577 544<br />
Cubic Corp. 11,297 577<br />
Curtiss-Wright Corp. 26,648 1,693<br />
Ducommun, Inc.* 6,037 151<br />
Erickson Air-Crane, Inc.* 2,118 41<br />
Esterline Technologies Corp.* 17,802 1,897<br />
GenCorp, Inc.* 34,452 629<br />
HEICO Corp. 37,760 2,272<br />
Innovative Solutions & Support, Inc.* 7,070 53<br />
Kaman Corp. 15,408 627<br />
Kratos Defense & Security Solutions, Inc.* 25,028 189<br />
LMI Aerospace, Inc.* 5,829 82<br />
M/A-COM Technology Solutions<br />
Holdings, Inc.* 5,957 122<br />
Moog, Inc., Class A* 25,797 1,690<br />
National Presto Industries, Inc. 2,749 215<br />
Orbital Sciences Corp.* 34,151 953<br />
Teledyne Technologies, Inc.* 21,271 2,070<br />
14,868<br />
Agriculture - 0.3%<br />
Alico, Inc. 1,631 62<br />
Alliance One International, Inc.* 50,245 147<br />
Andersons (The), Inc. 15,958 945<br />
Griffin Land & Nurseries, Inc. 1,525 46<br />
Limoneira Co. 5,699 129<br />
Tejon Ranch Co.* 7,852 266<br />
Universal Corp. 13,277 742<br />
Vector Group Ltd. 35,894 773<br />
3,110<br />
Airlines - 0.5%<br />
Allegiant Travel Co. 8,532 955<br />
NUMBER<br />
OF SHARES<br />
continued<br />
VALUE<br />
(000S)<br />
COMMON STOCKS - 97.1%<br />
Airlines - 0.5% continued<br />
Hawaiian Holdings, Inc.* 29,557 $412<br />
JetBlue Airways Corp.* 132,319 1,150<br />
Republic Airways Holdings, Inc.* 27,973 256<br />
SkyWest, Inc. 29,530 377<br />
Spirit Airlines, Inc.* 34,315 2,038<br />
5,188<br />
Apparel - 1.0%<br />
American Apparel, Inc.* 32,524 16<br />
Columbia Sportswear Co. 7,354 608<br />
Crocs, Inc.* 50,143 782<br />
G-III Apparel Group Ltd.* 9,551 684<br />
Iconix Brand Group, Inc.* 27,601 1,084<br />
Jones Group (The), Inc. 45,574 682<br />
Oxford Industries, Inc. 7,656 599<br />
Perry Ellis International, Inc.* 7,008 96<br />
Quiksilver, Inc.* 75,459 567<br />
R.G. Barry Corp. 5,672 107<br />
Skechers U.S.A., Inc., Class A* 22,003 804<br />
Steven Madden Ltd.* 34,222 1,231<br />
Unifi, Inc.* 8,494 196<br />
Vince Holding Corp.* 6,546 173<br />
Weyco Group, Inc. 3,715 100<br />
Wolverine World Wide, Inc. 57,105 1,630<br />
9,359<br />
Auto Manufacturers - 0.1%<br />
Wabash National Corp.* 38,967 536<br />
Auto Parts & Equipment - 1.1%<br />
Accuride Corp.* 22,520 100<br />
American Axle & Manufacturing<br />
Holdings, Inc.* 38,271 709<br />
Commercial Vehicle Group, Inc.* 13,680 125<br />
Cooper Tire & Rubber Co. 36,048 876<br />
Dana Holding Corp. 89,776 2,089<br />
Dorman Products, Inc.* 14,354 848<br />
Douglas Dynamics, Inc. 12,669 221<br />
Federal-Mogul Corp.* 11,222 210<br />
Fuel Systems Solutions, Inc.* 7,999 86<br />
Gentherm, Inc.* 20,004 695<br />
Meritor, Inc.* 55,466 679<br />
Miller Industries, Inc. 6,287 123<br />
Modine Manufacturing Co.* 26,880 394<br />
Remy International, Inc. 7,996 189<br />
Spartan Motors, Inc. 19,445 100<br />
See Notes to the Financial Statements.<br />
EQUITY INDEX FUNDS 80 NORTHERN FUNDS ANNUAL REPORT
MARCH 31, 2014<br />
NUMBER<br />
OF SHARES<br />
COMMON STOCKS - 97.1% continued<br />
Auto Parts & Equipment - 1.1% continued<br />
VALUE<br />
(000S)<br />
Standard Motor Products, Inc. 11,278 $403<br />
Superior Industries International, Inc. 13,237 271<br />
Tenneco, Inc.* 34,603 2,009<br />
Titan International, Inc. 30,460 578<br />
Tower International, Inc.* 3,498 95<br />
10,800<br />
Banks - 6.9%<br />
1st Source Corp. 8,587 276<br />
1st United Bancorp, Inc. 17,027 130<br />
Access National Corp. 4,286 69<br />
American National Bankshares, Inc. 4,485 105<br />
Ameris Bancorp* 13,593 317<br />
Ames National Corp. 5,312 117<br />
Arrow Financial Corp. 6,079 161<br />
BancFirst Corp. 4,035 229<br />
Bancorp (The), Inc.* 18,699 352<br />
BancorpSouth, Inc. 54,141 1,351<br />
Bank of Kentucky Financial Corp. 3,500 131<br />
Bank of Marin Bancorp 3,341 150<br />
Bank of the Ozarks, Inc. 17,691 1,204<br />
Banner Corp. 11,065 456<br />
Bar Harbor Bankshares 2,199 84<br />
BBCN Bancorp, Inc. 44,938 770<br />
BNC Bancorp 10,431 181<br />
Boston Private Financial Holdings, Inc. 45,364 614<br />
Bridge Bancorp, Inc. 6,373 170<br />
Bridge Capital Holdings* 5,415 129<br />
Bryn Mawr Bank Corp. 7,699 221<br />
C&F Financial Corp. 1,881 62<br />
Camden National Corp. 4,348 179<br />
Capital Bank Financial Corp., Class A* 13,362 336<br />
Capital City Bank Group, Inc. 7,008 93<br />
Cardinal Financial Corp. 17,223 307<br />
Cascade Bancorp* 4,235 24<br />
Cass Information Systems, Inc. 5,865 302<br />
Cathay General Bancorp 44,882 1,131<br />
Center Bancorp, Inc. 6,712 128<br />
Centerstate Banks, Inc. 17,148 187<br />
Central Pacific Financial Corp. 12,414 251<br />
Century Bancorp, Inc., Class A 1,981 68<br />
Chemical Financial Corp. 16,775 544<br />
Chemung Financial Corp. 2,021 55<br />
Citizens & <strong>Northern</strong> Corp. 7,034 139<br />
City Holding Co. 8,913 400<br />
NUMBER<br />
OF SHARES<br />
continued<br />
VALUE<br />
(000S)<br />
COMMON STOCKS - 97.1%<br />
Banks - 6.9% continued<br />
CNB Financial Corp. 8,198 $145<br />
CoBiz Financial, Inc. 20,189 233<br />
Columbia Banking System, Inc. 29,002 827<br />
Community Bank System, Inc. 22,747 888<br />
Community Trust Bancorp, Inc. 7,980 331<br />
CommunityOne Bancorp* 6,037 68<br />
ConnectOne Bancorp, Inc.* 957 47<br />
CU Bancorp* 5,272 97<br />
Customers Bancorp, Inc.* 11,356 237<br />
CVB Financial Corp. 52,224 830<br />
Eagle Bancorp, Inc.* 12,694 458<br />
Enterprise Bancorp, Inc. 4,067 83<br />
Enterprise Financial Services Corp. 10,970 220<br />
Farmers Capital Bank Corp.* 4,191 94<br />
Fidelity Southern Corp. 8,362 117<br />
Financial Institutions, Inc. 7,858 181<br />
First BanCorp* 41,056 223<br />
First Bancorp 11,209 213<br />
First Bancorp, Inc. 5,359 87<br />
First Busey Corp. 41,309 240<br />
First Commonwealth Financial Corp. 55,709 504<br />
First Community Bancshares, Inc. 9,631 158<br />
First Connecticut Bancorp, Inc. 9,696 152<br />
First Financial Bancorp 32,906 592<br />
First Financial Bankshares, Inc. 17,939 1,108<br />
First Financial Corp. 6,404 216<br />
First Financial Holdings, Inc. 13,676 856<br />
First Interstate Bancsystem, Inc. 9,971 281<br />
First Merchants Corp. 19,885 430<br />
First Midwest Bancorp, Inc. 42,700 729<br />
First NBC Bank Holding Co.* 2,340 82<br />
First of Long Island (The) Corp. 4,507 183<br />
First Security Group, Inc.* 37,178 77<br />
FirstMerit Corp. 94,289 1,964<br />
FNB Corp. 88,617 1,187<br />
Franklin Financial Corp.* 6,047 118<br />
German American Bancorp, Inc. 7,214 208<br />
Glacier Bancorp, Inc. 40,953 1,191<br />
Great Southern Bancorp, Inc. 5,872 176<br />
Guaranty Bancorp 8,387 120<br />
Hampton Roads Bankshares, Inc.* 18,964 30<br />
Hancock Holding Co. 48,275 1,769<br />
Hanmi Financial Corp. 17,968 419<br />
Heartland Financial USA, Inc. 8,441 228<br />
See Notes to the Financial Statements.<br />
NORTHERN FUNDS ANNUAL REPORT 81 EQUITY INDEX FUNDS
SCHEDULE OF INVESTMENTS<br />
SMALL CAP INDEX FUND continued<br />
NUMBER<br />
OF SHARES<br />
continued<br />
VALUE<br />
(000S)<br />
COMMON STOCKS - 97.1%<br />
Banks - 6.9% continued<br />
Heritage Commerce Corp. 12,065 $97<br />
Heritage Financial Corp. 8,615 146<br />
Heritage Oaks Bancorp* 11,307 91<br />
Home BancShares, Inc. 25,739 886<br />
Horizon Bancorp 4,959 110<br />
Hudson Valley Holding Corp. 9,386 179<br />
Iberiabank Corp. 16,896 1,185<br />
Independent Bank Corp. 13,472 530<br />
Independent Bank Group, Inc. 2,129 125<br />
International Bancshares Corp. 30,375 762<br />
Intervest Bancshares Corp.* 10,050 75<br />
Lakeland Bancorp, Inc. 20,378 229<br />
Lakeland Financial Corp. 9,344 376<br />
LCNB Corp. 4,331 75<br />
Macatawa Bank Corp. 13,332 67<br />
MainSource Financial Group, Inc. 11,630 199<br />
MB Financial, Inc. 31,156 965<br />
Mercantile Bank Corp. 5,008 103<br />
Merchants Bancshares, Inc. 3,145 103<br />
Metro Bancorp, Inc.* 8,057 170<br />
Middleburg Financial Corp. 3,131 55<br />
MidSouth Bancorp, Inc. 4,731 80<br />
MidWestOne Financial Group, Inc. 3,789 96<br />
National Bankshares, Inc. 3,963 145<br />
National Penn Bancshares, Inc. 66,543 695<br />
NBT Bancorp, Inc. 24,920 610<br />
NewBridge Bancorp* 14,388 103<br />
Northrim BanCorp, Inc. 3,725 96<br />
OFG Bancorp 25,962 446<br />
Old National Bancorp 57,638 859<br />
OmniAmerican Bancorp, Inc. 6,510 148<br />
Pacific Continental Corp. 10,297 142<br />
PacWest Bancorp 21,560 927<br />
Palmetto Bancshares, Inc.* 2,505 35<br />
Park National Corp. 6,559 504<br />
Park Sterling Corp. 25,493 170<br />
Peapack Gladstone Financial Corp. 6,424 141<br />
Penns Woods Bancorp, Inc. 2,747 134<br />
Peoples Bancorp, Inc. 6,161 152<br />
Pinnacle Financial Partners, Inc. 19,918 747<br />
Preferred Bank* 6,648 173<br />
PrivateBancorp, Inc. 36,934 1,127<br />
Prosperity Bancshares, Inc. 34,268 2,267<br />
Renasant Corp. 17,396 505<br />
NUMBER<br />
OF SHARES<br />
continued<br />
VALUE<br />
(000S)<br />
COMMON STOCKS - 97.1%<br />
Banks - 6.9% continued<br />
Republic Bancorp, Inc., Class A 5,428 $123<br />
S&T Bancorp, Inc. 16,930 401<br />
S.Y. Bancorp, Inc. 7,954 252<br />
Sandy Spring Bancorp, Inc. 14,213 355<br />
Seacoast Banking Corp. of Florida* 10,431 115<br />
Sierra Bancorp 6,997 111<br />
Simmons First National Corp., Class A 9,396 350<br />
Southside Bancshares, Inc. 10,168 319<br />
Southwest Bancorp, Inc. 11,246 199<br />
State Bank Financial Corp. 18,166 321<br />
Sterling Financial Corp. 19,328 644<br />
Suffolk Bancorp* 6,583 147<br />
Sun Bancorp, Inc.* 22,477 76<br />
Susquehanna Bancshares, Inc. 106,096 1,208<br />
Talmer Bancorp, Inc. Class A* 10,171 149<br />
Taylor Capital Group, Inc.* 9,833 235<br />
Texas Capital Bancshares, Inc.* 23,207 1,507<br />
Tompkins Financial Corp. 8,234 403<br />
TowneBank 15,007 233<br />
Trico Bancshares 9,122 237<br />
Tristate Capital Holdings, Inc.* 3,682 52<br />
TrustCo Bank Corp. NY 53,593 377<br />
Trustmark Corp. 38,187 968<br />
UMB Financial Corp. 20,299 1,313<br />
Umpqua Holdings Corp. 63,657 1,187<br />
Union First Market Bankshares Corp. 24,092 612<br />
United Bankshares, Inc. 36,960 1,132<br />
United Community Banks, Inc.* 24,471 475<br />
Univest Corp. of Pennsylvania 9,510 195<br />
VantageSouth Bancshares, Inc.* 6,766 48<br />
ViewPoint Financial Group, Inc. 22,734 656<br />
Walker & Dunlop, Inc.* 9,371 153<br />
Washington Banking Co. 8,823 157<br />
Washington Trust Bancorp, Inc. 8,253 309<br />
Webster Financial Corp. 51,336 1,594<br />
WesBanco, Inc. 14,747 469<br />
West Bancorporation, Inc. 8,170 124<br />
Westamerica Bancorporation 15,348 830<br />
Western Alliance Bancorp* 42,145 1,037<br />
Wilshire Bancorp, Inc. 38,546 428<br />
Wintrust Financial Corp. 24,354 1,185<br />
Yadkin Financial Corp.* 8,197 176<br />
67,512<br />
See Notes to the Financial Statements.<br />
EQUITY INDEX FUNDS 82 NORTHERN FUNDS ANNUAL REPORT
MARCH 31, 2014<br />
NUMBER<br />
OF SHARES<br />
continued<br />
VALUE<br />
(000S)<br />
COMMON STOCKS - 97.1%<br />
Beverages-0.2%<br />
Boston Beer (The) Co., Inc., Class A* 4,692 $1,148<br />
Coca-Cola Bottling Co. Consolidated 2,650 225<br />
Craft Brew Alliance, Inc.* 6,100 93<br />
Farmer Bros. Co.* 3,481 69<br />
National Beverage Corp.* 6,472 126<br />
1,661<br />
Biotechnology - 3.3%<br />
Acceleron Pharma, Inc.* 3,655 126<br />
Achillion Pharmaceuticals, Inc.* 55,000 181<br />
Acorda Therapeutics, Inc.* 23,101 876<br />
Aegerion Pharmaceuticals, Inc.* 16,405 757<br />
Alnylam Pharmaceuticals, Inc.* 33,080 2,221<br />
AMAG Pharmaceuticals, Inc.* 12,290 238<br />
Arena Pharmaceuticals, Inc.* 123,971 781<br />
Arqule, Inc.* 32,735 67<br />
BIND Therapeutics, Inc.* 2,895 35<br />
BioTime, Inc.* 21,480 71<br />
Bluebird Bio, Inc.* 3,798 86<br />
Cambrex Corp.* 17,086 322<br />
Cell Therapeutics, Inc.* 73,973 252<br />
Celladon Corp.* 3,596 43<br />
Celldex Therapeutics, Inc.* 50,749 897<br />
Cellular Dynamics International, Inc.* 2,138 32<br />
Chelsea Therapeutics International Ltd.* 44,689 247<br />
Coronado Biosciences, Inc.* 15,071 30<br />
Curis, Inc.* 48,885 138<br />
Cytokinetics, Inc.* 18,611 177<br />
Dendreon Corp.* 89,754 268<br />
Dicerna Pharmaceuticals, Inc.* 1,996 56<br />
Dynavax Technologies Corp.* 149,594 269<br />
Eleven Biotherapeutics, Inc.* 2,587 42<br />
Emergent Biosolutions, Inc.* 15,634 395<br />
Endocyte, Inc.* 17,345 413<br />
Enzon Pharmaceuticals, Inc. 21,906 23<br />
Epizyme, Inc.* 3,321 76<br />
Exact Sciences Corp.* 40,111 568<br />
Exelixis, Inc.* 104,675 371<br />
Fibrocell Science, Inc.* 12,268 64<br />
Five Prime Therapeutics, Inc.* 3,079 61<br />
Foundation Medicine, Inc.* 3,979 129<br />
Galena Biopharma, Inc.* 58,212 146<br />
Genocea Biosciences, Inc.* 2,208 40<br />
Geron Corp.* 87,688 182<br />
GlycoMimetics, Inc.* 4,577 75<br />
NUMBER<br />
OF SHARES<br />
continued<br />
VALUE<br />
(000S)<br />
COMMON STOCKS - 97.1%<br />
Biotechnology - 3.3% continued<br />
GTx, Inc.* 14,006 $21<br />
Halozyme Therapeutics, Inc.* 54,615 694<br />
Harvard Bioscience, Inc.* 14,871 70<br />
Idenix Pharmaceuticals, Inc.* 63,827 385<br />
ImmunoGen, Inc.* 48,142 719<br />
Immunomedics, Inc.* 41,756 176<br />
Insmed, Inc.* 19,696 375<br />
Intercept Pharmaceuticals, Inc.* 4,082 1,346<br />
InterMune, Inc.* 55,853 1,869<br />
Intrexon Corp.* 6,614 174<br />
Isis Pharmaceuticals, Inc.* 63,927 2,762<br />
Karyopharm Therapeutics, Inc.* 4,507 139<br />
KYTHERA Biopharmaceuticals, Inc.* 6,715 267<br />
Lexicon Pharmaceuticals, Inc.* 129,536 224<br />
Ligand Pharmaceuticals, Inc.* 10,142 682<br />
MacroGenics, Inc.* 3,323 92<br />
Marrone Bio Innovations, Inc.* 3,037 42<br />
Medicines (The) Co.* 36,002 1,023<br />
MEI Pharma, Inc.* 6,607 74<br />
Merrimack Pharmaceuticals, Inc.* 55,007 277<br />
Momenta Pharmaceuticals, Inc.* 26,890 313<br />
Nanosphere, Inc.* 31,927 69<br />
NeoGenomics, Inc.* 18,484 64<br />
NewLink Genetics Corp.* 9,621 273<br />
Novavax, Inc.* 105,905 480<br />
NPS Pharmaceuticals, Inc.* 57,105 1,709<br />
Omeros Corp.* 16,971 205<br />
OncoGenex Pharmaceutical, Inc.* 8,113 95<br />
OncoMed Pharmaceuticals, Inc.* 2,614 88<br />
Onconova Therapeutics, Inc.* 3,303 21<br />
OvaScience, Inc.* 5,038 45<br />
Pacific Biosciences of California, Inc.* 27,231 146<br />
PDL BioPharma, Inc. 91,172 758<br />
Peregrine Pharmaceuticals, Inc.* 91,382 174<br />
Prothena Corp. PLC* 8,103 310<br />
PTC Therapeutics, Inc.* 6,450 169<br />
Puma Biotechnology, Inc.* 13,226 1,377<br />
Repligen Corp.* 17,909 230<br />
Retrophin, Inc.* 10,800 230<br />
Rigel Pharmaceuticals, Inc.* 49,668 193<br />
RTI Surgical, Inc.* 32,081 131<br />
Sangamo BioSciences, Inc.* 37,917 686<br />
Sequenom, Inc.* 66,113 162<br />
Spectrum Pharmaceuticals, Inc.* 36,054 283<br />
See Notes to the Financial Statements.<br />
NORTHERN FUNDS ANNUAL REPORT 83 EQUITY INDEX FUNDS
SCHEDULE OF INVESTMENTS<br />
SMALL CAP INDEX FUND continued<br />
NUMBER<br />
OF SHARES<br />
continued<br />
VALUE<br />
(000S)<br />
COMMON STOCKS - 97.1%<br />
Biotechnology - 3.3% continued<br />
Stemline Therapeutics, Inc.* 5,474 $111<br />
Sunesis Pharmaceuticals, Inc.* 18,513 122<br />
Synageva BioPharma Corp.* 11,733 973<br />
Ultragenyx Pharmaceutical, Inc.* 3,766 184<br />
Veracyte, Inc.* 2,764 47<br />
Verastem, Inc.* 9,868 106<br />
Vical, Inc.* 43,759 56<br />
XOMA Corp.* 43,956 229<br />
ZIOPHARM Oncology, Inc.* 45,814 210<br />
32,415<br />
Building Materials - 1.2%<br />
AAON, Inc. 15,977 445<br />
Apogee Enterprises, Inc. 16,353 543<br />
Boise Cascade Co.* 7,011 201<br />
Builders FirstSource, Inc.* 25,452 232<br />
Comfort Systems USA, Inc. 21,156 322<br />
Continental Building Products, Inc.* 7,693 145<br />
Drew Industries, Inc. 13,040 707<br />
Gibraltar Industries, Inc.* 17,472 330<br />
Griffon Corp. 23,206 277<br />
Headwaters, Inc.* 41,584 549<br />
Louisiana-Pacific Corp.* 79,315 1,338<br />
LSI Industries, Inc. 12,126 99<br />
NCI Building Systems, Inc.* 11,796 206<br />
Nortek, Inc.* 5,131 422<br />
Patrick Industries, Inc.* 3,793 168<br />
PGT, Inc.* 18,877 217<br />
Ply Gem Holdings, Inc.* 8,994 114<br />
Quanex Building Products Corp. 21,096 436<br />
Simpson Manufacturing Co., Inc. 23,075 815<br />
Stock Building Supply Holdings, Inc.* 4,475 91<br />
Texas Industries, Inc.* 12,382 1,110<br />
Trex Co., Inc.* 9,780 716<br />
Universal Forest Products, Inc. 11,310 626<br />
US Concrete, Inc.* 8,051 189<br />
USG Corp.* 43,645 1,428<br />
11,726<br />
Chemicals - 2.0%<br />
A. Schulman, Inc. 16,738 607<br />
Aceto Corp. 15,592 313<br />
American Vanguard Corp. 16,283 353<br />
Axiall Corp. 39,722 1,784<br />
Balchem Corp. 16,887 880<br />
NUMBER<br />
OF SHARES<br />
continued<br />
VALUE<br />
(000S)<br />
COMMON STOCKS - 97.1%<br />
Chemicals - 2.0% continued<br />
Chemtura Corp.* 55,935 $1,415<br />
Ferro Corp.* 41,220 563<br />
H.B. Fuller Co. 28,624 1,382<br />
Hawkins, Inc. 5,361 197<br />
Innophos Holdings, Inc. 12,491 708<br />
Innospec, Inc. 13,372 605<br />
Intrepid Potash, Inc.* 31,139 481<br />
KMG Chemicals, Inc. 4,737 74<br />
Kraton Performance Polymers, Inc.* 18,513 484<br />
Landec Corp.* 14,756 165<br />
Minerals Technologies, Inc. 19,813 1,279<br />
Oil-Dri Corp. of America 2,769 96<br />
Olin Corp. 45,679 1,261<br />
OM Group, Inc. 18,182 604<br />
OMNOVA Solutions, Inc.* 26,783 278<br />
Penford Corp.* 5,394 77<br />
PolyOne Corp. 56,540 2,073<br />
Quaker Chemical Corp. 7,475 589<br />
Rentech, Inc.* 128,581 244<br />
Sensient Technologies Corp. 28,462 1,606<br />
Stepan Co. 10,716 692<br />
Taminco Corp.* 8,987 189<br />
Zep, Inc. 12,891 228<br />
19,227<br />
Coal - 0.3%<br />
Alpha Natural Resources, Inc.* 125,661 534<br />
Arch Coal, Inc. 120,786 582<br />
Cloud Peak Energy, Inc.* 34,607 732<br />
Hallador Energy Co. 5,221 45<br />
L&L Energy, Inc. (1) * 16,921 —<br />
SunCoke Energy, Inc.* 39,801 909<br />
Walter Energy, Inc. 35,611 269<br />
Westmoreland Coal Co.* 6,578 196<br />
3,267<br />
Commercial Services - 5.6%<br />
ABM Industries, Inc. 31,096 894<br />
Acacia Research Corp. 27,999 428<br />
Advisory Board (The) Co.* 20,206 1,298<br />
Albany Molecular Research, Inc.* 13,230 246<br />
American Public Education, Inc.* 10,013 351<br />
AMN Healthcare Services, Inc.* 26,201 360<br />
ARC Document Solutions, Inc.* 21,444 160<br />
Ascent Capital Group, Inc., Class A* 8,044 608<br />
See Notes to the Financial Statements.<br />
EQUITY INDEX FUNDS 84 NORTHERN FUNDS ANNUAL REPORT
MARCH 31, 2014<br />
NUMBER<br />
OF SHARES<br />
COMMON STOCKS - 97.1% continued<br />
Commercial Services - 5.6% continued<br />
VALUE<br />
(000S)<br />
AVEO Pharmaceuticals, Inc.* 29,418 $44<br />
Barrett Business Services, Inc. 4,010 239<br />
Bridgepoint Education, Inc.* 8,537 127<br />
Bright Horizons Family Solutions, Inc.* 6,751 264<br />
Brink’s (The) Co. 27,298 779<br />
Capella Education Co. 6,288 397<br />
Cardtronics, Inc.* 25,523 992<br />
Care.com, Inc.* 3,734 62<br />
Career Education Corp.* 31,416 234<br />
Carriage Services, Inc. 8,939 163<br />
CBIZ, Inc.* 20,309 186<br />
CDI Corp. 8,043 138<br />
Cenveo, Inc.* 31,145 95<br />
Chemed Corp. 10,033 897<br />
Convergys Corp. 59,782 1,310<br />
Corinthian Colleges, Inc.* 44,540 61<br />
Corporate Executive Board (The) Co. 19,133 1,420<br />
Corvel Corp.* 6,489 323<br />
CoStar Group, Inc.* 16,242 3,033<br />
CRA International, Inc.* 5,884 129<br />
Cross Country Healthcare, Inc.* 15,549 125<br />
Deluxe Corp. 28,943 1,519<br />
Education Management Corp.* 13,838 67<br />
Electro Rent Corp. 10,697 188<br />
Ennis, Inc. 14,888 247<br />
Euronet Worldwide, Inc.* 28,367 1,180<br />
EVERTEC, Inc. 16,794 415<br />
ExamWorks Group, Inc.* 18,268 640<br />
ExlService Holdings, Inc.* 18,572 574<br />
Forrester Research, Inc. 7,152 256<br />
Franklin Covey Co.* 5,119 101<br />
FTI Consulting, Inc.* 22,939 765<br />
Global Cash Access Holdings, Inc.* 37,699 259<br />
Grand Canyon Education, Inc.* 25,837 1,207<br />
Great Lakes Dredge & Dock Corp.* 33,816 309<br />
Green Dot Corp., Class A* 14,683 287<br />
H&E Equipment Services, Inc.* 16,905 684<br />
Hackett Group (The), Inc. 14,847 89<br />
Healthcare Services Group, Inc. 38,955 1,132<br />
Heartland Payment Systems, Inc. 20,672 857<br />
Heidrick & Struggles International, Inc. 10,289 206<br />
HMS Holdings Corp.* 49,925 951<br />
Huron Consulting Group, Inc.* 13,307 843<br />
ICF International, Inc.* 11,224 447<br />
NUMBER<br />
OF SHARES<br />
COMMON STOCKS - 97.1% continued<br />
Commercial Services - 5.6% continued<br />
VALUE<br />
(000S)<br />
Insperity, Inc. 12,787 $396<br />
Intersections, Inc. 5,090 30<br />
ITT Educational Services, Inc.* 13,294 381<br />
JTH Holding, Inc., Class A* 2,593 72<br />
K12, Inc.* 15,458 350<br />
Kelly Services, Inc., Class A 15,332 364<br />
Kforce, Inc. 15,413 329<br />
Korn/Ferry International* 27,699 825<br />
Landauer, Inc. 5,422 246<br />
LifeLock, Inc.* 36,441 623<br />
Lincoln Educational Services Corp. 13,803 52<br />
Live Nation Entertainment, Inc.* 80,089 1,742<br />
Matthews International Corp., Class A 15,709 641<br />
MAXIMUS, Inc. 38,874 1,744<br />
McGrath RentCorp 14,343 501<br />
Medifast, Inc.* 7,863 229<br />
MoneyGram International, Inc.* 12,202 215<br />
Monro Muffler Brake, Inc. 17,796 1,012<br />
Monster Worldwide, Inc.* 54,650 409<br />
Multi-Color Corp. 6,974 244<br />
National Research Corp., Class A* 5,519 92<br />
Navigant Consulting, Inc.* 28,715 536<br />
Odyssey Marine Exploration, Inc.* 46,527 107<br />
On Assignment, Inc.* 26,030 1,004<br />
PAREXEL International Corp.* 32,351 1,750<br />
Pendrell Corp.* 92,250 169<br />
Performant Financial Corp.* 12,720 115<br />
PHH Corp.* 32,486 839<br />
PRGX Global, Inc.* 16,428 114<br />
Providence Service (The) Corp.* 6,035 171<br />
Quad/Graphics, Inc. 14,223 334<br />
Rent-A-Center, Inc. 30,370 808<br />
Resources Connection, Inc. 23,232 327<br />
RPX Corp.* 18,437 300<br />
ServiceSource International, Inc.* 34,764 293<br />
SFX Entertainment, Inc.* 11,426 81<br />
Sotheby’s 38,851 1,692<br />
SP Plus Corp.* 8,775 230<br />
Steiner Leisure Ltd.* 8,350 386<br />
Strayer Education, Inc.* 6,150 286<br />
Swisher Hygiene, Inc.* 62,190 28<br />
Team Health Holdings, Inc.* 39,084 1,749<br />
Team, Inc.* 11,720 502<br />
TeleTech Holdings, Inc.* 11,330 278<br />
See Notes to the Financial Statements.<br />
NORTHERN FUNDS ANNUAL REPORT 85 EQUITY INDEX FUNDS
SCHEDULE OF INVESTMENTS<br />
SMALL CAP INDEX FUND continued<br />
NUMBER<br />
OF SHARES<br />
COMMON STOCKS - 97.1% continued<br />
Commercial Services - 5.6% continued<br />
VALUE<br />
(000S)<br />
Tree.com, Inc.* 3,652 $113<br />
TriNet Group, Inc.* 577 12<br />
TrueBlue, Inc.* 23,164 678<br />
Universal Technical Institute, Inc. 12,079 156<br />
Viad Corp. 11,572 278<br />
Vistaprint N.V.* 18,570 914<br />
WEX, Inc.* 22,080 2,099<br />
Xoom Corp.* 4,666 91<br />
55,523<br />
Computers - 1.9%<br />
A10 Networks, Inc.* 143 2<br />
Acorn Energy, Inc.* 12,127 41<br />
Agilysys, Inc.* 8,210 110<br />
CACI International, Inc., Class A* 13,098 967<br />
Carbonite, Inc.* 6,939 71<br />
CIBER, Inc.* 42,640 195<br />
Computer Task Group, Inc. 8,812 150<br />
Cray, Inc.* 22,551 842<br />
Datalink Corp.* 10,967 153<br />
Digimarc Corp. 3,659 115<br />
Electronics For Imaging, Inc.* 26,394 1,143<br />
EPAM Systems, Inc.* 12,436 409<br />
FleetMatics Group PLC* 9,898 331<br />
Fusion-io, Inc.* 46,439 489<br />
Hutchinson Technology, Inc.* 13,151 37<br />
iGATE Corp.* 19,820 625<br />
Imation Corp.* 19,642 113<br />
Immersion Corp.* 15,864 167<br />
Insight Enterprises, Inc.* 24,761 622<br />
j2 Global, Inc. 26,138 1,308<br />
KEYW Holding (The) Corp.* 18,154 340<br />
LivePerson, Inc.* 31,340 378<br />
Luxoft Holding, Inc.* 2,615 92<br />
Manhattan Associates, Inc.* 44,300 1,552<br />
Maxwell Technologies, Inc.* 16,652 215<br />
Mentor Graphics Corp. 54,255 1,195<br />
Mercury Systems, Inc.* 18,410 243<br />
Mitek Systems, Inc.* 14,541 56<br />
MTS Systems Corp. 8,994 616<br />
Netscout Systems, Inc.* 20,604 774<br />
Qualys, Inc.* 8,480 216<br />
Quantum Corp.* 120,774 147<br />
Radisys Corp.* 13,423 48<br />
RealD, Inc.* 23,039 257<br />
NUMBER<br />
OF SHARES<br />
continued<br />
VALUE<br />
(000S)<br />
COMMON STOCKS - 97.1%<br />
Computers - 1.9% continued<br />
Silicon Graphics International Corp.* 19,246 $236<br />
Silver Spring Networks, Inc.* 3,330 58<br />
Spansion, Inc., Class A* 26,911 469<br />
Super Micro Computer, Inc.* 18,118 315<br />
Sykes Enterprises, Inc.* 22,355 444<br />
Synaptics, Inc.* 18,485 1,109<br />
Syntel, Inc.* 8,778 789<br />
Uni-Pixel, Inc.* 5,681 44<br />
Unisys Corp.* 29,072 886<br />
Varonis Systems, Inc.* 3,014 108<br />
Violin Memory, Inc.* 10,231 41<br />
Virtusa Corp.* 12,941 434<br />
Vocera Communications, Inc.* 12,017 196<br />
19,148<br />
Cosmetics/Personal Care - 0.1%<br />
Elizabeth Arden, Inc.* 14,589 431<br />
Inter Parfums, Inc. 9,338 338<br />
Revlon, Inc., Class A* 6,470 165<br />
934<br />
Distribution/Wholesale - 1.0%<br />
Beacon Roofing Supply, Inc.* 27,711 1,071<br />
BlueLinx Holdings, Inc.* 18,084 23<br />
Core-Mark Holding Co., Inc. 6,530 474<br />
Houston Wire & Cable Co. 10,213 134<br />
MWI Veterinary Supply, Inc.* 7,285 1,134<br />
Owens & Minor, Inc. 36,010 1,261<br />
Pool Corp. 26,512 1,626<br />
Rentrak Corp.* 5,948 359<br />
ScanSource, Inc.* 15,862 647<br />
Speed Commerce, Inc.* 25,853 94<br />
Titan Machinery, Inc.* 9,808 154<br />
United Stationers, Inc. 23,079 948<br />
Watsco, Inc. 14,613 1,460<br />
9,385<br />
Diversified Financial Services - 2.5%<br />
Aircastle Ltd. 38,974 755<br />
Arlington Asset Investment Corp., Class A 9,104 241<br />
BGC Partners, Inc., Class A 72,329 473<br />
Blackhawk Network Holdings, Inc.* 6,547 160<br />
Calamos Asset Management, Inc., Class A 11,300 146<br />
California First National Bancorp 1,435 22<br />
CIFC Corp. 4,482 36<br />
Cohen & Steers, Inc. 10,717 427<br />
See Notes to the Financial Statements.<br />
EQUITY INDEX FUNDS 86 NORTHERN FUNDS ANNUAL REPORT
MARCH 31, 2014<br />
NUMBER<br />
OF SHARES<br />
COMMON STOCKS - 97.1% continued<br />
Diversified Financial Services - 2.5% continued<br />
VALUE<br />
(000S)<br />
Consumer Portfolio Services, Inc.* 10,153 $69<br />
Cowen Group, Inc., Class A* 55,599 245<br />
Credit Acceptance Corp.* 4,045 575<br />
DFC Global Corp.* 23,051 204<br />
Diamond Hill Investment Group, Inc. 1,606 211<br />
Doral Financial Corp.* 3,687 32<br />
Ellie Mae, Inc.* 14,974 432<br />
Encore Capital Group, Inc.* 14,230 650<br />
Evercore Partners, Inc., Class A 17,993 994<br />
FBR & Co.* 4,992 129<br />
Federal Agricultural Mortgage Corp.,<br />
Class C 5,863 195<br />
Financial Engines, Inc. 27,835 1,413<br />
First Marblehead (The) Corp.* 5,137 31<br />
FXCM, Inc., Class A 20,817 307<br />
Gain Capital Holdings, Inc. 6,186 67<br />
GAMCO Investors, Inc., Class A 3,430 266<br />
GFI Group, Inc. 39,697 141<br />
Greenhill & Co., Inc. 16,043 834<br />
Hannon Armstrong Sustainable<br />
Infrastructure Capital, Inc. 8,260 119<br />
Higher One Holdings, Inc.* 17,858 129<br />
Home Loan Servicing Solutions Ltd. 40,387 872<br />
Horizon Technology Finance Corp. 4,474 56<br />
Imperial Holdings, Inc.* 9,713 56<br />
INTL. FCStone, Inc.* 8,015 151<br />
Investment Technology Group, Inc.* 21,171 428<br />
Janus Capital Group, Inc. 84,910 923<br />
JGWPT Holdings, Inc., Class A* 5,631 103<br />
JMP Group, Inc. 8,609 61<br />
KCG Holdings, Inc., Class A* 40,436 482<br />
Ladder Capital Corp. Class A* 8,664 164<br />
Ladenburg Thalmann Financial<br />
Services, Inc.* 58,656 177<br />
Manning & Napier, Inc. 7,867 132<br />
MarketAxess Holdings, Inc. 21,337 1,264<br />
Marlin Business Services Corp. 4,764 99<br />
Medley Capital Corp. 26,675 363<br />
Nelnet, Inc., Class A 13,018 532<br />
NewStar Financial, Inc.* 14,943 207<br />
Nicholas Financial, Inc. 5,852 92<br />
Oppenheimer Holdings, Inc., Class A 5,700 160<br />
Outerwall, Inc.* 11,594 841<br />
PennyMac Financial Services, Inc.,<br />
Class A* 7,269 121<br />
NUMBER<br />
OF SHARES<br />
COMMON STOCKS - 97.1% continued<br />
Diversified Financial Services - 2.5% continued<br />
VALUE<br />
(000S)<br />
Piper Jaffray Cos.* 9,188 $421<br />
Portfolio Recovery Associates, Inc.* 28,856 1,670<br />
Pzena Investment Management, Inc.,<br />
Class A 6,433 76<br />
RCS Capital Corp., Class A 1,092 42<br />
Regional Management Corp.* 3,085 76<br />
Silvercrest Asset Management Group, Inc.,<br />
Class A 3,063 56<br />
Springleaf Holdings, Inc.* 13,799 347<br />
Stifel Financial Corp.* 36,173 1,800<br />
Stonegate Mortgage Corp.* 4,776 71<br />
SWS Group, Inc.* 16,662 125<br />
TPG Specialty Lending, Inc. 1,216 20<br />
Virtus Investment Partners, Inc.* 3,844 666<br />
WageWorks, Inc.* 14,204 797<br />
Walter Investment Management Corp.* 20,995 626<br />
Westwood Holdings Group, Inc. 3,970 249<br />
WhiteHorse Finance, Inc. 4,001 56<br />
WisdomTree Investments, Inc.* 57,165 750<br />
World Acceptance Corp.* 4,924 370<br />
ZAIS Financial Corp. 3,106 52<br />
24,857<br />
Electric - 2.0%<br />
ALLETE, Inc. 22,707 1,190<br />
Ameresco, Inc., Class A* 11,313 86<br />
Atlantic Power Corp. 68,212 198<br />
Avista Corp. 34,080 1,045<br />
Black Hills Corp. 25,292 1,458<br />
Cleco Corp. 34,394 1,740<br />
Dynegy, Inc.* 56,912 1,419<br />
El Paso Electric Co. 22,890 818<br />
Empire District Electric (The) Co. 24,277 590<br />
EnerNOC, Inc.* 14,948 333<br />
Genie Energy Ltd., Class B* 7,269 73<br />
IDACORP, Inc. 28,574 1,585<br />
MGE Energy, Inc. 19,755 775<br />
NorthWestern Corp. 21,557 1,022<br />
NRG Yield, Inc., Class A 12,818 507<br />
Ormat Technologies, Inc. 10,072 302<br />
Otter Tail Corp. 20,654 636<br />
Pike Corp.* 14,762 159<br />
PNM Resources, Inc. 45,323 1,225<br />
PNM Resources, Inc. - (Fractional Shares)* 50,000 —<br />
Portland General Electric Co. 43,048 1,392<br />
See Notes to the Financial Statements.<br />
NORTHERN FUNDS ANNUAL REPORT 87 EQUITY INDEX FUNDS
SCHEDULE OF INVESTMENTS<br />
SMALL CAP INDEX FUND continued<br />
NUMBER<br />
OF SHARES<br />
continued<br />
VALUE<br />
(000S)<br />
COMMON STOCKS - 97.1%<br />
Electric - 2.0% continued<br />
UIL Holdings Corp. 32,143 $1,183<br />
Unitil Corp. 7,888 259<br />
UNS Energy Corp. 23,593 1,416<br />
19,411<br />
Electrical Components & Equipment - 1.6%<br />
Acuity Brands, Inc. 24,378 3,232<br />
Advanced Energy Industries, Inc.* 22,341 547<br />
American Superconductor Corp.* 26,834 43<br />
Belden, Inc. 25,053 1,744<br />
Capstone Turbine Corp.* 173,430 369<br />
Encore Wire Corp. 11,766 571<br />
EnerSys, Inc. 27,382 1,897<br />
Generac Holdings, Inc. 29,337 1,730<br />
General Cable Corp. 28,321 725<br />
GrafTech International Ltd.* 66,505 726<br />
Graham Corp. 5,696 181<br />
Insteel Industries, Inc. 10,262 202<br />
Littelfuse, Inc. 12,578 1,178<br />
Powell Industries, Inc. 5,245 340<br />
PowerSecure International, Inc.* 12,313 289<br />
Revolution Lighting Technologies, Inc.* 16,674 53<br />
SunPower Corp.* 23,464 757<br />
Universal Display Corp.* 22,891 730<br />
Vicor Corp.* 10,076 103<br />
15,417<br />
Electronics - 2.1%<br />
American Science & Engineering, Inc. 4,650 312<br />
Analogic Corp. 6,965 572<br />
Applied Optoelectronics, Inc.* 2,274 56<br />
Badger Meter, Inc. 8,177 451<br />
Bel Fuse, Inc., Class B 5,672 124<br />
Benchmark Electronics, Inc.* 30,914 700<br />
Brady Corp., Class A 26,308 714<br />
Checkpoint Systems, Inc.* 23,350 313<br />
Coherent, Inc.* 13,848 905<br />
Control4 Corp.* 2,557 54<br />
CTS Corp. 19,080 398<br />
Electro Scientific Industries, Inc. 13,330 131<br />
ESCO Technologies, Inc. 15,046 530<br />
FARO Technologies, Inc.* 9,727 516<br />
FEI Co. 23,750 2,447<br />
Fluidigm Corp.* 14,470 638<br />
GSI Group, Inc.* 17,322 226<br />
NUMBER<br />
OF SHARES<br />
continued<br />
VALUE<br />
(000S)<br />
COMMON STOCKS - 97.1%<br />
Electronics - 2.1% continued<br />
II-VI, Inc.* 29,066 $449<br />
InvenSense, Inc.* 32,303 765<br />
Itron, Inc.* 22,496 800<br />
Kemet Corp.* 25,574 149<br />
Measurement Specialties, Inc.* 8,784 596<br />
Mesa Laboratories, Inc. 1,508 136<br />
Methode Electronics, Inc. 21,091 647<br />
Multi-Fineline Electronix, Inc.* 4,958 63<br />
Newport Corp.* 22,245 460<br />
NVE Corp.* 2,774 158<br />
OSI Systems, Inc.* 11,344 679<br />
Park Electrochemical Corp. 11,863 354<br />
Plexus Corp.* 19,402 777<br />
Rofin-Sinar Technologies, Inc.* 16,095 386<br />
Rogers Corp.* 10,300 643<br />
Sanmina Corp.* 47,103 822<br />
Sparton Corp.* 5,825 171<br />
Stoneridge, Inc.* 16,219 182<br />
Taser International, Inc.* 29,150 533<br />
TTM Technologies, Inc.* 30,126 255<br />
Viasystems Group, Inc.* 2,155 27<br />
Vishay Precision Group, Inc.* 7,031 122<br />
Watts Water Technologies, Inc., Class A 16,228 952<br />
Woodward, Inc. 39,131 1,625<br />
ZAGG, Inc.* 17,321 80<br />
Zygo Corp.* 9,475 144<br />
21,062<br />
Energy - Alternate Sources - 0.2%<br />
Amyris, Inc.* 14,467 54<br />
Clean Energy Fuels Corp.* 38,758 347<br />
Enphase Energy, Inc.* 8,972 66<br />
FuelCell Energy, Inc.* 112,583 279<br />
FutureFuel Corp. 12,367 251<br />
Green Plains Renewable Energy, Inc. 14,385 431<br />
KiOR, Inc., Class A* 24,707 14<br />
Pattern Energy Group, Inc. 10,470 284<br />
Renewable Energy Group, Inc.* 12,025 144<br />
REX American Resources Corp.* 3,113 178<br />
Solazyme, Inc.* 27,222 316<br />
2,364<br />
Engineering & Construction - 0.8%<br />
Aegion Corp.* 22,262 563<br />
Argan, Inc. 7,951 236<br />
See Notes to the Financial Statements.<br />
EQUITY INDEX FUNDS 88 NORTHERN FUNDS ANNUAL REPORT
MARCH 31, 2014<br />
NUMBER<br />
OF SHARES<br />
COMMON STOCKS - 97.1% continued<br />
Engineering & Construction - 0.8% continued<br />
VALUE<br />
(000S)<br />
Dycom Industries, Inc.* 18,809 $595<br />
EMCOR Group, Inc. 38,183 1,787<br />
Engility Holdings, Inc.* 9,768 440<br />
Exponent, Inc. 7,508 564<br />
Granite Construction, Inc. 22,090 882<br />
Layne Christensen Co.* 11,325 206<br />
MasTec, Inc.* 33,797 1,468<br />
Mistras Group, Inc.* 9,049 206<br />
MYR Group, Inc.* 11,941 302<br />
Orion Marine Group, Inc.* 15,544 195<br />
Sterling Construction Co., Inc.* 9,575 83<br />
Tutor Perini Corp.* 21,093 605<br />
VSE Corp. 2,350 124<br />
8,256<br />
Entertainment - 0.7%<br />
AMC Entertainment Holdings, Inc.,<br />
Class A* 11,970 290<br />
Carmike Cinemas, Inc.* 13,105 391<br />
Churchill Downs, Inc. 7,826 715<br />
International Speedway Corp., Class A 15,842 539<br />
Isle of Capri Casinos, Inc.* 12,088 93<br />
Marriott Vacations Worldwide Corp.* 16,588 927<br />
Multimedia Games Holding Co., Inc.* 16,426 477<br />
National CineMedia, Inc. 34,317 515<br />
Pinnacle Entertainment, Inc.* 33,232 788<br />
Reading International, Inc., Class A* 9,820 72<br />
Scientific Games Corp., Class A* 27,176 373<br />
Speedway Motorsports, Inc. 6,644 124<br />
Vail Resorts, Inc. 20,435 1,424<br />
6,728<br />
Environmental Control - 0.6%<br />
Advanced Emissions Solutions, Inc.* 12,236 300<br />
Calgon Carbon Corp.* 30,741 671<br />
Casella Waste Systems, Inc., Class A* 22,067 113<br />
Ceco Environmental Corp. 10,024 166<br />
Darling International, Inc.* 90,034 1,802<br />
Energy Recovery, Inc.* 25,161 134<br />
Heritage-Crystal Clean, Inc.* 5,047 92<br />
MSA Safety, Inc. 16,115 919<br />
Nuverra Environmental Solutions, Inc.* 7,960 162<br />
Pure Cycle Corp.* 9,665 58<br />
Tetra Tech, Inc.* 36,954 1,093<br />
TRC Cos., Inc.* 9,108 61<br />
NUMBER<br />
OF SHARES<br />
COMMON STOCKS - 97.1% continued<br />
Environmental Control - 0.6% continued<br />
VALUE<br />
(000S)<br />
US Ecology, Inc. 12,249 $455<br />
6,026<br />
Food - 1.9%<br />
Annie’s, Inc.* 7,790 313<br />
B&G Foods, Inc. 30,076 906<br />
Boulder Brands, Inc.* 33,867 597<br />
Calavo Growers, Inc. 6,957 248<br />
Cal-Maine Foods, Inc. 8,447 530<br />
Chefs’ Warehouse (The), Inc.* 9,405 201<br />
Chiquita Brands International, Inc.* 26,455 329<br />
Diamond Foods, Inc.* 12,669 443<br />
Fairway Group Holdings Corp.* 8,933 68<br />
Fresh Del Monte Produce, Inc. 21,539 594<br />
Hain Celestial Group (The), Inc.* 21,853 1,999<br />
Ingles Markets, Inc., Class A 6,750 161<br />
Inventure Foods, Inc.* 8,000 112<br />
J&J Snack Foods Corp. 8,495 815<br />
John B. Sanfilippo & Son, Inc. 4,652 107<br />
Lancaster Colony Corp. 10,533 1,047<br />
Lifeway Foods, Inc. 2,538 37<br />
Nutrisystem, Inc. 16,283 245<br />
Pilgrim’s Pride Corp.* 34,485 721<br />
Post Holdings, Inc.* 21,865 1,205<br />
Sanderson Farms, Inc. 13,094 1,028<br />
Seaboard Corp.* 167 438<br />
Seneca Foods Corp., Class A* 4,696 148<br />
Snyder’s-Lance, Inc. 27,065 763<br />
Spartan Stores, Inc. 20,843 484<br />
SUPERVALU, Inc.* 115,549 790<br />
Tootsie Roll Industries, Inc. 11,471 344<br />
TreeHouse Foods, Inc.* 20,621 1,485<br />
United Natural Foods, Inc.* 28,065 1,990<br />
Village Super Market, Inc., Class A 3,607 95<br />
Weis Markets, Inc. 6,275 309<br />
18,552<br />
Forest Products & Paper - 0.6%<br />
Clearwater Paper Corp.* 11,981 751<br />
Deltic Timber Corp. 6,345 414<br />
KapStone Paper and Packaging Corp.* 46,478 1,341<br />
Neenah Paper, Inc. 9,095 470<br />
Orchids Paper Products Co. 3,401 104<br />
PH Glatfelter Co. 24,430 665<br />
Resolute Forest Products, Inc.* 39,740 798<br />
See Notes to the Financial Statements.<br />
NORTHERN FUNDS ANNUAL REPORT 89 EQUITY INDEX FUNDS
SCHEDULE OF INVESTMENTS<br />
SMALL CAP INDEX FUND continued<br />
NUMBER<br />
OF SHARES<br />
COMMON STOCKS - 97.1% continued<br />
Forest Products & Paper - 0.6% continued<br />
VALUE<br />
(000S)<br />
Schweitzer-Mauduit International, Inc. 17,858 $761<br />
Wausau Paper Corp. 28,137 358<br />
Xerium Technologies, Inc.* 6,130 98<br />
5,760<br />
Gas-0.8%<br />
Chesapeake Utilities Corp. 5,472 346<br />
Delta Natural Gas Co., Inc. 3,862 80<br />
Laclede Group (The), Inc. 18,558 875<br />
New Jersey Resources Corp. 23,778 1,184<br />
Northwest Natural Gas Co. 15,302 673<br />
Piedmont Natural Gas Co., Inc. 42,946 1,520<br />
South Jersey Industries, Inc. 18,187 1,020<br />
Southwest Gas Corp. 26,352 1,409<br />
WGL Holdings, Inc. 29,426 1,179<br />
8,286<br />
Hand/Machine Tools - 0.1%<br />
Franklin Electric Co., Inc. 26,992 1,148<br />
Hardinge, Inc. 6,528 94<br />
1,242<br />
Healthcare - Products - 3.6%<br />
Abaxis, Inc.* 12,579 489<br />
ABIOMED, Inc.* 22,042 574<br />
Accelerate Diagnostics, Inc.* 6,209 135<br />
Accuray, Inc.* 42,191 405<br />
Affymetrix, Inc.* 40,457 288<br />
Align Technology, Inc.* 41,624 2,156<br />
Alphatec Holdings, Inc.* 34,842 52<br />
AngioDynamics, Inc.* 14,019 221<br />
ArthroCare Corp.* 16,045 773<br />
AtriCure, Inc.* 13,737 258<br />
Atrion Corp. 890 273<br />
Biolase, Inc.* 19,809 48<br />
Cantel Medical Corp. 18,655 629<br />
Cardiovascular Systems, Inc.* 13,978 444<br />
Cepheid, Inc.* 38,203 1,971<br />
Cerus Corp.* 39,698 191<br />
Chindex International, Inc.* 7,284 139<br />
CONMED Corp. 15,778 686<br />
CryoLife, Inc. 15,634 156<br />
Cutera, Inc.* 8,245 92<br />
Cyberonics, Inc.* 15,727 1,026<br />
Cynosure, Inc., Class A* 10,905 320<br />
DexCom, Inc.* 40,238 1,664<br />
NUMBER<br />
OF SHARES<br />
COMMON STOCKS - 97.1% continued<br />
Healthcare - Products - 3.6% continued<br />
VALUE<br />
(000S)<br />
Endologix, Inc.* 35,744 $460<br />
Exactech, Inc.* 5,326 120<br />
Female Health (The) Co. 12,196 95<br />
GenMark Diagnostics, Inc.* 20,413 203<br />
Genomic Health, Inc.* 9,534 251<br />
Globus Medical, Inc., Class A* 31,077 826<br />
Greatbatch, Inc.* 13,602 625<br />
Haemonetics Corp.* 29,066 947<br />
Hanger, Inc.* 19,728 664<br />
Harvard Apparatus Regenerative<br />
Technology, Inc.* 3,704 34<br />
HeartWare International, Inc.* 9,304 873<br />
ICU Medical, Inc.* 7,369 441<br />
Inogen, Inc.* 2,885 48<br />
Insulet Corp.* 30,416 1,442<br />
Integra LifeSciences Holdings Corp.* 13,029 599<br />
Invacare Corp. 18,217 347<br />
LDR Holding Corp.* 3,359 115<br />
Luminex Corp.* 21,262 385<br />
Masimo Corp.* 27,718 757<br />
Medical Action Industries, Inc.* 8,177 57<br />
Merge Healthcare, Inc.* 36,698 90<br />
Meridian Bioscience, Inc. 23,602 514<br />
Merit Medical Systems, Inc.* 24,223 346<br />
MiMedx Group, Inc.* 51,699 317<br />
Natus Medical, Inc.* 17,295 446<br />
Navidea Biopharmaceuticals, Inc.* 68,114 126<br />
NuVasive, Inc.* 25,171 967<br />
NxStage Medical, Inc.* 34,003 433<br />
OraSure Technologies, Inc.* 31,611 252<br />
Orthofix International N.V.* 11,072 334<br />
Oxford Immunotec Global PLC* 3,384 68<br />
PhotoMedex, Inc.* 7,631 121<br />
Quidel Corp.* 15,986 436<br />
Rockwell Medical, Inc.* 22,341 283<br />
Spectranetics Corp.* 22,963 696<br />
Staar Surgical Co.* 20,921 393<br />
STERIS Corp. 33,531 1,601<br />
SurModics, Inc.* 7,822 177<br />
Symmetry Medical, Inc.* 21,230 214<br />
Tandem Diabetes Care, Inc.* 5,237 116<br />
TearLab Corp.* 16,521 112<br />
Thoratec Corp.* 32,625 1,168<br />
Tornier N.V.* 14,801 314<br />
Unilife Corp.* 55,336 225<br />
See Notes to the Financial Statements.<br />
EQUITY INDEX FUNDS 90 NORTHERN FUNDS ANNUAL REPORT
MARCH 31, 2014<br />
NUMBER<br />
OF SHARES<br />
COMMON STOCKS - 97.1% continued<br />
Healthcare - Products - 3.6% continued<br />
VALUE<br />
(000S)<br />
Utah Medical Products, Inc. 1,848 $107<br />
Vascular Solutions, Inc.* 9,402 246<br />
Volcano Corp.* 31,042 612<br />
West Pharmaceutical Services, Inc. 39,362 1,734<br />
Wright Medical Group, Inc.* 22,987 714<br />
Zeltiq Aesthetics, Inc.* 10,061 197<br />
35,638<br />
Healthcare - Services - 1.6%<br />
Acadia Healthcare Co., Inc.* 20,153 909<br />
Addus HomeCare Corp.* 3,073 71<br />
Air Methods Corp.* 22,127 1,182<br />
Alliance HealthCare Services, Inc.* 2,803 94<br />
Almost Family, Inc.* 4,726 109<br />
Amedisys, Inc.* 17,911 267<br />
Amsurg Corp.* 18,196 857<br />
Bio-Reference Labs, Inc.* 13,913 385<br />
Capital Senior Living Corp.* 16,305 424<br />
Centene Corp.* 30,970 1,928<br />
Emeritus Corp.* 22,947 721<br />
Ensign Group (The), Inc. 11,058 483<br />
Five Star Quality Care, Inc.* 24,390 118<br />
Gentiva Health Services, Inc.* 17,833 163<br />
HealthSouth Corp. 49,605 1,782<br />
Healthways, Inc.* 19,463 334<br />
IPC The Hospitalist Co., Inc.* 9,537 468<br />
Kindred Healthcare, Inc. 30,751 720<br />
LHC Group, Inc.* 6,866 151<br />
Magellan Health Services, Inc.* 15,396 914<br />
Molina Healthcare, Inc.* 16,125 606<br />
National Healthcare Corp. 6,123 341<br />
Select Medical Holdings Corp. 27,689 345<br />
Skilled Healthcare Group, Inc., Class A* 11,199 59<br />
Surgical Care Affiliates, Inc.* 6,401 197<br />
Triple-S Management Corp., Class B* 13,459 217<br />
U.S. Physical Therapy, Inc. 6,872 238<br />
Universal American Corp. 22,071 156<br />
USMD Holdings, Inc.* 609 8<br />
WellCare Health Plans, Inc.* 24,733 1,571<br />
15,818<br />
Holding Companies - Diversified - 0.1%<br />
Harbinger Group, Inc.* 18,811 230<br />
Horizon Pharma, Inc.* 31,600 478<br />
National Bank Holdings Corp., Class A 25,862 519<br />
NUMBER<br />
OF SHARES<br />
COMMON STOCKS - 97.1% continued<br />
Holding Companies - Diversified - 0.1% continued<br />
VALUE<br />
(000S)<br />
Resource America, Inc., Class A 7,093 $61<br />
1,288<br />
Home Builders - 0.7%<br />
Beazer Homes USA, Inc.* 14,287 287<br />
Cavco Industries, Inc.* 3,972 312<br />
Hovnanian Enterprises, Inc., Class A* 64,459 305<br />
Installed Building Products, Inc.* 4,871 68<br />
KB Home 47,556 808<br />
LGI Homes, Inc.* 5,231 90<br />
M/I Homes, Inc.* 13,763 309<br />
MDC Holdings, Inc. 22,237 629<br />
Meritage Homes Corp.* 22,041 923<br />
New Home (The) Co., Inc.* 5,109 73<br />
Ryland Group (The), Inc. 26,251 1,048<br />
Standard Pacific Corp.* 84,339 701<br />
TRI Pointe Homes, Inc.* 8,510 138<br />
UCP, Inc., Class A* 4,309 65<br />
WCI Communities, Inc.* 3,791 75<br />
William Lyon Homes, Class A* 7,838 216<br />
Winnebago Industries, Inc.* 15,972 437<br />
6,484<br />
Home Furnishings - 0.5%<br />
American Woodmark Corp.* 5,653 190<br />
Bassett Furniture Industries, Inc. 6,188 92<br />
Daktronics, Inc. 20,793 299<br />
DTS, Inc.* 10,401 206<br />
Ethan Allen Interiors, Inc. 14,133 360<br />
Flexsteel Industries, Inc. 2,797 105<br />
Hooker Furniture Corp. 6,135 96<br />
iRobot Corp.* 16,084 660<br />
Kimball International, Inc., Class B 18,467 334<br />
La-Z-Boy, Inc. 29,797 807<br />
Norcraft Cos., Inc.* 4,294 73<br />
Select Comfort Corp.* 31,670 573<br />
Skullcandy, Inc.* 10,069 92<br />
TiVo, Inc.* 72,002 953<br />
Universal Electronics, Inc.* 8,535 328<br />
VOXX International Corp.* 10,656 146<br />
5,314<br />
Household Products/Wares - 0.4%<br />
ACCO Brands Corp.* 64,630 398<br />
Blyth, Inc. 5,151 55<br />
Central Garden and Pet Co., Class A* 23,823 197<br />
See Notes to the Financial Statements.<br />
NORTHERN FUNDS ANNUAL REPORT 91 EQUITY INDEX FUNDS
SCHEDULE OF INVESTMENTS<br />
SMALL CAP INDEX FUND continued<br />
NUMBER<br />
OF SHARES<br />
COMMON STOCKS - 97.1% continued<br />
Household Products/Wares - 0.4% continued<br />
VALUE<br />
(000S)<br />
CSS Industries, Inc. 4,825 $130<br />
Helen of Troy Ltd.* 18,154 1,257<br />
Spectrum Brands Holdings, Inc. 12,240 976<br />
Tumi Holdings, Inc.* 27,247 617<br />
WD-40 Co. 8,805 683<br />
4,313<br />
Housewares - 0.0%<br />
EveryWare Global, Inc.* 5,534 25<br />
Libbey, Inc.* 11,957 311<br />
Lifetime Brands, Inc. 5,855 105<br />
441<br />
Insurance - 2.6%<br />
Ambac Financial Group, Inc.* 25,608 795<br />
American <strong>Equity</strong> Investment Life<br />
Holding Co. 36,376 859<br />
AMERISAFE, Inc. 10,446 459<br />
AmTrust Financial Services, Inc. 17,645 664<br />
Argo Group International Holdings Ltd. 15,433 708<br />
Baldwin & Lyons, Inc., Class B 5,248 138<br />
Blue Capital Reinsurance Holdings Ltd.* 3,412 59<br />
Citizens, Inc.* 24,722 183<br />
CNO Financial Group, Inc. 126,327 2,286<br />
Crawford & Co., Class B 14,939 163<br />
Donegal Group, Inc., Class A 4,173 61<br />
eHealth, Inc.* 10,479 532<br />
EMC Insurance Group, Inc. 2,562 91<br />
Employers Holdings, Inc. 17,588 356<br />
Enstar Group Ltd.* 5,413 738<br />
Essent Group Ltd.* 12,901 290<br />
FBL Financial Group, Inc., Class A 5,025 218<br />
Fidelity & Guaranty Life 6,506 154<br />
First American Financial Corp. 61,524 1,633<br />
Fortegra Financial Corp.* 3,858 27<br />
Global Indemnity PLC* 4,760 125<br />
Greenlight Capital Re Ltd., Class A* 15,996 525<br />
Hallmark Financial Services, Inc.* 7,982 66<br />
HCI Group, Inc. 5,564 203<br />
Health Insurance Innovations, Inc.,<br />
Class A* 2,437 25<br />
Hilltop Holdings, Inc.* 37,896 902<br />
Horace Mann Educators Corp. 22,549 654<br />
Independence Holding Co. 4,430 59<br />
Infinity Property & Casualty Corp. 6,546 443<br />
Investors Title Co. 744 56<br />
NUMBER<br />
OF SHARES<br />
continued<br />
VALUE<br />
(000S)<br />
COMMON STOCKS - 97.1%<br />
Insurance - 2.6% continued<br />
Kansas City Life Insurance Co. 2,232 $108<br />
Maiden Holdings Ltd. 28,316 353<br />
Meadowbrook Insurance Group, Inc. 28,384 165<br />
MGIC Investment Corp.* 184,529 1,572<br />
Montpelier Re Holdings Ltd. 23,449 698<br />
National Interstate Corp. 3,719 100<br />
National Western Life Insurance Co.,<br />
Class A 1,242 304<br />
Navigators Group (The), Inc.* 5,873 361<br />
OneBeacon Insurance Group Ltd., Class A 12,732 197<br />
Phoenix (The) Cos., Inc.* 3,297 171<br />
Platinum Underwriters Holdings Ltd. 15,599 937<br />
Primerica, Inc. 32,354 1,524<br />
Radian Group, Inc. 98,373 1,479<br />
RLI Corp. 24,192 1,070<br />
Safety Insurance Group, Inc. 7,303 393<br />
Selective Insurance Group, Inc. 31,498 735<br />
State Auto Financial Corp. 8,505 181<br />
Stewart Information Services Corp. 12,102 425<br />
Symetra Financial Corp. 46,258 917<br />
Third Point Reinsurance Ltd.* 14,412 228<br />
Tower Group International Ltd. 32,277 87<br />
United Fire Group, Inc. 11,705 355<br />
Universal Insurance Holdings, Inc. 14,788 188<br />
26,020<br />
Internet - 2.3%<br />
1-800-Flowers.com, Inc., Class A* 14,563 82<br />
Angie’s List, Inc.* 24,046 293<br />
Bankrate, Inc.* 26,313 446<br />
Barracuda Networks, Inc.* 2,415 82<br />
Bazaarvoice, Inc.* 27,351 200<br />
Blucora, Inc.* 23,320 459<br />
Blue Nile, Inc.* 7,045 245<br />
Boingo Wireless, Inc.* 10,472 71<br />
Borderfree, Inc.* 536 10<br />
Brightcove, Inc.* 16,003 157<br />
BroadSoft, Inc.* 15,957 427<br />
ChannelAdvisor Corp.* 3,624 137<br />
Chegg, Inc.* 8,828 62<br />
Cogent Communications Group, Inc. 26,868 955<br />
comScore, Inc.* 20,302 666<br />
Constant Contact, Inc.* 17,475 427<br />
Conversant, Inc.* 37,976 1,069<br />
Covisint Corp.* 4,039 30<br />
See Notes to the Financial Statements.<br />
EQUITY INDEX FUNDS 92 NORTHERN FUNDS ANNUAL REPORT
MARCH 31, 2014<br />
NUMBER<br />
OF SHARES<br />
continued<br />
VALUE<br />
(000S)<br />
COMMON STOCKS - 97.1%<br />
Internet - 2.3% continued<br />
CyrusOne, Inc. 10,917 $227<br />
Dice Holdings, Inc.* 21,692 162<br />
eGain Corp.* 7,352 52<br />
Endurance International Group<br />
Holdings, Inc.* 12,395 161<br />
ePlus, Inc.* 2,098 117<br />
FTD Cos., Inc.* 10,521 335<br />
Global Eagle Entertainment, Inc.* 15,993 252<br />
Global Sources Ltd.* 10,647 95<br />
HealthStream, Inc.* 11,472 306<br />
Internap Network Services Corp.* 30,502 216<br />
Intralinks Holdings, Inc.* 21,843 223<br />
Limelight Networks, Inc.* 30,811 67<br />
Lionbridge Technologies, Inc.* 33,143 222<br />
Liquidity Services, Inc.* 14,141 368<br />
magicJack VocalTec Ltd.* 10,566 224<br />
Marketo, Inc.* 3,965 130<br />
Mavenir Systems, Inc.* 3,079 55<br />
ModusLink Global Solutions, Inc.* 21,169 90<br />
Move, Inc.* 22,676 262<br />
Net Element, Inc.* 1,754 6<br />
NIC, Inc. 36,907 713<br />
OpenTable, Inc.* 12,963 997<br />
Orbitz Worldwide, Inc.* 13,668 107<br />
Overstock.com, Inc.* 6,396 126<br />
PC-Tel, Inc. 10,511 92<br />
Perficient, Inc.* 19,059 345<br />
Q2 Holdings, Inc.* 337 5<br />
QuinStreet, Inc.* 17,817 118<br />
ReachLocal, Inc.* 5,757 57<br />
RealNetworks, Inc.* 12,780 97<br />
Reis, Inc.* 4,681 85<br />
RetailMeNot, Inc.* 5,382 172<br />
RingCentral, Inc., Class A* 5,012 91<br />
Safeguard Scientifics, Inc.* 11,944 265<br />
Sapient Corp.* 62,808 1,072<br />
Shutterfly, Inc.* 21,608 922<br />
Shutterstock, Inc.* 4,218 306<br />
Spark Networks, Inc.* 9,889 52<br />
SPS Commerce, Inc.* 9,118 560<br />
Stamps.com, Inc.* 7,422 249<br />
support.com, Inc.* 30,248 77<br />
TechTarget, Inc.* 6,409 46<br />
TeleCommunication Systems, Inc., Class A* 26,734 61<br />
Textura Corp.* 3,197 81<br />
NUMBER<br />
OF SHARES<br />
continued<br />
VALUE<br />
(000S)<br />
COMMON STOCKS - 97.1%<br />
Internet - 2.3% continued<br />
Towerstream Corp.* 37,374 $88<br />
Travelzoo, Inc.* 4,460 102<br />
Tremor Video, Inc.* 4,170 17<br />
Trulia, Inc.* 15,757 523<br />
United Online, Inc. 7,633 88<br />
Unwired Planet, Inc.* 56,331 122<br />
VASCO Data Security International, Inc.* 16,223 122<br />
VirnetX Holding Corp.* 24,028 341<br />
Vitacost.com, Inc.* 12,953 92<br />
Vocus, Inc.* 10,692 143<br />
Web.com Group, Inc.* 23,853 812<br />
WebMD Health Corp.* 16,176 670<br />
Wix.com Ltd.* 4,770 110<br />
XO Group, Inc.* 15,226 154<br />
Yelp, Inc.* 18,476 1,421<br />
YuMe, Inc.* 2,889 21<br />
Zillow, Inc., Class A* 13,260 1,168<br />
Zix Corp.* 35,397 147<br />
22,225<br />
Investment Companies - 1.1%<br />
Apollo Investment Corp. 127,824 1,062<br />
BlackRock Kelso Capital Corp. 42,112 386<br />
Capital Southwest Corp. 7,662 266<br />
Capitala Finance Corp. 2,200 42<br />
Fidus Investment Corp. 7,806 151<br />
Fifth Street Finance Corp. 77,735 735<br />
Firsthand Technology Value Fund, Inc. 5,190 111<br />
Garrison Capital, Inc. 3,339 47<br />
Gladstone Capital Corp. 11,963 121<br />
Gladstone Investment Corp. 15,206 126<br />
Golub Capital BDC, Inc. 21,226 379<br />
GSV Capital Corp.* 10,998 111<br />
Hercules Technology Growth Capital, Inc. 35,021 493<br />
KCAP Financial, Inc. 16,102 139<br />
Main Street Capital Corp. 22,220 730<br />
MCG Capital Corp. 40,543 154<br />
Medallion Financial Corp. 12,111 160<br />
MVC Capital, Inc. 12,860 174<br />
New Mountain Finance Corp. 25,671 373<br />
NGP Capital Resources Co. 11,777 80<br />
PennantPark Floating Rate Capital Ltd. 8,417 116<br />
PennantPark Investment Corp. 37,805 418<br />
Prospect Capital Corp. 176,685 1,908<br />
Solar Capital Ltd. 25,606 558<br />
See Notes to the Financial Statements.<br />
NORTHERN FUNDS ANNUAL REPORT 93 EQUITY INDEX FUNDS
SCHEDULE OF INVESTMENTS<br />
SMALL CAP INDEX FUND continued<br />
NUMBER<br />
OF SHARES<br />
COMMON STOCKS - 97.1% continued<br />
Investment Companies - 1.1% continued<br />
VALUE<br />
(000S)<br />
Solar Senior Capital Ltd. 6,464 $111<br />
Stellus Capital Investment Corp. 6,730 97<br />
TCP Capital Corp. 20,192 334<br />
THL Credit, Inc. 19,270 266<br />
TICC Capital Corp. 29,793 291<br />
Triangle Capital Corp. 15,670 406<br />
10,345<br />
Iron/Steel - 0.3%<br />
AK Steel Holding Corp.* 77,570 560<br />
Commercial Metals Co. 66,468 1,255<br />
Schnitzer Steel Industries, Inc., Class A 14,643 423<br />
Shiloh Industries, Inc.* 3,350 59<br />
Universal Stainless & Alloy Products, Inc.* 3,962 134<br />
2,431<br />
Leisure Time - 0.6%<br />
Arctic Cat, Inc. 7,504 359<br />
Black Diamond, Inc.* 12,914 158<br />
Brunswick Corp. 51,479 2,331<br />
Callaway Golf Co. 43,978 449<br />
ClubCorp Holdings, Inc. 11,782 223<br />
Diamond Resorts International, Inc.* 10,184 173<br />
Fox Factory Holding Corp.* 5,480 104<br />
Interval Leisure Group, Inc. 22,408 586<br />
Johnson Outdoors, Inc., Class A 2,905 74<br />
Life Time Fitness, Inc.* 24,497 1,178<br />
Malibu Boats, Inc. Class A* 4,670 104<br />
Marine Products Corp. 5,784 43<br />
Nautilus, Inc.* 17,671 170<br />
Town Sports International Holdings, Inc. 13,700 116<br />
6,068<br />
Lodging - 0.2%<br />
Boyd Gaming Corp.* 39,550 522<br />
Caesars Entertainment Corp.* 22,960 437<br />
Intrawest Resorts Holdings, Inc.* 10,217 133<br />
Marcus (The) Corp. 10,550 176<br />
Monarch Casino & Resort, Inc.* 4,796 89<br />
Morgans Hotel Group Co.* 15,174 122<br />
Orient-Express Hotels Ltd., Class A* 54,528 786<br />
2,265<br />
Machinery - Construction & Mining - 0.1%<br />
Astec Industries, Inc. 11,597 509<br />
NUMBER<br />
OF SHARES<br />
COMMON STOCKS - 97.1% continued<br />
Machinery - Construction & Mining - 0.1% continued<br />
VALUE<br />
(000S)<br />
Hyster-Yale Materials Handling, Inc. 5,992 $584<br />
1,093<br />
Machinery - Diversified - 1.3%<br />
Alamo Group, Inc. 4,031 219<br />
Albany International Corp., Class A 15,908 565<br />
Altra Industrial Motion Corp. 15,367 549<br />
Applied Industrial Technologies, Inc. 23,994 1,157<br />
Briggs & Stratton Corp. 27,411 610<br />
Chart Industries, Inc.* 17,256 1,373<br />
Cognex Corp.* 49,455 1,675<br />
Columbus McKinnon Corp.* 11,097 297<br />
DXP Enterprises, Inc.* 5,392 512<br />
ExOne (The) Co.* 3,757 135<br />
Global Power Equipment Group, Inc. 9,716 193<br />
Gorman-Rupp (The) Co. 10,731 341<br />
Hurco Cos., Inc. 3,768 100<br />
Kadant, Inc. 6,378 233<br />
Lindsay Corp. 7,314 645<br />
Manitex International, Inc.* 7,902 129<br />
Middleby (The) Corp.* 10,696 2,826<br />
NACCO Industries, Inc., Class A 2,675 145<br />
Power Solutions International, Inc.* 1,253 94<br />
Tecumseh Products Co., Class A* 10,385 72<br />
Tennant Co. 10,473 687<br />
Twin Disc, Inc. 4,777 126<br />
12,683<br />
Media - 0.8%<br />
AH Belo Corp., Class A 10,621 123<br />
Beasley Broadcasting Group, Inc.,<br />
Class A 2,154 20<br />
Central European Media Enterprises Ltd.,<br />
Class A* 43,592 128<br />
Courier Corp. 6,566 101<br />
Crown Media Holdings, Inc., Class A* 19,200 74<br />
Cumulus Media, Inc., Class A* 49,242 340<br />
Daily Journal Corp.* 509 88<br />
Demand Media, Inc.* 20,612 100<br />
Dex Media, Inc.* 9,630 89<br />
Entercom Communications Corp., Class A* 13,714 138<br />
Entravision Communications Corp., Class A 31,379 210<br />
EW Scripps (The) Co., Class A* 17,787 315<br />
Gray Television, Inc.* 28,617 297<br />
Hemisphere Media Group, Inc.* 4,839 61<br />
Houghton Mifflin Harcourt Co.* 11,950 243<br />
See Notes to the Financial Statements.<br />
EQUITY INDEX FUNDS 94 NORTHERN FUNDS ANNUAL REPORT
MARCH 31, 2014<br />
NUMBER<br />
OF SHARES<br />
continued<br />
VALUE<br />
(000S)<br />
COMMON STOCKS - 97.1%<br />
Media - 0.8% continued<br />
Journal Communications, Inc., Class A* 25,093 $222<br />
Martha Stewart Living Omnimedia, Inc.,<br />
Class A* 13,359 60<br />
McClatchy (The) Co., Class A* 34,040 219<br />
Media General, Inc.* 11,151 205<br />
Meredith Corp. 20,310 943<br />
New York Times (The) Co., Class A 73,410 1,257<br />
Nexstar Broadcasting Group, Inc.,<br />
Class A 16,705 627<br />
Saga Communications, Inc., Class A 2,754 137<br />
Salem Communications Corp., Class A 6,053 60<br />
Scholastic Corp. 15,039 519<br />
Sinclair Broadcast Group, Inc., Class A 38,938 1,055<br />
World Wrestling Entertainment, Inc.,<br />
Class A 16,359 472<br />
8,103<br />
Metal Fabrication/Hardware - 0.8%<br />
A.M. Castle & Co.* 9,961 146<br />
Ampco-Pittsburgh Corp. 4,723 89<br />
CIRCOR International, Inc. 9,993 733<br />
Dynamic Materials Corp. 7,788 148<br />
Furmanite Corp.* 21,281 209<br />
Global Brass & Copper Holdings, Inc. 4,520 71<br />
Haynes International, Inc. 7,015 379<br />
LB Foster Co., Class A 5,790 271<br />
Mueller Industries, Inc. 31,988 959<br />
Mueller Water Products, Inc., Class A 89,851 854<br />
NN, Inc. 9,736 192<br />
Northwest Pipe Co.* 5,370 194<br />
Olympic Steel, Inc. 5,159 148<br />
Omega Flex, Inc. 1,590 34<br />
RBC Bearings, Inc.* 13,084 834<br />
Rexnord Corp.* 17,248 500<br />
RTI International Metals, Inc.* 17,805 495<br />
Sun Hydraulics Corp. 12,219 529<br />
Worthington Industries, Inc. 30,071 1,150<br />
7,935<br />
Mining - 0.7%<br />
Allied Nevada Gold Corp.* 59,133 255<br />
AMCOL International Corp. 15,833 725<br />
Century Aluminum Co.* 29,264 387<br />
Coeur Mining, Inc.* 57,758 536<br />
General Moly, Inc.* 34,308 34<br />
Globe Specialty Metals, Inc. 36,690 764<br />
NUMBER<br />
OF SHARES<br />
continued<br />
VALUE<br />
(000S)<br />
COMMON STOCKS - 97.1%<br />
Mining - 0.7% continued<br />
Gold Resource Corp. 18,647 $89<br />
Hecla Mining Co. 189,440 582<br />
Horsehead Holding Corp.* 28,703 483<br />
Kaiser Aluminum Corp. 10,751 768<br />
Materion Corp. 11,685 396<br />
Midway Gold Corp.* 61,480 64<br />
Molycorp, Inc.* 84,691 397<br />
Noranda Aluminum Holding Corp. 19,637 81<br />
Paramount Gold and Silver Corp.* 74,319 91<br />
Stillwater Mining Co.* 67,213 995<br />
United States Lime & Minerals, Inc. 1,117 63<br />
Uranium Energy Corp.* 49,202 65<br />
Ur-Energy, Inc.* 68,353 106<br />
US Silica Holdings, Inc. 12,198 466<br />
7,347<br />
Miscellaneous Manufacturing - 1.7%<br />
Actuant Corp., Class A 41,635 1,422<br />
American Railcar Industries, Inc. 5,378 377<br />
AZZ, Inc. 14,500 648<br />
Barnes Group, Inc. 30,585 1,177<br />
Blount International, Inc.* 28,012 333<br />
Chase Corp. 3,680 116<br />
CLARCOR, Inc. 28,266 1,621<br />
EnPro Industries, Inc.* 11,878 863<br />
Fabrinet* 16,136 335<br />
Federal Signal Corp.* 35,513 529<br />
FreightCar America, Inc. 6,857 159<br />
GP Strategies Corp.* 8,356 228<br />
Handy & Harman Ltd.* 3,126 69<br />
Hillenbrand, Inc. 31,274 1,011<br />
John Bean Technologies Corp. 16,454 508<br />
Koppers Holdings, Inc. 11,783 486<br />
LSB Industries, Inc.* 10,882 407<br />
Lydall, Inc.* 9,706 222<br />
Movado Group, Inc. 10,056 458<br />
Myers Industries, Inc. 16,054 320<br />
NL Industries, Inc. 3,800 41<br />
Park-Ohio Holdings Corp.* 4,930 277<br />
PMFG, Inc.* 12,175 73<br />
Polypore International, Inc.* 26,550 908<br />
Proto Labs, Inc.* 9,713 657<br />
Raven Industries, Inc. 20,700 678<br />
Smith & Wesson Holding Corp.* 31,753 464<br />
Standex International Corp. 7,228 387<br />
See Notes to the Financial Statements.<br />
NORTHERN FUNDS ANNUAL REPORT 95 EQUITY INDEX FUNDS
SCHEDULE OF INVESTMENTS<br />
SMALL CAP INDEX FUND continued<br />
NUMBER<br />
OF SHARES<br />
COMMON STOCKS - 97.1% continued<br />
Miscellaneous Manufacturing - 1.7% continued<br />
VALUE<br />
(000S)<br />
Sturm Ruger & Co., Inc. 10,995 $658<br />
Tredegar Corp. 14,012 322<br />
TriMas Corp.* 25,569 849<br />
16,603<br />
Multi-National - 0.0%<br />
Banco Latinoamericano de Comercio<br />
Exterior S.A., Class E 16,655 440<br />
Office Furnishings - 0.4%<br />
Compx International, Inc. 1,003 11<br />
Herman Miller, Inc. 33,362 1,072<br />
HNI Corp. 25,880 946<br />
Interface, Inc. 33,776 694<br />
Knoll, Inc. 27,438 499<br />
Steelcase, Inc., Class A 47,991 797<br />
4,019<br />
Oil&Gas-2.8%<br />
Abraxas Petroleum Corp.* 46,810 185<br />
Adams Resources & Energy, Inc. 1,221 71<br />
Alon USA Energy, Inc. 13,247 198<br />
Apco Oil and Gas International, Inc.* 5,082 73<br />
Approach Resources, Inc.* 19,844 415<br />
Arabian American Development Co.* 11,308 123<br />
Athlon Energy, Inc.* 10,332 366<br />
Bill Barrett Corp.* 27,739 710<br />
Bonanza Creek Energy, Inc.* 16,747 744<br />
BPZ Resources, Inc.* 67,072 213<br />
Callon Petroleum Co.* 22,739 190<br />
Carrizo Oil & Gas, Inc.* 25,845 1,382<br />
Clayton Williams Energy, Inc.* 3,351 379<br />
Comstock Resources, Inc. 27,483 628<br />
Contango Oil & Gas Co.* 8,435 403<br />
Delek US Holdings, Inc. 21,132 614<br />
Diamondback Energy, Inc.* 12,003 808<br />
Emerald Oil, Inc.* 32,246 217<br />
Endeavour International Corp.* 26,824 87<br />
Energy XXI Bermuda Ltd. 41,496 978<br />
EPL Oil & Gas, Inc.* 17,006 656<br />
Equal Energy Ltd. 20,194 92<br />
Evolution Petroleum Corp. 9,637 123<br />
EXCO Resources, Inc. 96,554 541<br />
Forest Oil Corp.* 67,871 130<br />
FX Energy, Inc.* 30,666 102<br />
Gastar Exploration, Inc.* 31,572 173<br />
NUMBER<br />
OF SHARES<br />
continued<br />
VALUE<br />
(000S)<br />
COMMON STOCKS - 97.1%<br />
Oil & Gas - 2.8% continued<br />
Goodrich Petroleum Corp.* 17,836 $282<br />
Halcon Resources Corp.* 131,825 571<br />
Hercules Offshore, Inc.* 90,738 416<br />
Isramco, Inc.* 543 72<br />
Jones Energy, Inc., Class A* 6,455 98<br />
Kodiak Oil & Gas Corp.* 151,051 1,834<br />
Magnum Hunter Resources Corp.* 97,836 832<br />
Matador Resources Co.* 33,109 811<br />
Midstates Petroleum Co., Inc.* 18,896 101<br />
Miller Energy Resources, Inc.* 17,705 104<br />
North Atlantic Drilling Ltd. 40,641 359<br />
<strong>Northern</strong> Oil and Gas, Inc.* 36,297 531<br />
Panhandle Oil and Gas, Inc., Class A 3,969 173<br />
Parker Drilling Co.* 67,795 481<br />
PDC Energy, Inc.* 20,260 1,261<br />
Penn Virginia Corp.* 31,418 549<br />
PetroQuest Energy, Inc.* 32,477 185<br />
Quicksilver Resources, Inc.* 70,911 186<br />
Resolute Energy Corp.* 38,528 277<br />
Rex Energy Corp.* 25,726 481<br />
Rosetta Resources, Inc.* 34,763 1,619<br />
RSP Permian, Inc.* 13,077 378<br />
Sanchez Energy Corp.* 21,662 642<br />
Stone Energy Corp.* 28,432 1,193<br />
Swift Energy Co.* 24,665 265<br />
Synergy Resources Corp.* 28,869 310<br />
Triangle Petroleum Corp.* 38,676 319<br />
VAALCO Energy, Inc.* 32,967 282<br />
Vantage Drilling Co.* 114,462 196<br />
W&T Offshore, Inc. 19,787 343<br />
Warren Resources, Inc.* 41,599 200<br />
Western Refining, Inc. 30,810 1,189<br />
ZaZa Energy Corp.* 20,982 16<br />
27,157<br />
Oil & Gas Services - 1.7%<br />
Basic Energy Services, Inc.* 17,020 467<br />
Bolt Technology Corp. 4,982 99<br />
C&J Energy Services, Inc.* 25,628 747<br />
Cal Dive International, Inc.* 56,126 95<br />
CARBO Ceramics, Inc. 11,265 1,555<br />
Dawson Geophysical Co. 4,603 129<br />
Exterran Holdings, Inc. 32,753 1,437<br />
Flotek Industries, Inc.* 27,135 756<br />
Forum Energy Technologies, Inc.* 22,379 693<br />
See Notes to the Financial Statements.<br />
EQUITY INDEX FUNDS 96 NORTHERN FUNDS ANNUAL REPORT
MARCH 31, 2014<br />
NUMBER<br />
OF SHARES<br />
COMMON STOCKS - 97.1% continued<br />
Oil & Gas Services - 1.7% continued<br />
VALUE<br />
(000S)<br />
Geospace Technologies Corp.* 7,347 $486<br />
Gulf Island Fabrication, Inc. 8,233 178<br />
Helix Energy Solutions Group, Inc.* 60,284 1,385<br />
Hornbeck Offshore Services, Inc.* 20,361 851<br />
ION Geophysical Corp.* 75,817 319<br />
Key Energy Services, Inc.* 86,664 801<br />
Matrix Service Co.* 14,838 501<br />
Mitcham Industries, Inc.* 7,409 103<br />
Natural Gas Services Group, Inc.* 7,040 212<br />
Newpark Resources, Inc.* 49,009 561<br />
Pioneer Energy Services Corp.* 35,388 458<br />
SEACOR Holdings, Inc.* 11,431 988<br />
T.G.C. Industries, Inc.* 9,184 55<br />
Targa Resources Corp. 18,717 1,858<br />
Tesco Corp.* 17,183 318<br />
TETRA Technologies, Inc.* 44,532 570<br />
Thermon Group Holdings, Inc.* 15,433 358<br />
Willbros Group, Inc.* 22,765 287<br />
16,267<br />
Packaging & Containers - 0.2%<br />
AEP Industries, Inc.* 2,507 93<br />
Berry Plastics Group, Inc.* 31,516 730<br />
Graphic Packaging Holding Co.* 111,625 1,134<br />
UFP Technologies, Inc.* 3,117 76<br />
2,033<br />
Pharmaceuticals - 2.8%<br />
ACADIA Pharmaceuticals, Inc.* 43,906 1,068<br />
AcelRx Pharmaceuticals, Inc.* 13,286 160<br />
Aerie Pharmaceuticals, Inc.* 4,517 96<br />
Agios Pharmaceuticals, Inc.* 3,800 149<br />
Akebia Therapeutics, Inc.* 204 4<br />
Akorn, Inc.* 33,125 729<br />
Alimera Sciences, Inc.* 9,536 75<br />
Amicus Therapeutics, Inc.* 17,069 35<br />
Ampio Pharmaceuticals, Inc.* 17,747 113<br />
Anacor Pharmaceuticals, Inc.* 14,430 289<br />
Anika Therapeutics, Inc.* 6,837 281<br />
Antares Pharma, Inc.* 64,206 225<br />
Aratana Therapeutics, Inc.* 3,676 68<br />
Array BioPharma, Inc.* 70,422 331<br />
Auspex Pharmaceuticals, Inc.* 4,577 141<br />
Auxilium Pharmaceuticals, Inc.* 28,059 763<br />
AVANIR Pharmaceuticals, Inc., Class A* 82,603 303<br />
NUMBER<br />
OF SHARES<br />
COMMON STOCKS - 97.1% continued<br />
Pharmaceuticals - 2.8% continued<br />
VALUE<br />
(000S)<br />
BioDelivery Sciences International, Inc.* 21,163 $179<br />
BioScrip, Inc.* 33,184 232<br />
Cara Therapeutics, Inc.* 3,062 57<br />
Cempra, Inc.* 11,251 130<br />
ChemoCentryx, Inc.* 13,814 92<br />
Chimerix, Inc.* 4,770 109<br />
Clovis Oncology, Inc.* 10,212 707<br />
Conatus Pharmaceuticals, Inc.* 3,335 27<br />
Concert Pharmaceuticals, Inc.* 3,781 51<br />
Corcept Therapeutics, Inc.* 30,094 131<br />
Cytori Therapeutics, Inc.* 36,066 97<br />
Depomed, Inc.* 32,163 466<br />
Derma Sciences, Inc.* 11,537 146<br />
Durata Therapeutics, Inc.* 7,539 101<br />
Dyax Corp.* 76,497 687<br />
Egalet Corp.* 1,914 27<br />
Enanta Pharmaceuticals, Inc.* 2,043 82<br />
Esperion Therapeutics, Inc.* 2,545 38<br />
Flexion Therapeutics, Inc.* 2,569 42<br />
Furiex Pharmaceuticals, Inc.* 3,786 329<br />
Hi-Tech Pharmacal Co., Inc.* 6,325 274<br />
Hyperion Therapeutics, Inc.* 4,718 122<br />
Impax Laboratories, Inc.* 38,970 1,030<br />
Infinity Pharmaceuticals, Inc.* 27,260 324<br />
Insys Therapeutics, Inc.* 4,326 179<br />
Ironwood Pharmaceuticals, Inc.* 60,238 742<br />
KaloBios Pharmaceuticals, Inc.* 6,476 18<br />
Keryx Biopharmaceuticals, Inc.* 50,716 864<br />
Kindred Biosciences, Inc.* 4,904 91<br />
Lannett Co., Inc.* 10,634 380<br />
Lifevantage Corp.* 59,419 78<br />
MannKind Corp.* 84,670 340<br />
Natural Grocers by Vitamin Cottage, Inc.* 5,043 220<br />
Nature’s Sunshine Products, Inc. 6,227 86<br />
Nektar Therapeutics* 71,055 861<br />
Neogen Corp.* 20,424 918<br />
Neurocrine Biosciences, Inc.* 42,843 690<br />
Nutraceutical International Corp.* 4,896 127<br />
Omega Protein Corp.* 11,474 138<br />
Ophthotech Corp.* 5,050 180<br />
OPKO Health, Inc.* 107,470 1,002<br />
Orexigen Therapeutics, Inc.* 63,418 412<br />
Osiris Therapeutics, Inc.* 9,445 124<br />
Pacira Pharmaceuticals, Inc.* 15,686 1,098<br />
See Notes to the Financial Statements.<br />
NORTHERN FUNDS ANNUAL REPORT 97 EQUITY INDEX FUNDS
SCHEDULE OF INVESTMENTS<br />
SMALL CAP INDEX FUND continued<br />
NUMBER<br />
OF SHARES<br />
COMMON STOCKS - 97.1% continued<br />
Pharmaceuticals - 2.8% continued<br />
VALUE<br />
(000S)<br />
Pernix Therapeutics Holdings* 9,870 $53<br />
PharMerica Corp.* 16,902 473<br />
Portola Pharmaceuticals, Inc.* 6,219 161<br />
Pozen, Inc.* 15,360 123<br />
Prestige Brands Holdings, Inc.* 29,105 793<br />
Progenics Pharmaceuticals, Inc.* 33,920 139<br />
Questcor Pharmaceuticals, Inc. 29,527 1,917<br />
Raptor Pharmaceutical Corp.* 33,975 340<br />
Receptos, Inc.* 4,137 173<br />
Regulus Therapeutics, Inc.* 5,737 52<br />
Relypsa, Inc.* 3,519 105<br />
Repros Therapeutics, Inc.* 13,070 232<br />
Revance Therapeutics, Inc.* 3,923 124<br />
Sagent Pharmaceuticals, Inc.* 10,710 250<br />
Sarepta Therapeutics, Inc.* 21,394 514<br />
Sciclone Pharmaceuticals, Inc.* 30,843 140<br />
SIGA Technologies, Inc.* 20,884 65<br />
Star Scientific, Inc.* 89,396 70<br />
Sucampo Pharmaceuticals, Inc., Class A* 7,845 56<br />
Supernus Pharmaceuticals, Inc.* 9,110 81<br />
Synergy Pharmaceuticals, Inc. 45,926 244<br />
Synta Pharmaceuticals Corp.* 28,468 123<br />
Synutra International, Inc.* 9,760 65<br />
Targacept, Inc.* 15,986 76<br />
TESARO, Inc.* 7,621 225<br />
Tetraphase Pharmaceuticals, Inc.* 8,048 88<br />
TG Therapeutics, Inc.* 8,558 59<br />
TherapeuticsMD, Inc.* 49,112 310<br />
Threshold Pharmaceuticals, Inc.* 26,904 128<br />
Trevena, Inc.* 4,194 33<br />
USANA Health Sciences, Inc.* 3,415 257<br />
Vanda Pharmaceuticals, Inc.* 18,885 307<br />
Vivus, Inc.* 57,302 340<br />
Xencor, Inc.* 8,323 98<br />
XenoPort, Inc.* 31,074 161<br />
Zogenix, Inc.* 56,061 159<br />
27,392<br />
Pipelines - 0.2%<br />
Primoris Services Corp. 20,076 602<br />
SemGroup Corp., Class A 23,921 1,571<br />
2,173<br />
Real Estate - 0.4%<br />
Alexander & Baldwin, Inc. 24,500 1,043<br />
NUMBER<br />
OF SHARES<br />
continued<br />
VALUE<br />
(000S)<br />
COMMON STOCKS - 97.1%<br />
Real Estate - 0.4% continued<br />
Altisource Residential Corp. 32,134 $1,014<br />
AV Homes, Inc.* 5,388 97<br />
Consolidated-Tomoka Land Co. 3,329 134<br />
Forestar Group, Inc.* 19,719 351<br />
HFF, Inc., Class A 18,832 633<br />
Kennedy-Wilson Holdings, Inc. 36,894 830<br />
Marcus & Millichap, Inc.* 3,794 68<br />
RE/MAX Holdings, Inc., Class A 6,610 191<br />
4,361<br />
Real Estate Investment Trusts - 7.5%<br />
Acadia Realty Trust 31,335 827<br />
AG Mortgage Investment Trust, Inc. 15,899 278<br />
Agree Realty Corp. 8,471 258<br />
Alexander’s, Inc. 1,198 432<br />
American Assets Trust, Inc. 19,130 645<br />
American Capital Mortgage<br />
Investment Corp. 30,099 565<br />
American Realty Capital Properties, Inc. 267,015 3,744<br />
American Residential Properties, Inc.* 7,855 141<br />
AmREIT, Inc. 11,182 185<br />
Anworth Mortgage Asset Corp. 82,450 409<br />
Apollo Commercial Real Estate<br />
Finance, Inc. 20,970 349<br />
Apollo Residential Mortgage, Inc. 18,221 296<br />
Ares Commercial Real Estate Corp. 12,169 163<br />
Armada Hoffler Properties, Inc. 10,667 107<br />
ARMOUR Residential REIT, Inc. 212,898 877<br />
Ashford Hospitality Prime, Inc. 10,461 158<br />
Ashford Hospitality Trust, Inc. 34,973 394<br />
Associated Estates Realty Corp. 32,751 555<br />
Aviv REIT, Inc. 6,554 160<br />
Campus Crest Communities, Inc. 36,729 319<br />
Capstead Mortgage Corp. 54,355 688<br />
CatchMark Timber Trust, Inc. Class A 6,883 97<br />
Cedar Realty Trust, Inc. 41,199 252<br />
Chambers Street Properties 134,593 1,046<br />
Chatham Lodging Trust 14,965 303<br />
Chesapeake Lodging Trust 27,636 711<br />
Colony Financial, Inc. 52,513 1,153<br />
CoreSite Realty Corp. 11,811 366<br />
Cousins Properties, Inc. 95,632 1,097<br />
CubeSmart 79,765 1,369<br />
CYS Investments, Inc. 91,550 756<br />
DCT Industrial Trust, Inc. 179,141 1,412<br />
See Notes to the Financial Statements.<br />
EQUITY INDEX FUNDS 98 NORTHERN FUNDS ANNUAL REPORT
MARCH 31, 2014<br />
NUMBER<br />
OF SHARES<br />
COMMON STOCKS - 97.1% continued<br />
Real Estate Investment Trusts - 7.5% continued<br />
VALUE<br />
(000S)<br />
DiamondRock Hospitality Co. 111,229 $1,307<br />
DuPont Fabros Technology, Inc. 35,525 855<br />
Dynex Capital, Inc. 31,275 280<br />
EastGroup Properties, Inc. 17,219 1,083<br />
Education Realty Trust, Inc. 64,867 640<br />
Ellington Residential Mortgage REIT 3,617 61<br />
Empire State Realty Trust, Inc., Class A 46,895 709<br />
EPR Properties 29,395 1,569<br />
<strong>Equity</strong> One, Inc. 34,260 765<br />
Excel Trust, Inc. 27,238 345<br />
FelCor Lodging Trust, Inc. 70,643 639<br />
First Industrial Realty Trust, Inc. 61,180 1,182<br />
First Potomac Realty Trust 33,447 432<br />
Franklin Street Properties Corp. 51,276 646<br />
Geo Group (The), Inc. 40,743 1,314<br />
Getty Realty Corp. 14,612 276<br />
Gladstone Commercial Corp. 8,898 154<br />
Glimcher Realty Trust 82,308 826<br />
Government Properties Income Trust 31,086 783<br />
Gramercy Property Trust, Inc. 33,794 174<br />
Healthcare Realty Trust, Inc. 54,572 1,318<br />
Hersha Hospitality Trust 115,247 672<br />
Highwoods Properties, Inc. 51,119 1,964<br />
Hudson Pacific Properties, Inc. 28,578 659<br />
Inland Real Estate Corp. 48,533 512<br />
Invesco Mortgage Capital, Inc. 70,507 1,161<br />
InvestorsRealEstateTrust 57,492 516<br />
iStar Financial, Inc.* 48,402 714<br />
JAVELIN Mortgage Investment Corp. 7,711 103<br />
Kite Realty Group Trust 74,393 446<br />
LaSalle Hotel Properties 59,167 1,853<br />
Lexington Realty Trust 102,267 1,116<br />
LTC Properties, Inc. 19,767 744<br />
Medical Properties Trust, Inc. 91,956 1,176<br />
Monmouth Real Estate Investment Corp.,<br />
Class A 25,913 247<br />
National Health Investors, Inc. 16,604 1,004<br />
New Residential Investment Corp. 143,996 932<br />
New York Mortgage Trust, Inc. 42,976 334<br />
NorthStar Realty Finance Corp. 185,900 3,000<br />
One Liberty Properties, Inc. 6,700 143<br />
Parkway Properties, Inc. 33,594 613<br />
Pebblebrook Hotel Trust 34,955 1,180<br />
Pennsylvania Real Estate Investment Trust 38,712 699<br />
PennyMac Mortgage Investment Trust 40,088 958<br />
NUMBER<br />
OF SHARES<br />
COMMON STOCKS - 97.1% continued<br />
Real Estate Investment Trusts - 7.5% continued<br />
VALUE<br />
(000S)<br />
Physicians Realty Trust 11,446 $159<br />
Potlatch Corp. 23,044 892<br />
PS Business Parks, Inc. 11,054 924<br />
QTS Realty Trust, Inc., Class A 8,021 201<br />
RAIT Financial Trust 46,299 393<br />
Ramco-Gershenson Properties Trust 37,871 617<br />
Redwood Trust, Inc. 46,738 948<br />
Resource Capital Corp. 72,245 402<br />
Retail Opportunity Investments Corp. 40,858 610<br />
Rexford Industrial Realty, Inc. 9,785 139<br />
RLJ Lodging Trust 70,372 1,882<br />
Rouse Properties, Inc. 14,820 256<br />
Ryman Hospitality Properties, Inc. 25,105 1,067<br />
Sabra Health Care REIT, Inc. 21,251 593<br />
Saul Centers, Inc. 4,484 212<br />
Select Income REIT 12,451 377<br />
Silver Bay Realty Trust Corp. 8,667 135<br />
Sovran Self Storage, Inc. 17,873 1,313<br />
STAG Industrial, Inc. 25,216 608<br />
Strategic Hotels & Resorts, Inc.* 103,187 1,051<br />
Summit Hotel Properties, Inc. 45,422 422<br />
Sun Communities, Inc. 22,953 1,035<br />
Sunstone Hotel Investors, Inc. 104,069 1,429<br />
Terreno Realty Corp. 14,233 269<br />
UMH Properties, Inc. 9,665 95<br />
Universal Health Realty Income Trust 6,791 287<br />
Urstadt Biddle Properties, Inc., Class A 14,208 294<br />
Washington Real Estate Investment Trust 37,860 904<br />
Western Asset Mortgage Capital Corp. 15,114 236<br />
Whitestone REIT 12,161 176<br />
Winthrop Realty Trust 18,217 211<br />
74,353<br />
Retail - 5.7%<br />
Aeropostale, Inc.* 44,660 224<br />
America’s Car-Mart, Inc.* 4,583 168<br />
ANN, Inc.* 26,842 1,113<br />
Asbury Automotive Group, Inc.* 17,736 981<br />
Barnes & Noble, Inc.* 22,997 481<br />
bebe stores, Inc. 19,593 120<br />
Big 5 Sporting Goods Corp. 9,613 154<br />
Biglari Holdings, Inc.* 824 402<br />
BJ’s Restaurants, Inc.* 14,038 459<br />
Bloomin’ Brands, Inc.* 31,470 758<br />
Bob Evans Farms, Inc. 14,037 702<br />
See Notes to the Financial Statements.<br />
NORTHERN FUNDS ANNUAL REPORT 99 EQUITY INDEX FUNDS
SCHEDULE OF INVESTMENTS<br />
SMALL CAP INDEX FUND continued<br />
NUMBER<br />
OF SHARES<br />
continued<br />
VALUE<br />
(000S)<br />
COMMON STOCKS - 97.1%<br />
Retail - 5.7% continued<br />
Body Central Corp.* 9,563 $10<br />
Bon-Ton Stores (The), Inc. 7,689 84<br />
Bravo Brio Restaurant Group, Inc.* 11,152 157<br />
Brown Shoe Co., Inc. 24,614 653<br />
Buckle (The), Inc. 15,902 728<br />
Buffalo Wild Wings, Inc.* 10,674 1,589<br />
Burlington Stores, Inc.* 8,725 258<br />
Carrols Restaurant Group, Inc.* 13,309 95<br />
Casey’s General Stores, Inc. 21,810 1,474<br />
Cash America International, Inc. 16,240 629<br />
Cato (The) Corp., Class A 15,680 424<br />
Cheesecake Factory (The), Inc. 30,337 1,445<br />
Children’s Place Retail Stores (The), Inc. 13,149 655<br />
Christopher & Banks Corp.* 20,674 137<br />
Chuy’s Holdings, Inc.* 9,239 399<br />
Citi Trends, Inc.* 8,893 145<br />
Conn’s, Inc.* 12,772 496<br />
Container Store Group (The), Inc.* 8,183 278<br />
Cracker Barrel Old Country Store, Inc. 11,178 1,087<br />
Del Frisco’s Restaurant Group, Inc.* 6,085 170<br />
Denny’s Corp.* 52,304 336<br />
Destination Maternity Corp. 7,702 211<br />
Destination XL Group, Inc.* 24,048 136<br />
Dine<strong>Equity</strong>, Inc. 9,411 735<br />
Diversified Restaurant Holdings, Inc.* 6,026 30<br />
Einstein Noah Restaurant Group, Inc. 3,635 60<br />
Express, Inc.* 48,569 771<br />
Ezcorp, Inc., Class A* 29,057 314<br />
Fiesta Restaurant Group, Inc.* 12,748 581<br />
Finish Line (The), Inc., Class A 28,018 759<br />
First Cash Financial Services, Inc.* 16,609 838<br />
Five Below, Inc.* 18,661 793<br />
Francesca’s Holdings Corp.* 25,051 454<br />
Fred’s, Inc., Class A 20,890 376<br />
Genesco, Inc.* 13,666 1,019<br />
Gordmans Stores, Inc. 4,901 27<br />
Group 1 Automotive, Inc. 12,379 813<br />
Haverty Furniture Cos., Inc. 11,238 334<br />
hhgregg, Inc.* 7,208 69<br />
Hibbett Sports, Inc.* 14,787 782<br />
HSN, Inc. 19,240 1,149<br />
Ignite Restaurant Group, Inc.* 3,944 56<br />
Jack in the Box, Inc.* 23,725 1,398<br />
Jamba, Inc.* 9,297 112<br />
NUMBER<br />
OF SHARES<br />
continued<br />
VALUE<br />
(000S)<br />
COMMON STOCKS - 97.1%<br />
Retail - 5.7% continued<br />
Jos A Bank Clothiers, Inc.* 15,912 $1,023<br />
Kate Spade & Co.* 68,262 2,532<br />
Kirkland’s, Inc.* 7,933 147<br />
Krispy Kreme Doughnuts, Inc.* 37,263 661<br />
Lithia Motors, Inc., Class A 12,633 840<br />
Luby’s, Inc.* 11,634 72<br />
Lumber Liquidators Holdings, Inc.* 15,633 1,466<br />
MarineMax, Inc.* 13,294 202<br />
Mattress Firm Holding Corp.* 7,646 366<br />
Men’s Wearhouse (The), Inc. 27,013 1,323<br />
Nathan’s Famous, Inc.* 1,539 75<br />
New York & Co., Inc.* 15,940 70<br />
Noodles & Co.* 3,565 141<br />
Office Depot, Inc.* 273,234 1,128<br />
Pacific Sunwear of California, Inc.* 25,918 77<br />
Pantry (The), Inc.* 13,395 206<br />
Papa John’s International, Inc. 18,226 950<br />
PC Connection, Inc. 5,310 108<br />
Penske Automotive Group, Inc. 24,044 1,028<br />
Pep Boys-Manny Moe & Jack (The)* 30,259 385<br />
PetMed Express, Inc. 11,437 153<br />
Pier 1 Imports, Inc. 53,942 1,018<br />
Popeyes Louisiana Kitchen, Inc.* 13,580 552<br />
Potbelly Corp.* 4,938 88<br />
PriceSmart, Inc. 10,740 1,084<br />
RadioShack Corp.* 56,743 120<br />
Red Robin Gourmet Burgers, Inc.* 8,057 578<br />
Regis Corp. 27,018 370<br />
Restoration Hardware Holdings, Inc.* 10,064 741<br />
Rite Aid Corp.* 415,561 2,606<br />
Roundy’s, Inc. 14,338 99<br />
Ruby Tuesday, Inc.* 34,683 195<br />
Rush Enterprises, Inc., Class A* 19,763 642<br />
Ruth’s Hospitality Group, Inc. 20,389 247<br />
Sears Hometown and Outlet Stores, Inc.* 4,928 117<br />
Shoe Carnival, Inc. 8,558 197<br />
Sonic Automotive, Inc., Class A 22,166 498<br />
Sonic Corp.* 31,934 728<br />
Stage Stores, Inc. 18,620 455<br />
Stein Mart, Inc. 15,754 221<br />
Susser Holdings Corp.* 10,267 641<br />
Systemax, Inc.* 6,377 95<br />
Texas Roadhouse, Inc. 35,514 926<br />
Tile Shop Holdings, Inc.* 10,507 162<br />
See Notes to the Financial Statements.<br />
EQUITY INDEX FUNDS 100 NORTHERN FUNDS ANNUAL REPORT
MARCH 31, 2014<br />
NUMBER<br />
OF SHARES<br />
continued<br />
VALUE<br />
(000S)<br />
COMMON STOCKS - 97.1%<br />
Retail - 5.7% continued<br />
Tilly’s, Inc., Class A* 5,751 $67<br />
Trans World Entertainment Corp. 5,913 21<br />
Tuesday Morning Corp.* 24,380 345<br />
Vera Bradley, Inc.* 12,311 332<br />
Vitamin Shoppe, Inc.* 17,271 821<br />
West Marine, Inc.* 9,495 108<br />
Wet Seal (The), Inc., Class A* 50,688 67<br />
Winmark Corp. 1,249 95<br />
Zale Corp.* 18,481 386<br />
Zumiez, Inc.* 12,012 291<br />
56,494<br />
Savings & Loans - 1.3%<br />
Astoria Financial Corp. 50,203 694<br />
Banc of California, Inc. 9,280 114<br />
Bank Mutual Corp. 26,421 168<br />
BankFinancial Corp. 12,013 120<br />
BBX Capital Corp., Class A* 4,050 79<br />
Beneficial Mutual Bancorp, Inc.* 18,186 240<br />
Berkshire Hills Bancorp, Inc. 14,265 369<br />
BofI Holding, Inc.* 6,882 590<br />
Brookline Bancorp, Inc. 39,826 375<br />
Capitol Federal Financial, Inc. 84,657 1,062<br />
Charter Financial Corp. 12,862 139<br />
Clifton Bancorp, Inc. 4,888 57<br />
Dime Community Bancshares, Inc. 18,100 307<br />
ESB Financial Corp. 7,212 94<br />
ESSA Bancorp, Inc. 5,178 56<br />
EverBank Financial Corp. 45,808 904<br />
First Defiance Financial Corp. 5,567 151<br />
First Federal Bancshares of Arkansas, Inc.* 1,686 15<br />
First Financial Northwest, Inc. 8,827 90<br />
Flagstar Bancorp, Inc.* 11,295 251<br />
Flushing Financial Corp. 17,557 370<br />
Fox Chase Bancorp, Inc. 6,840 115<br />
Hingham Institution for Savings 704 55<br />
Home Bancorp, Inc.* 3,767 79<br />
Home Federal Bancorp, Inc. 8,410 131<br />
HomeStreet, Inc. 7,370 144<br />
HomeTrust Bancshares, Inc.* 11,835 187<br />
Investors Bancorp, Inc. 28,735 794<br />
Kearny Financial Corp.* 8,060 119<br />
Meridian Interstate Bancorp, Inc.* 4,817 123<br />
Meta Financial Group, Inc. 3,406 153<br />
NASB Financial, Inc. 2,385 60<br />
NUMBER<br />
OF SHARES<br />
COMMON STOCKS - 97.1% continued<br />
Savings & Loans - 1.3% continued<br />
VALUE<br />
(000S)<br />
Northfield Bancorp, Inc. 33,044 $425<br />
Northwest Bancshares, Inc. 53,268 778<br />
OceanFirst Financial Corp. 7,843 139<br />
Oritani Financial Corp. 25,765 407<br />
Pacific Premier Bancorp, Inc.* 9,463 153<br />
Provident Financial Holdings, Inc. 5,159 80<br />
Provident Financial Services, Inc. 33,953 624<br />
Rockville Financial, Inc. 14,724 200<br />
Sterling Bancorp 47,473 601<br />
Territorial Bancorp, Inc. 6,024 130<br />
United Community Financial Corp.* 24,863 98<br />
United Financial Bancorp, Inc. 11,196 206<br />
Waterstone Financial, Inc.* 4,470 46<br />
Westfield Financial, Inc. 10,579 79<br />
WSFS Financial Corp. 4,463 319<br />
12,490<br />
Semiconductors - 3.3%<br />
Aeroflex Holding Corp.* 10,810 90<br />
Alpha & Omega Semiconductor Ltd.* 9,649 71<br />
Ambarella, Inc.* 10,529 281<br />
Amkor Technology, Inc.* 39,925 274<br />
ANADIGICS, Inc.* 46,297 79<br />
Applied Micro Circuits Corp.* 41,619 412<br />
ATMI, Inc.* 18,164 618<br />
Axcelis Technologies, Inc.* 62,441 134<br />
Brooks Automation, Inc. 37,842 414<br />
Cabot Microelectronics Corp.* 13,243 583<br />
Cavium, Inc.* 29,221 1,278<br />
Ceva, Inc.* 12,598 221<br />
Cirrus Logic, Inc.* 36,063 717<br />
Cohu, Inc. 14,181 152<br />
Cypress Semiconductor Corp.* 83,688 859<br />
Diodes, Inc.* 20,424 533<br />
DSP Group, Inc.* 11,255 97<br />
Emulex Corp.* 45,742 338<br />
Entegris, Inc.* 79,292 960<br />
Entropic Communications, Inc.* 51,000 209<br />
Exar Corp.* 21,782 260<br />
FormFactor, Inc.* 30,708 196<br />
GSI Technology, Inc.* 11,480 79<br />
GT Advanced Technologies, Inc.* 76,380 1,302<br />
Hittite Microwave Corp. 17,944 1,131<br />
Inphi Corp.* 14,852 239<br />
Integrated Device Technology, Inc.* 75,000 917<br />
See Notes to the Financial Statements.<br />
NORTHERN FUNDS ANNUAL REPORT 101 EQUITY INDEX FUNDS
SCHEDULE OF INVESTMENTS<br />
SMALL CAP INDEX FUND continued<br />
NUMBER<br />
OF SHARES<br />
continued<br />
VALUE<br />
(000S)<br />
COMMON STOCKS - 97.1%<br />
Semiconductors - 3.3% continued<br />
Integrated Silicon Solution, Inc.* 16,001 $249<br />
Intermolecular, Inc.* 9,336 26<br />
International Rectifier Corp.* 39,521 1,083<br />
Intersil Corp., Class A 72,379 935<br />
IXYS Corp. 13,775 156<br />
Kopin Corp.* 37,786 143<br />
Lattice Semiconductor Corp.* 65,798 516<br />
LTX-Credence Corp.* 27,069 241<br />
MaxLinear, Inc., Class A* 13,848 131<br />
Micrel, Inc. 26,526 294<br />
Microsemi Corp.* 52,878 1,324<br />
MKS Instruments, Inc. 30,169 902<br />
Monolithic Power Systems, Inc.* 21,996 853<br />
MoSys, Inc.* 26,799 122<br />
Nanometrics, Inc.* 13,162 236<br />
OmniVision Technologies, Inc.* 30,714 544<br />
Peregrine Semiconductor Corp.* 15,052 91<br />
Pericom Semiconductor Corp.* 13,164 103<br />
Photronics, Inc.* 34,595 295<br />
PLX Technology, Inc.* 25,938 157<br />
PMC - Sierra, Inc.* 116,116 884<br />
Power Integrations, Inc. 16,493 1,085<br />
QLogic Corp.* 50,640 646<br />
Rambus, Inc.* 63,537 683<br />
Richardson Electronics Ltd. 6,640 71<br />
Rubicon Technology, Inc.* 10,093 114<br />
Rudolph Technologies, Inc.* 18,593 212<br />
Semtech Corp.* 38,336 971<br />
Sigma Designs, Inc.* 17,250 82<br />
Silicon Image, Inc.* 43,912 303<br />
SunEdison, Inc.* 151,651 2,857<br />
Supertex, Inc.* 5,611 185<br />
Tessera Technologies, Inc. 30,027 710<br />
TriQuint Semiconductor, Inc.* 92,917 1,244<br />
Ultra Clean Holdings, Inc.* 13,588 179<br />
Ultratech, Inc.* 15,781 461<br />
Veeco Instruments, Inc.* 22,288 935<br />
32,467<br />
Software - 4.8%<br />
2U, Inc.* 338 5<br />
Accelrys, Inc.* 31,790 396<br />
ACI Worldwide, Inc.* 22,673 1,342<br />
Actuate Corp.* 26,908 162<br />
Acxiom Corp.* 42,064 1,447<br />
NUMBER<br />
OF SHARES<br />
continued<br />
VALUE<br />
(000S)<br />
COMMON STOCKS - 97.1%<br />
Software - 4.8% continued<br />
Advent Software, Inc. 18,574 $545<br />
Amber Road, Inc.* 867 13<br />
American Software, Inc., Class A 13,692 139<br />
Aspen Technology, Inc.* 53,326 2,259<br />
athenahealth, Inc.* 20,912 3,351<br />
Audience, Inc.* 5,408 68<br />
AVG Technologies N.V.* 13,627 286<br />
Benefitfocus, Inc.* 2,895 136<br />
Blackbaud, Inc. 25,973 813<br />
Bottomline Technologies de, Inc.* 21,529 757<br />
Callidus Software, Inc.* 22,980 288<br />
CommVault Systems, Inc.* 26,451 1,718<br />
Computer Programs & Systems, Inc. 6,315 408<br />
Cornerstone OnDemand, Inc.* 22,974 1,100<br />
CSG Systems International, Inc. 19,282 502<br />
Cvent, Inc.* 3,716 134<br />
Dealertrack Technologies, Inc.* 24,748 1,217<br />
Demandware, Inc.* 10,499 673<br />
Digi International, Inc.* 14,702 149<br />
Digital River, Inc.* 19,020 331<br />
E2open, Inc.* 8,402 198<br />
Ebix, Inc. 17,686 302<br />
Envestnet, Inc.* 12,849 516<br />
Epiq Systems, Inc. 17,896 244<br />
Everyday Health, Inc.* 338 5<br />
Fair Isaac Corp. 20,406 1,129<br />
Glu Mobile, Inc.* 36,527 173<br />
Guidance Software, Inc.* 9,426 104<br />
Guidewire Software, Inc.* 27,765 1,362<br />
ICG Group, Inc.* 21,627 442<br />
Imperva, Inc.* 11,492 640<br />
inContact, Inc.* 30,387 292<br />
Infoblox, Inc.* 30,147 605<br />
InnerWorkings, Inc.* 25,241 193<br />
Interactive Intelligence Group, Inc.* 8,816 639<br />
Jive Software, Inc.* 22,543 181<br />
ManTech International Corp., Class A 13,549 398<br />
MedAssets, Inc.* 34,691 857<br />
Medidata Solutions, Inc.* 30,267 1,645<br />
MicroStrategy, Inc., Class A* 5,152 594<br />
Model N, Inc.* 4,561 46<br />
Monotype Imaging Holdings, Inc. 21,750 656<br />
Omnicell, Inc.* 20,675 592<br />
PDF Solutions, Inc.* 14,293 260<br />
See Notes to the Financial Statements.<br />
EQUITY INDEX FUNDS 102 NORTHERN FUNDS ANNUAL REPORT
MARCH 31, 2014<br />
NUMBER<br />
OF SHARES<br />
continued<br />
VALUE<br />
(000S)<br />
COMMON STOCKS - 97.1%<br />
Software - 4.8% continued<br />
Pegasystems, Inc. 9,897 $350<br />
Planet Payment, Inc.* 23,938 66<br />
Progress Software Corp.* 29,517 643<br />
Proofpoint, Inc.* 13,086 485<br />
PROS Holdings, Inc.* 12,795 403<br />
PTC, Inc.* 68,067 2,412<br />
QAD, Inc., Class A 3,478 71<br />
Qlik Technologies, Inc.* 49,522 1,317<br />
Quality Systems, Inc. 22,726 384<br />
Rally Software Development Corp.* 3,878 52<br />
RealPage, Inc.* 26,487 481<br />
Rocket Fuel, Inc.* 2,804 120<br />
Rosetta Stone, Inc.* 6,462 72<br />
Sapiens International Corp. N.V.* 11,420 93<br />
Schawk, Inc. 7,690 154<br />
SciQuest, Inc.* 12,958 350<br />
Seachange International, Inc.* 18,632 194<br />
SS&C Technologies Holdings, Inc.* 33,146 1,326<br />
Synchronoss Technologies, Inc.* 16,578 568<br />
SYNNEX Corp.* 15,020 910<br />
Take-Two Interactive Software, Inc.* 46,075 1,010<br />
Tangoe, Inc.* 17,632 328<br />
Tyler Technologies, Inc.* 17,927 1,500<br />
Ultimate Software Group (The), Inc.* 15,731 2,155<br />
Verint Systems, Inc.* 29,981 1,407<br />
47,163<br />
Storage/Warehousing - 0.2%<br />
Mobile Mini, Inc. 21,828 946<br />
Wesco Aircraft Holdings, Inc.* 23,426 516<br />
1,462<br />
Telecommunications - 2.9%<br />
8x8, Inc.* 49,822 539<br />
ADTRAN, Inc. 33,728 823<br />
Aerohive Networks, Inc.* 435 5<br />
Alliance Fiber Optic Products, Inc. 6,472 94<br />
Anixter International, Inc. 15,415 1,565<br />
ARRIS Group, Inc.* 66,299 1,868<br />
Aruba Networks, Inc.* 60,707 1,138<br />
Atlantic Tele-Network, Inc. 5,223 344<br />
Aviat Networks, Inc.* 35,569 57<br />
Black Box Corp. 9,183 224<br />
CalAmp Corp.* 19,946 556<br />
Calix, Inc.* 22,780 192<br />
NUMBER<br />
OF SHARES<br />
COMMON STOCKS - 97.1% continued<br />
Telecommunications - 2.9% continued<br />
VALUE<br />
(000S)<br />
Cbeyond, Inc.* 15,622 $113<br />
Ciena Corp.* 57,772 1,314<br />
Cincinnati Bell, Inc.* 118,386 410<br />
Comtech Telecommunications Corp. 8,715 278<br />
Comverse, Inc.* 12,625 437<br />
Consolidated Communications<br />
Holdings, Inc. 22,807 456<br />
Cyan, Inc.* 4,494 19<br />
DigitalGlobe, Inc.* 42,393 1,230<br />
EarthLink Holdings Corp. 58,642 212<br />
Extreme Networks, Inc.* 52,916 307<br />
FairPoint Communications, Inc.* 11,810 161<br />
Finisar Corp.* 53,170 1,410<br />
General Communication, Inc., Class A* 17,914 204<br />
Gigamon, Inc.* 4,489 136<br />
Gogo, Inc.* 6,325 130<br />
Harmonic, Inc.* 57,646 412<br />
Hawaiian Telcom Holdco, Inc.* 5,881 168<br />
HickoryTech Corp. 7,759 99<br />
IDT Corp., Class B 8,745 146<br />
Infinera Corp.* 69,615 632<br />
Inteliquent, Inc. 18,518 269<br />
InterDigital, Inc. 23,417 775<br />
Iridium Communications, Inc.* 36,530 274<br />
Ixia* 32,147 402<br />
KVH Industries, Inc.* 8,886 117<br />
LogMeIn, Inc.* 13,832 621<br />
Loral Space & Communications, Inc.* 7,403 524<br />
Lumos Networks Corp. 8,790 118<br />
Neonode, Inc.* 15,673 89<br />
NeoPhotonics Corp.* 11,360 90<br />
NETGEAR, Inc.* 20,730 699<br />
NII Holdings, Inc.* 97,916 117<br />
NTELOS Holdings Corp. 8,692 117<br />
Numerex Corp., Class A* 7,867 86<br />
Oplink Communications, Inc.* 10,837 195<br />
ORBCOMM, Inc.* 20,631 141<br />
Parkervision, Inc.* 50,391 242<br />
Plantronics, Inc. 24,629 1,095<br />
Preformed Line Products Co. 1,449 99<br />
Premiere Global Services, Inc.* 27,378 330<br />
Procera Networks, Inc.* 11,690 121<br />
RF Micro Devices, Inc.* 160,060 1,261<br />
RigNet, Inc.* 6,739 363<br />
Ruckus Wireless, Inc.* 26,311 320<br />
See Notes to the Financial Statements.<br />
NORTHERN FUNDS ANNUAL REPORT 103 EQUITY INDEX FUNDS
SCHEDULE OF INVESTMENTS<br />
SMALL CAP INDEX FUND continued<br />
NUMBER<br />
OF SHARES<br />
COMMON STOCKS - 97.1% continued<br />
Telecommunications - 2.9% continued<br />
VALUE<br />
(000S)<br />
Shenandoah Telecommunications Co. 13,652 $441<br />
ShoreTel, Inc.* 33,501 288<br />
Sonus Networks, Inc.* 108,415 365<br />
Straight Path Communications, Inc.,<br />
Class B* 4,375 32<br />
Telenav, Inc.* 10,472 62<br />
Tessco Technologies, Inc. 3,167 118<br />
Ubiquiti Networks, Inc.* 7,166 326<br />
USA Mobility, Inc. 12,300 223<br />
ViaSat, Inc.* 22,516 1,555<br />
Vonage Holdings Corp.* 88,398 377<br />
Vringo, Inc.* 38,181 132<br />
West Corp. 12,134 290<br />
Westell Technologies, Inc., Class A* 25,841 95<br />
28,448<br />
Textiles - 0.2%<br />
Culp, Inc. 4,745 93<br />
G&K Services, Inc., Class A 11,128 681<br />
UniFirst Corp. 8,329 916<br />
1,690<br />
Toys, Games & Hobbies - 0.0%<br />
JAKKS Pacific, Inc. 10,817 78<br />
LeapFrog Enterprises, Inc.* 36,278 272<br />
350<br />
Transportation - 1.8%<br />
Air Transport Services Group, Inc.* 29,545 232<br />
Arkansas Best Corp. 14,631 541<br />
Atlas Air Worldwide Holdings, Inc.* 14,699 518<br />
Bristow Group, Inc. 20,564 1,553<br />
CAI International, Inc.* 9,783 241<br />
Celadon Group, Inc. 11,439 275<br />
CHC Group Ltd.* 20,219 149<br />
Echo Global Logistics, Inc.* 10,143 186<br />
Era Group, Inc.* 11,448 336<br />
Forward Air Corp. 17,174 792<br />
Frontline Ltd.* 28,899 114<br />
GasLog Ltd. 17,024 396<br />
Gulfmark Offshore, Inc., Class A 15,187 682<br />
Heartland Express, Inc. 26,152 593<br />
Hub Group, Inc., Class A* 21,047 842<br />
International Shipholding Corp. 3,199 94<br />
Knight Transportation, Inc. 33,362 772<br />
Knightsbridge Tankers Ltd. 17,343 235<br />
NUMBER<br />
OF SHARES<br />
continued<br />
VALUE<br />
(000S)<br />
COMMON STOCKS - 97.1%<br />
Transportation - 1.8% continued<br />
Marten Transport Ltd. 13,333 $287<br />
Matson, Inc. 24,302 600<br />
Nordic American Tankers Ltd. 42,784 421<br />
Pacer International, Inc.* 20,101 180<br />
Patriot Transportation Holding, Inc.* 3,746 135<br />
PHI, Inc. (Non Voting)* 7,160 317<br />
Quality Distribution, Inc.* 11,965 155<br />
Roadrunner Transportation Systems, Inc.* 10,592 267<br />
Saia, Inc.* 13,812 528<br />
Scorpio Bulkers, Inc.* 75,086 759<br />
Scorpio Tankers, Inc. 105,076 1,048<br />
Ship Finance International Ltd. 31,808 572<br />
Swift Transportation Co.* 47,699 1,181<br />
Teekay Tankers Ltd., Class A 34,869 123<br />
Ultrapetrol Bahamas Ltd.* 12,015 37<br />
Universal Truckload Services, Inc. 3,138 91<br />
UTi Worldwide, Inc. 51,643 547<br />
Werner Enterprises, Inc. 25,981 663<br />
XPO Logistics, Inc.* 27,214 800<br />
YRC Worldwide, Inc.* 17,769 400<br />
17,662<br />
Trucking & Leasing - 0.2%<br />
Greenbrier (The) Cos., Inc.* 13,907 634<br />
TAL International Group, Inc.* 19,265 826<br />
Textainer Group Holdings Ltd. 12,133 464<br />
1,924<br />
Water-0.3%<br />
American States Water Co. 21,963 709<br />
Artesian Resources Corp., Class A 4,277 96<br />
California Water Service Group 27,190 651<br />
Connecticut Water Service, Inc. 6,168 211<br />
Consolidated Water Co. Ltd. 8,406 111<br />
Middlesex Water Co. 9,015 196<br />
PICO Holdings, Inc.* 12,926 336<br />
SJW Corp. 8,841 261<br />
York Water Co. 7,390 151<br />
2,722<br />
Total Common Stocks<br />
(Cost $653,743) 957,395<br />
OTHER - 0.0% (2)<br />
Escrow DLB Oil & Gas* 1,200 —<br />
Escrow Gerber Scientific, Inc.* 9,016 —<br />
See Notes to the Financial Statements.<br />
EQUITY INDEX FUNDS 104 NORTHERN FUNDS ANNUAL REPORT
MARCH 31, 2014<br />
NUMBER<br />
OF SHARES<br />
VALUE<br />
(000S)<br />
OTHER - 0.0% (2) continued<br />
Escrow Position PetroCorp* 420 $ —<br />
Total Other<br />
(Cost $ — ) —<br />
PRINCIPAL<br />
AMOUNT<br />
(000S)<br />
VALUE<br />
(000S)<br />
SHORT-TERM INVESTMENTS - 0.2%<br />
U.S. Treasury Bill,<br />
0.05%, 4/10/14 (5) $1,655 $1,655<br />
Total Short-Term Investments<br />
(Cost $1,655) 1,655<br />
RIGHTS - 0.0%<br />
Pharmaceuticals - 0.0%<br />
Omthera Pharmaceuticals, Inc.<br />
(Contingent Value Rights) (1) * 3,681 —<br />
Savings & Loans - 0.0%<br />
CSF Holdings, Inc. (1) * 6,212 —<br />
Telecommunications - 0.0%<br />
Leap Wireless International, Inc. (1) * 30,708 —<br />
Total Rights<br />
(Cost $ — ) —<br />
NUMBER<br />
OF<br />
WARRANTS<br />
VALUE<br />
(000S)<br />
WARRANTS - 0.0%<br />
Magnum Hunter Resources Corp.,<br />
Exp. 4/15/16, Strike $8.50* 9,488 $ —<br />
Tejon Ranch Co.,<br />
Exp. 8/31/16, Strike $40.00* 1,122 4<br />
Total Warrants<br />
(Cost $7) 4<br />
(1)<br />
(2)<br />
(3)<br />
(4)<br />
(5)<br />
*<br />
Total Investments - 100.5%<br />
(Cost $686,880) 990,529<br />
Liabilities less Other Assets - (0.5)% (4,864)<br />
NET ASSETS - 100.0% $985,665<br />
Level 3 asset that is worthless, bankrupt or has been delisted.<br />
Security listed as “escrow” is considered to be worthless.<br />
Investment in affiliated Portfolio. <strong>Northern</strong> Trust Investments, Inc. is the<br />
investment adviser to the Fund and the investment adviser to the <strong>Northern</strong><br />
Institutional <strong>Funds</strong>.<br />
At March 31, 2013, the value of the Fund’s investment in the Diversified Assets<br />
Portfolio of the <strong>Northern</strong> Institutional <strong>Funds</strong> was approximately $21,866,000<br />
with net purchases of approximately $9,609,000 during the fiscal year<br />
ended March 31, 2014.<br />
Security pledged as collateral to cover margin requirements for open futures<br />
contracts.<br />
Non-Income Producing Security<br />
Percentages shown are based on Net Assets. The classifications shown on the<br />
Schedule of Investments and in the tables herein are unaudited.<br />
At March 31, 2014, the Fund had open futures contracts as follows:<br />
TYPE<br />
NUMBER OF<br />
CONTRACTS<br />
NOTIONAL<br />
AMOUNT<br />
(000S)<br />
CONTRACT<br />
POSITION<br />
CONTRACT<br />
EXP.<br />
UNREALIZED<br />
GAINS (LOSSES)<br />
(000S)<br />
Russell 2000<br />
Mini <strong>Index</strong> 241 $28,209 Long 6/14 $(208)<br />
NUMBER<br />
OF SHARES<br />
VALUE<br />
(000S)<br />
INVESTMENT COMPANIES - 3.2%<br />
<strong>Northern</strong> Institutional <strong>Funds</strong> -<br />
Diversified Assets Portfolio, 0.01% (3) (4) 31,474,681 $31,475<br />
Total Investment Companies<br />
(Cost $31,475) 31,475<br />
At March 31, 2014, the industry sectors (unaudited) for the Fund were:<br />
% OF LONG-TERM<br />
INDUSTRY SECTOR<br />
INVESTMENTS<br />
Consumer Discretionary 13.0%<br />
Consumer Staples 3.7<br />
Energy 5.7<br />
Financials 23.2<br />
Health Care 13.5<br />
Industrials 14.5<br />
Information Technology 17.7<br />
Materials 4.9<br />
Telecommunication Services 0.7<br />
Utilities 3.1<br />
Total 100.0%<br />
See Notes to the Financial Statements.<br />
NORTHERN FUNDS ANNUAL REPORT 105 EQUITY INDEX FUNDS
SCHEDULE OF INVESTMENTS<br />
SMALL CAP INDEX FUND continued MARCH 31, 2014<br />
Various inputs are used in determining the value of the Fund’s investments. These<br />
inputs are summarized in three levels listed below:<br />
INVESTMENTS<br />
LEVEL 1<br />
(000S)<br />
LEVEL 2<br />
(000S)<br />
LEVEL 3<br />
(000S)<br />
TOTAL<br />
(000S)<br />
Level 1 - Unadjusted quoted market prices in active markets for identical securities<br />
on the measurement date.<br />
Level 2 - Other observable inputs (e.g., quoted prices in active markets for similar<br />
securities, securities valuations based on commonly quoted benchmark interest<br />
rates and yield curves, maturities, ratings and/or securities indices).<br />
Level 3 - Significant unobservable inputs (e.g., information about assumptions<br />
including risk, market participants would use in pricing a strategy).<br />
The inputs or methodologies used for valuing securities are not necessarily an<br />
indication of the risk associated with investing in those securities and other<br />
financial instruments, if any. The following table summarizes the valuation of the<br />
Fund’s investments by the above fair value hierarchy as of March 31, 2014:<br />
LEVEL 1<br />
(000S)<br />
LEVEL 2<br />
(000S)<br />
LEVEL 3<br />
(000S)<br />
TOTAL<br />
(000S)<br />
INVESTMENTS<br />
Common Stocks<br />
Pharmaceuticals $ 27,291 $ 101 $ — $ 27,392<br />
Coal 3,267 — —* 3,267<br />
All Other Industries 926,736 (1) — — 926,736<br />
Warrants 4 — — 4<br />
Investment Companies 31,475 — — 31,475<br />
Short-Term Investments — 1,655 — 1,655<br />
Total Investments $988,773 $1,756 $ — $990,529<br />
OTHER FINANCIAL<br />
INSTRUMENTS<br />
Liabilities<br />
Futures Contracts $(208) $— $— $(208)<br />
(1)<br />
*<br />
Classifications as defined in the Schedule of Investments.<br />
Amount rounds to less than one thousand.<br />
The Fund discloses all transfers between levels based on valuations at the end of<br />
each reporting period.<br />
At March 31, 2014, the Fund had transfers from Level 1 to Level 2 as disclosed<br />
below:<br />
Transfers from Level 1 to Level 2<br />
Industry<br />
Common Stocks<br />
Pharmaceuticals<br />
Value<br />
(000S)<br />
Reason<br />
$101 Halted Price. Valuations at last traded price.<br />
The following is a reconciliation of investments in which significant unobservable inputs (Level 3) were used in determining fair value:<br />
BALANCE<br />
AS OF<br />
3/31/13<br />
(000S)<br />
REALIZED<br />
GAINS<br />
(LOSSES)<br />
(000S)<br />
CHANGE IN<br />
UNREALIZED<br />
APPRECIATION<br />
(DEPRECIATION)<br />
(000S)<br />
PURCHASES<br />
(000S)<br />
SALES<br />
(000S)<br />
TRANSFERS<br />
INTO<br />
LEVEL 3<br />
(000S)<br />
TRANSFERS<br />
OUT OF<br />
LEVEL 3<br />
(000S)<br />
BALANCE<br />
AS OF<br />
3/31/14<br />
(000S)<br />
CHANGE IN UNREALIZED<br />
APPRECIATION<br />
(DEPRECIATION) FROM<br />
INVESTMENTS STILL HELD<br />
AT 3/31/14<br />
(000S)<br />
Common Stock<br />
Coal $ — $ — $(61) $61 $ — $ — $ — $ — $(61)<br />
The Fund valued the securities included in the balance as of 3/31/14 above using an evaluated price from a third party provider.<br />
See Notes to the Financial Statements.<br />
EQUITY INDEX FUNDS 106 NORTHERN FUNDS ANNUAL REPORT
SCHEDULE OF INVESTMENTS<br />
STOCK INDEX FUND MARCH 31, 2014<br />
NUMBER<br />
OF SHARES<br />
VALUE<br />
(000S)<br />
COMMON STOCKS - 97.5%<br />
Advertising - 0.2%<br />
Interpublic Group of (The) Cos., Inc. 139,574 $2,392<br />
Omnicom Group, Inc. 84,981 6,170<br />
8,562<br />
Aerospace/Defense - 2.0%<br />
Boeing (The) Co. 225,104 28,248<br />
General Dynamics Corp. 107,021 11,657<br />
L-3 Communications Holdings, Inc. 28,261 3,339<br />
Lockheed Martin Corp. 88,875 14,508<br />
Northrop Grumman Corp. 71,338 8,802<br />
Raytheon Co. 103,526 10,227<br />
Rockwell Collins, Inc. 44,608 3,554<br />
United Technologies Corp. 277,145 32,382<br />
112,717<br />
Agriculture - 1.6%<br />
Altria Group, Inc. 655,513 24,536<br />
Archer-Daniels-Midland Co. 216,929 9,412<br />
Lorillard, Inc. 119,221 6,447<br />
Philip Morris International, Inc. 521,762 42,717<br />
Reynolds American, Inc. 102,763 5,490<br />
88,602<br />
Airlines - 0.3%<br />
Delta Air Lines, Inc. 279,053 9,669<br />
Southwest Airlines Co. 231,557 5,467<br />
15,136<br />
Apparel - 0.6%<br />
Michael Kors Holdings Ltd.* 58,991 5,502<br />
NIKE, Inc., Class B 244,931 18,090<br />
Ralph Lauren Corp. 19,524 3,142<br />
VF Corp. 116,059 7,182<br />
33,916<br />
Auto Manufacturers - 0.8%<br />
Ford Motor Co. 1,298,025 20,249<br />
General Motors Co. 428,999 14,766<br />
PACCAR, Inc. 116,804 7,878<br />
42,893<br />
Auto Parts & Equipment - 0.4%<br />
BorgWarner, Inc. 74,652 4,589<br />
Delphi Automotive PLC 91,835 6,232<br />
Goodyear Tire & Rubber (The) Co. 82,135 2,146<br />
Johnson Controls, Inc. 218,531 10,341<br />
23,308<br />
NUMBER<br />
OF SHARES<br />
continued<br />
VALUE<br />
(000S)<br />
COMMON STOCKS - 97.5%<br />
Banks - 7.6%<br />
Bank of America Corp. 3,478,320 $59,827<br />
Bank of New York Mellon (The) Corp. 373,744 13,190<br />
BB&T Corp. 234,009 9,400<br />
Capital One Financial Corp. 188,374 14,535<br />
Citigroup, Inc. 999,350 47,569<br />
Comerica, Inc. 59,959 3,106<br />
Fifth Third Bancorp 280,192 6,430<br />
Goldman Sachs Group (The), Inc. 138,623 22,713<br />
Huntington Bancshares, Inc. 274,161 2,733<br />
JPMorgan Chase & Co. 1,246,376 75,668<br />
KeyCorp 294,234 4,190<br />
M&T Bank Corp. 43,140 5,233<br />
Morgan Stanley 461,796 14,394<br />
<strong>Northern</strong> Trust Corp. (1) (2) 71,137 4,664<br />
PNC Financial Services Group (The), Inc. 175,780 15,293<br />
Regions Financial Corp. 467,070 5,189<br />
State Street Corp. 142,099 9,883<br />
SunTrust Banks, Inc. 175,517 6,984<br />
US Bancorp 599,924 25,713<br />
Wells Fargo & Co. 1,576,040 78,392<br />
Zions Bancorporation 60,951 1,888<br />
426,994<br />
Beverages-2.2%<br />
Beam, Inc. 54,458 4,536<br />
Brown-Forman Corp., Class B 53,570 4,805<br />
Coca-Cola (The) Co. 1,247,164 48,215<br />
Coca-Cola Enterprises, Inc. 78,132 3,732<br />
Constellation Brands, Inc., Class A* 54,761 4,653<br />
Dr Pepper Snapple Group, Inc. 64,727 3,525<br />
Keurig Green Mountain, Inc. 42,508 4,488<br />
Molson Coors Brewing Co., Class B 52,119 3,068<br />
Monster Beverage Corp.* 44,779 3,110<br />
PepsiCo, Inc. 501,137 41,845<br />
121,977<br />
Biotechnology - 2.3%<br />
Alexion Pharmaceuticals, Inc.* 65,112 9,905<br />
Amgen, Inc. 248,503 30,650<br />
Biogen Idec, Inc.* 77,806 23,799<br />
Celgene Corp.* 133,632 18,655<br />
Gilead Sciences, Inc.* 506,295 35,876<br />
Regeneron Pharmaceuticals, Inc.* 25,919 7,783<br />
Vertex Pharmaceuticals, Inc.* 77,589 5,487<br />
132,155<br />
See Notes to the Financial Statements.<br />
NORTHERN FUNDS ANNUAL REPORT 107 EQUITY INDEX FUNDS
SCHEDULE OF INVESTMENTS<br />
STOCK INDEX FUND continued<br />
NUMBER<br />
OF SHARES<br />
continued<br />
VALUE<br />
(000S)<br />
COMMON STOCKS - 97.5%<br />
Building Materials - 0.1%<br />
Masco Corp. 118,150 $2,624<br />
Vulcan Materials Co. 42,690 2,837<br />
5,461<br />
Chemicals - 2.6%<br />
Air Products & Chemicals, Inc. 69,666 8,293<br />
Airgas, Inc. 21,864 2,329<br />
CF Industries Holdings, Inc. 18,255 4,758<br />
Dow Chemical (The) Co. 400,179 19,445<br />
E.I. du Pont de Nemours & Co. 305,134 20,474<br />
Eastman Chemical Co. 50,261 4,333<br />
Ecolab, Inc. 88,930 9,603<br />
FMC Corp. 43,663 3,343<br />
International Flavors & Fragrances, Inc. 27,000 2,583<br />
LyondellBasell Industries N.V., Class A 142,114 12,640<br />
Monsanto Co. 172,825 19,662<br />
Mosaic (The) Co. 111,358 5,568<br />
PPG Industries, Inc. 45,588 8,819<br />
Praxair, Inc. 96,854 12,685<br />
Sherwin-Williams (The) Co. 27,997 5,519<br />
Sigma-Aldrich Corp. 39,159 3,657<br />
143,711<br />
Coal - 0.1%<br />
CONSOL Energy, Inc. 75,583 3,020<br />
Peabody Energy Corp. 88,822 1,451<br />
4,471<br />
Commercial Services - 1.3%<br />
ADT (The) Corp. 60,299 1,806<br />
Alliance Data Systems Corp.* 17,502 4,768<br />
Automatic Data Processing, Inc. 158,677 12,259<br />
Cintas Corp. 32,973 1,966<br />
Equifax, Inc. 40,003 2,721<br />
H&R Block, Inc. 90,437 2,730<br />
Iron Mountain, Inc. 55,924 1,542<br />
MasterCard, Inc., Class A 335,871 25,090<br />
McGraw Hill Financial, Inc. 89,475 6,827<br />
Moody’s Corp. 62,081 4,924<br />
Quanta Services, Inc.* 71,665 2,645<br />
Robert Half International, Inc. 44,706 1,875<br />
Total System Services, Inc. 55,083 1,675<br />
Western Union (The) Co. 179,200 2,932<br />
73,760<br />
Computers - 5.6%<br />
Accenture PLC, Class A 209,672 16,715<br />
NUMBER<br />
OF SHARES<br />
continued<br />
VALUE<br />
(000S)<br />
COMMON STOCKS - 97.5%<br />
Computers - 5.6% continued<br />
Apple, Inc. 293,587 $157,580<br />
Cognizant Technology Solutions Corp.,<br />
Class A* 199,929 10,118<br />
Computer Sciences Corp. 47,842 2,910<br />
EMC Corp. 666,640 18,273<br />
Hewlett-Packard Co. 623,749 20,184<br />
International Business Machines Corp. 322,193 62,019<br />
NetApp, Inc. 108,993 4,022<br />
SanDisk Corp. 74,481 6,047<br />
Seagate Technology PLC 108,188 6,076<br />
Teradata Corp.* 52,394 2,577<br />
Western Digital Corp. 69,025 6,338<br />
312,859<br />
Cosmetics/Personal Care - 1.7%<br />
Avon Products, Inc. 143,198 2,096<br />
Colgate-Palmolive Co. 287,338 18,640<br />
Estee Lauder (The) Cos., Inc., Class A 83,741 5,601<br />
Procter & Gamble (The) Co. 892,586 71,942<br />
98,279<br />
Distribution/Wholesale - 0.3%<br />
Fastenal Co. 90,140 4,446<br />
Fossil Group, Inc.* 15,685 1,829<br />
Genuine Parts Co. 50,501 4,386<br />
WW Grainger, Inc. 20,226 5,110<br />
15,771<br />
Diversified Financial Services - 2.6%<br />
American Express Co. 300,875 27,088<br />
Ameriprise Financial, Inc. 62,902 6,924<br />
BlackRock, Inc. 41,360 13,007<br />
Charles Schwab (The) Corp. 384,777 10,516<br />
CME Group, Inc. 103,876 7,688<br />
Discover Financial Services 155,125 9,027<br />
E*TRADE Financial Corp.* 94,870 2,184<br />
Franklin Resources, Inc. 133,435 7,229<br />
IntercontinentalExchange Group, Inc. 37,718 7,462<br />
Invesco Ltd. 142,608 5,276<br />
Legg Mason, Inc. 34,934 1,713<br />
NASDAQ OMX Group (The), Inc. 37,993 1,403<br />
SLM Corp. 140,123 3,430<br />
T Rowe Price Group, Inc. 86,315 7,108<br />
Visa, Inc., Class A 166,944 36,037<br />
146,092<br />
See Notes to the Financial Statements.<br />
EQUITY INDEX FUNDS 108 NORTHERN FUNDS ANNUAL REPORT
MARCH 31, 2014<br />
NUMBER<br />
OF SHARES<br />
continued<br />
VALUE<br />
(000S)<br />
COMMON STOCKS - 97.5%<br />
Electric - 2.7%<br />
AES Corp. 215,431 $3,076<br />
Ameren Corp. 80,028 3,297<br />
American Electric Power Co., Inc. 160,654 8,139<br />
CMS Energy Corp. 87,763 2,570<br />
Consolidated Edison, Inc. 96,682 5,187<br />
Dominion Resources, Inc. 191,255 13,577<br />
DTE Energy Co. 58,419 4,340<br />
Duke Energy Corp. 232,485 16,558<br />
Edison International 107,451 6,083<br />
Entergy Corp. 58,893 3,937<br />
Exelon Corp. 282,619 9,485<br />
FirstEnergy Corp. 138,134 4,701<br />
Integrys Energy Group, Inc. 26,578 1,585<br />
NextEra Energy, Inc. 143,246 13,697<br />
Northeast Utilities 103,875 4,726<br />
NRG Energy, Inc. 106,660 3,392<br />
Pepco Holdings, Inc. 83,187 1,704<br />
PG&E Corp. 150,407 6,498<br />
Pinnacle West Capital Corp. 35,977 1,966<br />
PPL Corp. 206,892 6,856<br />
Public Service Enterprise Group, Inc. 166,712 6,358<br />
SCANA Corp. 46,250 2,374<br />
Southern (The) Co. 291,994 12,830<br />
TECO Energy, Inc. 68,774 1,179<br />
Wisconsin Energy Corp. 73,812 3,436<br />
Xcel Energy, Inc. 164,151 4,984<br />
152,535<br />
Electrical Components & Equipment - 0.3%<br />
AMETEK, Inc. 80,672 4,154<br />
Emerson Electric Co. 231,675 15,476<br />
19,630<br />
Electronics - 1.4%<br />
Agilent Technologies, Inc. 109,741 6,137<br />
Allegion PLC 29,403 1,534<br />
Amphenol Corp., Class A 51,890 4,756<br />
FLIR Systems, Inc. 46,718 1,682<br />
Garmin Ltd. 40,675 2,248<br />
Honeywell International, Inc. 258,101 23,941<br />
Jabil Circuit, Inc. 62,149 1,119<br />
PerkinElmer, Inc. 36,671 1,652<br />
TE Connectivity Ltd. 134,577 8,103<br />
Thermo Fisher Scientific, Inc. 128,956 15,505<br />
Tyco International Ltd. 151,439 6,421<br />
NUMBER<br />
OF SHARES<br />
continued<br />
VALUE<br />
(000S)<br />
COMMON STOCKS - 97.5%<br />
Electronics - 1.4% continued<br />
Waters Corp.* 28,162 $3,053<br />
76,151<br />
Engineering & Construction - 0.1%<br />
Fluor Corp. 52,589 4,088<br />
Jacobs Engineering Group, Inc.* 43,473 2,760<br />
6,848<br />
Entertainment - 0.0%<br />
International Game Technology 81,629 1,148<br />
Environmental Control - 0.2%<br />
Republic Services, Inc. 89,786 3,067<br />
Stericycle, Inc.* 27,960 3,177<br />
Waste Management, Inc. 142,922 6,013<br />
12,257<br />
Food - 1.7%<br />
Campbell Soup Co. 58,968 2,646<br />
ConAgra Foods, Inc. 137,804 4,276<br />
General Mills, Inc. 205,665 10,658<br />
Hershey (The) Co. 49,394 5,157<br />
Hormel Foods Corp. 44,447 2,190<br />
JM Smucker (The) Co. 34,224 3,328<br />
Kellogg Co. 84,158 5,278<br />
Kraft Foods Group, Inc. 196,358 11,016<br />
Kroger (The) Co. 169,987 7,420<br />
McCormick & Co., Inc. (Non Voting) 42,900 3,078<br />
Mondelez International, Inc., Class A 559,882 19,344<br />
Safeway, Inc. 75,808 2,800<br />
Sysco Corp. 192,594 6,958<br />
Tyson Foods, Inc., Class A 89,055 3,919<br />
Whole Foods Market, Inc. 121,990 6,186<br />
94,254<br />
Forest Products & Paper - 0.2%<br />
International Paper Co. 144,393 6,625<br />
MeadWestvaco Corp. 57,089 2,149<br />
8,774<br />
Gas-0.3%<br />
AGL Resources, Inc. 38,732 1,896<br />
CenterPoint Energy, Inc. 141,483 3,352<br />
NiSource, Inc. 103,136 3,664<br />
Sempra Energy 74,897 7,247<br />
16,159<br />
See Notes to the Financial Statements.<br />
NORTHERN FUNDS ANNUAL REPORT 109 EQUITY INDEX FUNDS
SCHEDULE OF INVESTMENTS<br />
STOCK INDEX FUND continued<br />
NUMBER<br />
OF SHARES<br />
continued<br />
VALUE<br />
(000S)<br />
COMMON STOCKS - 97.5%<br />
Hand/Machine Tools - 0.1%<br />
Snap-on, Inc. 19,240 $2,184<br />
Stanley Black & Decker, Inc. 51,517 4,185<br />
6,369<br />
Healthcare - Products - 1.8%<br />
Baxter International, Inc. 178,813 13,157<br />
Becton Dickinson and Co. 63,618 7,448<br />
Boston Scientific Corp.* 434,017 5,868<br />
CareFusion Corp.* 68,037 2,736<br />
Covidien PLC 148,388 10,930<br />
CR Bard, Inc. 25,541 3,780<br />
DENTSPLY International, Inc. 46,842 2,157<br />
Edwards Lifesciences Corp.* 35,189 2,610<br />
Hospira, Inc.* 54,711 2,366<br />
Intuitive Surgical, Inc.* 12,593 5,516<br />
Medtronic, Inc. 329,437 20,274<br />
Patterson Cos., Inc. 26,712 1,116<br />
St. Jude Medical, Inc. 93,428 6,109<br />
Stryker Corp. 97,293 7,926<br />
Varian Medical Systems, Inc.* 34,048 2,860<br />
Zimmer Holdings, Inc. 55,467 5,246<br />
100,099<br />
Healthcare - Services - 1.2%<br />
Aetna, Inc. 119,406 8,952<br />
Cigna Corp. 89,977 7,534<br />
DaVita HealthCare Partners, Inc.* 58,274 4,012<br />
Humana, Inc. 50,657 5,710<br />
Laboratory Corp. of America Holdings* 28,086 2,758<br />
Quest Diagnostics, Inc. 47,637 2,759<br />
Tenet Healthcare Corp.* 32,296 1,383<br />
UnitedHealth Group, Inc. 325,612 26,697<br />
WellPoint, Inc. 92,982 9,256<br />
69,061<br />
Holding Companies - Diversified - 0.1%<br />
Leucadia National Corp. 103,603 2,901<br />
Home Builders - 0.1%<br />
DR Horton, Inc. 93,805 2,031<br />
Lennar Corp., Class A 57,940 2,295<br />
PulteGroup, Inc. 112,751 2,164<br />
6,490<br />
Home Furnishings - 0.1%<br />
Harman International Industries, Inc. 22,334 2,376<br />
NUMBER<br />
OF SHARES<br />
COMMON STOCKS - 97.5% continued<br />
Home Furnishings - 0.1% continued<br />
VALUE<br />
(000S)<br />
Whirlpool Corp. 25,396 $3,796<br />
6,172<br />
Household Products/Wares - 0.3%<br />
Avery Dennison Corp. 31,353 1,589<br />
Clorox (The) Co. 42,901 3,776<br />
Kimberly-Clark Corp. 124,667 13,744<br />
19,109<br />
Housewares - 0.0%<br />
Newell Rubbermaid, Inc. 91,916 2,748<br />
Insurance - 4.1%<br />
ACE Ltd. 110,767 10,972<br />
Aflac, Inc. 150,010 9,457<br />
Allstate (The) Corp. 147,122 8,324<br />
American International Group, Inc. 481,698 24,090<br />
American International Group, Inc.,<br />
(Fractional Shares)* 81,909 —<br />
Aon PLC 99,302 8,369<br />
Assurant, Inc. 23,871 1,551<br />
Berkshire Hathaway, Inc., Class B* 592,518 74,047<br />
Chubb (The) Corp. 80,769 7,213<br />
Cincinnati Financial Corp. 48,661 2,368<br />
Genworth Financial, Inc., Class A* 162,994 2,890<br />
Hartford Financial Services Group<br />
(The), Inc. 146,686 5,174<br />
Lincoln National Corp. 87,061 4,411<br />
Loews Corp. 101,178 4,457<br />
Marsh & McLennan Cos., Inc. 180,941 8,920<br />
MetLife, Inc. 369,739 19,522<br />
Principal Financial Group, Inc. 90,404 4,158<br />
Progressive (The) Corp. 180,710 4,377<br />
Prudential Financial, Inc. 152,411 12,902<br />
Torchmark Corp. 28,940 2,277<br />
Travelers (The) Cos., Inc. 115,904 9,863<br />
Unum Group 85,540 3,020<br />
XL Group PLC 90,682 2,834<br />
231,196<br />
Internet - 4.5%<br />
Amazon.com, Inc.* 122,437 41,202<br />
eBay, Inc.* 383,485 21,184<br />
Expedia, Inc. 33,755 2,447<br />
F5 Networks, Inc.* 24,794 2,644<br />
Facebook, Inc., Class A* 562,268 33,871<br />
Google, Inc., Class A* 92,909 103,548<br />
See Notes to the Financial Statements.<br />
EQUITY INDEX FUNDS 110 NORTHERN FUNDS ANNUAL REPORT
MARCH 31, 2014<br />
NUMBER<br />
OF SHARES<br />
continued<br />
VALUE<br />
(000S)<br />
COMMON STOCKS - 97.5%<br />
Internet - 4.5% continued<br />
Netflix, Inc.* 19,683 $6,929<br />
Priceline Group (The), Inc.* 17,158 20,450<br />
Symantec Corp. 228,179 4,557<br />
TripAdvisor, Inc.* 36,683 3,323<br />
VeriSign, Inc.* 41,273 2,225<br />
Yahoo!, Inc.* 309,299 11,104<br />
253,484<br />
Iron/Steel - 0.2%<br />
Allegheny Technologies, Inc. 35,834 1,350<br />
Cliffs Natural Resources, Inc. 49,583 1,015<br />
Nucor Corp. 105,138 5,314<br />
United States Steel Corp. 48,507 1,339<br />
9,018<br />
Leisure Time - 0.2%<br />
Carnival Corp. 144,471 5,470<br />
Harley-Davidson, Inc. 72,474 4,827<br />
10,297<br />
Lodging - 0.3%<br />
Marriott International, Inc., Class A 72,734 4,075<br />
Starwood Hotels & Resorts<br />
Worldwide, Inc. 63,416 5,048<br />
Wyndham Worldwide Corp. 42,029 3,078<br />
Wynn Resorts Ltd. 26,655 5,921<br />
18,122<br />
Machinery - Construction & Mining - 0.4%<br />
Caterpillar, Inc. 209,914 20,859<br />
Joy Global, Inc. 32,898 1,908<br />
22,767<br />
Machinery - Diversified - 0.6%<br />
Cummins, Inc. 57,122 8,511<br />
Deere & Co. 121,660 11,047<br />
Flowserve Corp. 45,079 3,531<br />
Rockwell Automation, Inc. 45,751 5,698<br />
Roper Industries, Inc. 32,757 4,373<br />
Xylem, Inc. 60,843 2,216<br />
35,376<br />
Media - 3.4%<br />
Cablevision Systems Corp.,<br />
Class A (Registered) 69,689 1,176<br />
CBS Corp., Class B (Non Voting) 181,604 11,223<br />
Comcast Corp., Class A 857,909 42,913<br />
DIRECTV* 155,953 11,918<br />
NUMBER<br />
OF SHARES<br />
continued<br />
VALUE<br />
(000S)<br />
COMMON STOCKS - 97.5%<br />
Media - 3.4% continued<br />
Discovery Communications, Inc., Class A* 73,193 $6,053<br />
Gannett Co., Inc. 75,086 2,072<br />
Graham Holdings Co., Class B 1,456 1,025<br />
News Corp., Class A* 164,420 2,831<br />
Nielsen Holdings N.V. 94,003 4,195<br />
Scripps Networks Interactive, Inc., Class A 36,150 2,744<br />
Time Warner Cable, Inc. 91,320 12,527<br />
Time Warner, Inc. 293,800 19,194<br />
Twenty-First Century Fox, Inc., Class A 638,770 20,422<br />
Viacom, Inc., Class B 131,171 11,148<br />
Walt Disney (The) Co. 536,325 42,944<br />
192,385<br />
Metal Fabrication/Hardware - 0.2%<br />
Precision Castparts Corp. 47,811 12,085<br />
Mining - 0.4%<br />
Alcoa, Inc. 353,284 4,547<br />
Freeport-McMoRan Copper & Gold, Inc. 341,901 11,307<br />
Newmont Mining Corp. 164,362 3,852<br />
19,706<br />
Miscellaneous Manufacturing - 3.2%<br />
3M Co. 207,200 28,109<br />
Danaher Corp. 197,655 14,824<br />
Dover Corp. 55,818 4,563<br />
Eaton Corp. PLC 156,362 11,746<br />
General Electric Co. 3,302,251 85,495<br />
Illinois Tool Works, Inc. 128,581 10,458<br />
Ingersoll-Rand PLC 85,036 4,868<br />
Leggett & Platt, Inc. 45,415 1,482<br />
Pall Corp. 36,354 3,253<br />
Parker Hannifin Corp. 48,846 5,847<br />
Pentair Ltd. (Registered) 65,092 5,164<br />
Textron, Inc. 92,670 3,641<br />
179,450<br />
Office/Business Equipment - 0.1%<br />
Pitney Bowes, Inc. 67,549 1,756<br />
Xerox Corp. 366,566 4,142<br />
5,898<br />
Oil&Gas-7.8%<br />
Anadarko Petroleum Corp. 165,781 14,052<br />
Apache Corp. 129,864 10,772<br />
Cabot Oil & Gas Corp. 139,014 4,710<br />
Chesapeake Energy Corp. 167,410 4,289<br />
See Notes to the Financial Statements.<br />
NORTHERN FUNDS ANNUAL REPORT 111 EQUITY INDEX FUNDS
SCHEDULE OF INVESTMENTS<br />
STOCK INDEX FUND continued<br />
NUMBER<br />
OF SHARES<br />
continued<br />
VALUE<br />
(000S)<br />
COMMON STOCKS - 97.5%<br />
Oil & Gas - 7.8% continued<br />
Chevron Corp. 628,346 $74,717<br />
ConocoPhillips 403,496 28,386<br />
Denbury Resources, Inc. 116,971 1,918<br />
Devon Energy Corp. 126,005 8,434<br />
Diamond Offshore Drilling, Inc. 22,909 1,117<br />
Ensco PLC, Class A 77,308 4,080<br />
EOG Resources, Inc. 89,886 17,633<br />
EQT Corp. 49,660 4,816<br />
Exxon Mobil Corp. 1,422,269 138,927<br />
Helmerich & Payne, Inc. 35,192 3,785<br />
Hess Corp. 89,879 7,449<br />
Marathon Oil Corp. 229,997 8,170<br />
Marathon Petroleum Corp. 96,940 8,438<br />
Murphy Oil Corp. 56,392 3,545<br />
Nabors Industries Ltd. 85,288 2,102<br />
Newfield Exploration Co.* 44,848 1,406<br />
Noble Corp. PLC 84,063 2,752<br />
Noble Energy, Inc. 118,599 8,425<br />
Occidental Petroleum Corp. 261,536 24,922<br />
Phillips 66 193,385 14,902<br />
Pioneer Natural Resources Co. 47,041 8,803<br />
QEP Resources, Inc. 58,674 1,727<br />
Range Resources Corp. 53,902 4,472<br />
RowanCos.PLC,ClassA* 40,414 1,361<br />
Southwestern Energy Co.* 116,151 5,344<br />
Tesoro Corp. 43,586 2,205<br />
Transocean Ltd. 112,096 4,634<br />
Valero Energy Corp. 175,246 9,306<br />
437,599<br />
Oil & Gas Services - 1.5%<br />
Baker Hughes, Inc. 143,898 9,356<br />
Cameron International Corp.* 71,079 4,391<br />
FMC Technologies, Inc.* 77,319 4,043<br />
Halliburton Co. 280,069 16,493<br />
National Oilwell Varco, Inc. 141,178 10,994<br />
Schlumberger Ltd. 430,319 41,956<br />
87,233<br />
Packaging & Containers - 0.1%<br />
Ball Corp. 46,113 2,527<br />
Bemis Co., Inc. 33,414 1,311<br />
Owens-Illinois, Inc.* 54,277 1,836<br />
Sealed Air Corp. 64,603 2,124<br />
7,798<br />
NUMBER<br />
OF SHARES<br />
continued<br />
VALUE<br />
(000S)<br />
COMMON STOCKS - 97.5%<br />
Pharmaceuticals - 7.2%<br />
Abbott Laboratories 508,149 $19,569<br />
AbbVie, Inc. 522,870 26,876<br />
Actavis PLC* 57,338 11,803<br />
Allergan, Inc. 98,241 12,192<br />
AmerisourceBergen Corp. 75,357 4,943<br />
Bristol-Myers Squibb Co. 541,119 28,111<br />
Cardinal Health, Inc. 112,890 7,900<br />
Eli Lilly & Co. 324,131 19,078<br />
Express Scripts Holding Co.* 255,447 19,181<br />
Forest Laboratories, Inc.* 78,520 7,245<br />
Johnson & Johnson 931,146 91,466<br />
McKesson Corp. 75,752 13,376<br />
Mead Johnson Nutrition Co. 66,216 5,505<br />
Merck & Co., Inc. 967,918 54,949<br />
Mylan, Inc.* 122,413 5,977<br />
Perrigo Co. PLC 44,032 6,810<br />
Pfizer, Inc. 2,100,914 67,481<br />
Zoetis, Inc. 165,200 4,781<br />
407,243<br />
Pipelines - 0.5%<br />
Kinder Morgan, Inc. 220,801 7,174<br />
ONEOK, Inc. 68,385 4,052<br />
Spectra Energy Corp. 220,878 8,159<br />
Williams (The) Cos., Inc. 225,342 9,144<br />
28,529<br />
Real Estate - 0.0%<br />
CBRE Group, Inc., Class A* 91,708 2,516<br />
Real Estate Investment Trusts - 2.0%<br />
American Tower Corp. 130,069 10,649<br />
Apartment Investment & Management Co.,<br />
Class A 48,263 1,458<br />
AvalonBay Communities, Inc. 40,131 5,270<br />
Boston Properties, Inc. 50,332 5,764<br />
Crown Castle International Corp. 109,504 8,079<br />
<strong>Equity</strong> Residential 110,557 6,411<br />
General Growth Properties, Inc. 171,329 3,769<br />
HCP, Inc. 150,347 5,832<br />
Health Care REIT, Inc. 95,581 5,697<br />
Host Hotels & Resorts, Inc. 250,107 5,062<br />
Kimco Realty Corp. 135,269 2,960<br />
Macerich (The) Co. 46,431 2,894<br />
Plum Creek Timber Co., Inc. 57,827 2,431<br />
Prologis, Inc. 164,486 6,716<br />
See Notes to the Financial Statements.<br />
EQUITY INDEX FUNDS 112 NORTHERN FUNDS ANNUAL REPORT
MARCH 31, 2014<br />
NUMBER<br />
OF SHARES<br />
COMMON STOCKS - 97.5% continued<br />
Real Estate Investment Trusts - 2.0% continued<br />
VALUE<br />
(000S)<br />
Public Storage 47,656 $8,030<br />
Simon Property Group, Inc. 103,361 16,951<br />
Ventas, Inc. 96,811 5,864<br />
Vornado Realty Trust 57,363 5,654<br />
Weyerhaeuser Co. 192,851 5,660<br />
115,151<br />
Retail - 6.0%<br />
AutoNation, Inc.* 20,807 1,108<br />
AutoZone, Inc.* 11,067 5,944<br />
Bed Bath & Beyond, Inc.* 70,408 4,844<br />
Best Buy Co., Inc. 89,075 2,352<br />
CarMax, Inc.* 73,911 3,459<br />
Chipotle Mexican Grill, Inc.* 10,191 5,789<br />
Coach, Inc. 90,923 4,515<br />
Costco Wholesale Corp. 144,776 16,169<br />
CVS Caremark Corp. 389,248 29,139<br />
Darden Restaurants, Inc. 43,046 2,185<br />
Dollar General Corp.* 96,614 5,360<br />
Dollar Tree, Inc.* 68,778 3,589<br />
Family Dollar Stores, Inc. 31,077 1,803<br />
GameStop Corp., Class A 38,094 1,566<br />
Gap (The), Inc. 86,856 3,479<br />
Home Depot (The), Inc. 463,607 36,685<br />
Kohl’s Corp. 65,995 3,749<br />
L Brands, Inc. 80,457 4,568<br />
Lowe’s Cos., Inc. 344,284 16,836<br />
Macy’s, Inc. 121,704 7,216<br />
McDonald’s Corp. 325,587 31,917<br />
Nordstrom, Inc. 46,749 2,919<br />
O’Reilly Automotive, Inc.* 34,850 5,171<br />
PetSmart, Inc. 34,280 2,362<br />
PVH Corp. 26,935 3,361<br />
Ross Stores, Inc. 70,831 5,068<br />
Staples, Inc. 213,669 2,423<br />
Starbucks Corp. 248,818 18,258<br />
Target Corp. 208,263 12,602<br />
Tiffany & Co. 36,326 3,129<br />
TJX (The) Cos., Inc. 234,232 14,206<br />
Tractor Supply Co. 45,758 3,232<br />
Urban Outfitters, Inc.* 36,012 1,313<br />
Walgreen Co. 287,738 18,999<br />
Wal-Mart Stores, Inc. 532,641 40,710<br />
Yum! Brands, Inc. 145,983 11,006<br />
337,031<br />
NUMBER<br />
OF SHARES<br />
continued<br />
VALUE<br />
(000S)<br />
COMMON STOCKS - 97.5%<br />
Savings & Loans - 0.1%<br />
Hudson City Bancorp, Inc. 155,300 $1,527<br />
People’s United Financial, Inc. 102,835 1,529<br />
3,056<br />
Semiconductors - 2.8%<br />
Altera Corp. 104,133 3,774<br />
Analog Devices, Inc. 102,767 5,461<br />
Applied Materials, Inc. 398,532 8,138<br />
Broadcom Corp., Class A 181,569 5,716<br />
First Solar, Inc.* 23,449 1,637<br />
Intel Corp. 1,636,398 42,235<br />
KLA-Tencor Corp. 54,761 3,786<br />
Lam Research Corp.* 53,859 2,962<br />
Linear Technology Corp. 78,129 3,804<br />
LSI Corp. 183,765 2,034<br />
Microchip Technology, Inc. 65,180 3,113<br />
Micron Technology, Inc.* 349,162 8,261<br />
NVIDIA Corp. 182,352 3,266<br />
QUALCOMM, Inc. 556,567 43,891<br />
Texas Instruments, Inc. 356,728 16,820<br />
Xilinx, Inc. 87,966 4,774<br />
159,672<br />
Software - 3.9%<br />
Adobe Systems, Inc.* 153,165 10,069<br />
Akamai Technologies, Inc.* 58,839 3,425<br />
Autodesk, Inc.* 74,740 3,676<br />
CA, Inc. 106,515 3,299<br />
Cerner Corp.* 97,349 5,476<br />
Citrix Systems, Inc.* 60,196 3,457<br />
Dun & Bradstreet (The) Corp. 12,319 1,224<br />
Electronic Arts, Inc.* 101,270 2,938<br />
Fidelity National Information Services, Inc. 95,435 5,101<br />
Fiserv, Inc.* 83,674 4,744<br />
Intuit, Inc. 93,333 7,255<br />
Microsoft Corp. 2,486,203 101,909<br />
Oracle Corp. 1,139,757 46,627<br />
Paychex, Inc. 106,247 4,526<br />
Red Hat, Inc.* 62,519 3,312<br />
Salesforce.com, Inc.* 184,713 10,545<br />
217,583<br />
Telecommunications - 3.4%<br />
AT&T, Inc. 1,713,825 60,104<br />
CenturyLink, Inc. 190,205 6,246<br />
Cisco Systems, Inc. 1,695,414 37,994<br />
See Notes to the Financial Statements.<br />
NORTHERN FUNDS ANNUAL REPORT 113 EQUITY INDEX FUNDS
SCHEDULE OF INVESTMENTS<br />
STOCK INDEX FUND continued<br />
NUMBER<br />
OF SHARES<br />
COMMON STOCKS - 97.5% continued<br />
Telecommunications - 3.4% continued<br />
VALUE<br />
(000S)<br />
Corning, Inc. 458,145 $9,539<br />
Frontier Communications Corp. 326,195 1,859<br />
Harris Corp. 35,328 2,585<br />
Juniper Networks, Inc.* 164,994 4,250<br />
Motorola Solutions, Inc. 74,326 4,778<br />
Verizon Communications, Inc. 1,363,000 64,838<br />
Windstream Holdings, Inc. 196,215 1,617<br />
193,810<br />
Textiles - 0.0%<br />
Mohawk Industries, Inc.* 20,011 2,721<br />
Toys, Games & Hobbies - 0.1%<br />
Hasbro, Inc. 38,130 2,121<br />
Mattel, Inc. 112,200 4,500<br />
6,621<br />
Transportation - 1.6%<br />
C.H. Robinson Worldwide, Inc. 48,764 2,555<br />
CSX Corp. 330,815 9,584<br />
Expeditors International of<br />
Washington, Inc. 67,029 2,656<br />
FedEx Corp. 91,431 12,120<br />
Kansas City Southern 36,479 3,723<br />
Norfolk Southern Corp. 101,942 9,906<br />
Ryder System, Inc. 17,687 1,413<br />
Union Pacific Corp. 149,791 28,110<br />
United Parcel Service, Inc., Class B 233,864 22,774<br />
92,841<br />
Total Common Stocks<br />
(Cost $3,404,535) 5,496,557<br />
(1)<br />
(2)<br />
(3)<br />
(4)<br />
(5)<br />
*<br />
PRINCIPAL<br />
AMOUNT<br />
(000S)<br />
VALUE<br />
(000S)<br />
SHORT-TERM INVESTMENTS - 0.2%<br />
U.S. Treasury Bill,<br />
0.05%, 4/10/14 (5) $10,505 $10,505<br />
Total Short-Term Investments<br />
(Cost $10,505) 10,505<br />
Total Investments - 99.9%<br />
(Cost $3,535,885) 5,627,907<br />
Other Assets less Liabilities - 0.1% 8,078<br />
NET ASSETS - 100.0% $5,635,985<br />
At March 31, 2013, the value of the Fund’s investment in <strong>Northern</strong> Trust Corp.<br />
was approximately $3,881,000. There were no purchases and sales during<br />
the fiscal year ended March 31, 2014. The change in net unrealized<br />
appreciation during the fiscal year ended March 31, 2014, was approximately<br />
$783,000.<br />
Investment in affiliate.<br />
Investment in affiliated Portfolio. <strong>Northern</strong> Trust Investments, Inc. is the<br />
investment adviser to the Fund and the investment adviser to the <strong>Northern</strong><br />
Institutional <strong>Funds</strong>.<br />
At March 31, 2013, the value of the Fund’s investment in the Diversified Assets<br />
Portfolio of the <strong>Northern</strong> Institutional <strong>Funds</strong> was approximately $72,982,000<br />
with net purchases of approximately $47,863,000 during the fiscal year<br />
ended March 31, 2014.<br />
Security pledged as collateral to cover margin requirements for open futures<br />
contracts.<br />
Non-Income Producing Security<br />
Percentages shown are based on Net Assets. The classifications shown on the<br />
Schedule of Investments and in the tables herein are unaudited.<br />
At March 31, 2014, the Fund had open futures contracts as follows:<br />
TYPE<br />
NUMBER OF<br />
CONTRACTS<br />
NOTIONAL<br />
AMOUNT<br />
(000S)<br />
CONTRACT<br />
POSITION<br />
CONTRACT<br />
EXP.<br />
UNREALIZED<br />
GAINS (LOSSES)<br />
(000S)<br />
E-Mini<br />
S&P 500 1,488 $138,726 Long 6/14 $1,129<br />
INVESTMENT COMPANIES - 2.2%<br />
<strong>Northern</strong> Institutional <strong>Funds</strong> -<br />
Diversified Assets Portfolio, 0.01% (3) (4) 120,845,320 120,845<br />
Total Investment Companies<br />
(Cost $120,845) 120,845<br />
See Notes to the Financial Statements.<br />
EQUITY INDEX FUNDS 114 NORTHERN FUNDS ANNUAL REPORT
MARCH 31, 2014<br />
At March 31, 2014, the industry sectors (unaudited) for the Fund were :<br />
% OF LONG-TERM<br />
INDUSTRY SECTOR<br />
INVESTMENTS<br />
Consumer Discretionary 12.1%<br />
Consumer Staples 9.6<br />
Energy 10.2<br />
Financials 16.4<br />
Health Care 13.4<br />
Industrials 10.6<br />
Information Technology 18.6<br />
Materials 3.5<br />
Telecommunication Services 2.5<br />
Utilities 3.1<br />
Total 100.0%<br />
Various inputs are used in determining the value of the Fund’s investments.<br />
These inputs are summarized in three levels listed below:<br />
Level 1 - Unadjusted quoted market prices in active markets for identical<br />
securities on the measurement date.<br />
Level 2 - Other observable inputs (e.g., quoted prices in active markets for<br />
similar securities, securities valuations based on commonly quoted benchmark<br />
interest rates and yield curves, maturities, ratings and/or securities indices).<br />
Level 3 - Significant unobservable inputs (e.g., information about assumptions,<br />
including risk, market participants would use in pricing a security).<br />
The inputs or methodologies used for valuing securities are not necessarily an<br />
indication of the risk associated with investing in those securities and other<br />
financial instruments, if any. The following table summarizes the valuation of the<br />
Fund’s investments by the above fair value hierarchy as of March 31, 2014:<br />
INVESTMENTS<br />
LEVEL 1<br />
(000S)<br />
LEVEL 2<br />
(000S)<br />
LEVEL 3<br />
(000S)<br />
TOTAL<br />
(000S)<br />
Common Stocks $5,496,557 (1) $ — $ — $5,496,557<br />
Investment Companies 120,845 — — 120,845<br />
Short-Term Investments — 10,505 — 10,505<br />
Total Investments $5,617,402 $10,505 $ — $5,627,907<br />
OTHER FINANCIAL<br />
INSTRUMENTS<br />
Assets<br />
Futures Contracts $ 1,129 $ — $ — $ 1,129<br />
(1)<br />
Classifications as defined in the Schedule of Investments.<br />
The Fund discloses all transfers between levels based on valuations at the end of<br />
each reporting period.<br />
AtMarch31,2014,therewerenotransfersbetweenLevel1,Level2orLevel3<br />
classifications based on levels assigned to the securities on March 31, 2013.<br />
See Notes to the Financial Statements.<br />
NORTHERN FUNDS ANNUAL REPORT 115 EQUITY INDEX FUNDS
EQUITY INDEX FUNDS<br />
NOTES TO THE FINANCIAL STATEMENTS<br />
1. ORGANIZATION<br />
<strong>Northern</strong> <strong>Funds</strong> (the “Trust”) is a Delaware statutory trust and is<br />
registered under the Investment Company Act of 1940, as<br />
amended (the “1940 Act”), as an open-end management investment<br />
company. The Trust offers 48 funds as of March 31, 2014,<br />
each with its own investment objective (e.g., long-term capital<br />
appreciation, total return or income consistent with preservation<br />
of capital). The Emerging Markets <strong>Equity</strong> <strong>Index</strong>, Global Real<br />
Estate <strong>Index</strong>, Global Sustainability <strong>Index</strong>, International <strong>Equity</strong><br />
<strong>Index</strong>, Mid Cap <strong>Index</strong>, Small Cap <strong>Index</strong>, and Stock <strong>Index</strong> <strong>Funds</strong><br />
(each a “Fund” and collectively, the “<strong>Funds</strong>”) are separate,<br />
diversified investment portfolios of the Trust. Each of the <strong>Funds</strong><br />
is presented herein.<br />
<strong>Northern</strong> Trust Investments, Inc. (“NTI”), a subsidiary of The<br />
<strong>Northern</strong> Trust Company (“<strong>Northern</strong> Trust”), serves as the<br />
investment adviser for the <strong>Funds</strong>. <strong>Northern</strong> Trust serves as the<br />
custodian and transfer agent for the Trust. NTI serves as the<br />
Trust’s administrator. <strong>Northern</strong> <strong>Funds</strong> Distributors, LLC is the<br />
Trust’s distributor.<br />
2. SIGNIFICANT ACCOUNTING POLICIES<br />
The following is a summary of significant accounting policies<br />
consistently followed by the <strong>Funds</strong> in the preparation of their<br />
financial statements. These policies are in conformity with<br />
accounting principles generally accepted in the United States of<br />
America (“U.S.”), or “U.S. GAAP.” The preparation of financial<br />
statements in conformity with U.S. GAAP requires management<br />
to make estimates and assumptions that affect the reported<br />
amounts of assets and liabilities and disclosure of contingent<br />
assets and liabilities at the date of the financial statements and the<br />
reported amounts of revenues and expenses during the reporting<br />
period. Actual results may differ from those estimates.<br />
The net asset value (“NAV”) of each Fund is determined daily as<br />
of the close of regular trading on the New York Stock Exchange<br />
(“NYSE”), generally 3:00 P.M. Central Time, on each day the<br />
NYSE is open for trading.<br />
A) VALUATION OF SECURITIES AND DERIVATIVE CONTRACTS<br />
Securities are valued at their fair value. Securities traded on U.S.<br />
securities exchanges or in the NASDAQ National Market System<br />
are principally valued at the regular trading session closing price<br />
(generally, 3:00 P.M. Central Time) on the exchange or market in<br />
which such securities are principally traded. If any such security<br />
is not traded on a valuation date, it is valued at the most recent<br />
quoted bid price. Over-the-counter securities not reported in the<br />
NASDAQ National Market System are also generally valued at<br />
the most recent quoted bid price. Fixed income securities, however,<br />
may be valued on the basis of evaluated prices provided by<br />
independent pricing services when such prices are believed to<br />
reflect the fair value of such securities or broker-provided prices.<br />
Such prices may be determined by taking into account other<br />
similar securities’ prices, yields, maturities, call features, ratings,<br />
institutional size trading in similar groups of securities and<br />
developments related to specific securities.<br />
The values of securities of foreign issuers are generally based<br />
upon market quotations which, depending upon local<br />
convention or regulation, may be the last sale price, the last bid<br />
price or the mean between the last bid and asked price as of, in<br />
each case, the close of the appropriate exchange or other designated<br />
time. Foreign fixed income securities, however, may, like<br />
domestic fixed income securities, be valued based on evaluated<br />
prices provided by independent pricing services when such prices<br />
are believed to reflect the fair value of such securities.<br />
Shares of open-end investment companies are valued at their<br />
NAV. Spot and forward foreign currency exchange contracts are<br />
generally valued using an independent pricing service. Exchangetraded<br />
financial futures and options are valued at the settlement<br />
price as established by the exchange on which they are traded.<br />
The foregoing prices may be obtained from one or more<br />
independent pricing services or, as needed or applicable,<br />
independent broker-dealers. Short-term investments with a<br />
maturity of 60 days or less are valued at their amortized cost,<br />
which NTI, as authorized by the Board of Trustees (the “Board”),<br />
has determined approximates fair value.<br />
Any securities for which market quotations are not readily available<br />
or are believed to be incorrect are valued at fair value as<br />
determined in good faith by NTI under the supervision of the<br />
Board. The Trust, in its discretion, may make adjustments to the<br />
prices of securities held by a Fund if an event occurs after the<br />
publication of fair values normally used by the Fund but before<br />
the time as of which the Fund calculates its NAV, depending on<br />
the nature and significance of the event, consistent with applicable<br />
regulatory guidance and U.S. GAAP. This may occur<br />
particularly with respect to certain foreign securities held by a<br />
Fund, in which case the Trust may use adjustment factors<br />
obtained from an independent evaluation service that are<br />
intended to reflect more accurately the fair value of those securities<br />
as of the time the Fund’s NAV is calculated.<br />
<strong>Northern</strong> Trust’s Pricing Unit (the “NT Pricing Unit”) is responsible<br />
for supplying a value for each portfolio security used in the<br />
NAV computations. Securities or other assets for which market<br />
quotations are not readily available or for which market quotations<br />
do not represent the value at the time of pricing are fair<br />
valued in accordance with policies and procedures established by,<br />
and subject to oversight of, the <strong>Funds</strong>’ Board. NTI has established<br />
a pricing and valuation committee (the “Asset Management<br />
PVC”, formerly NTGI PVC) whose membership includes<br />
EQUITY INDEX FUNDS 116 NORTHERN FUNDS ANNUAL REPORT
EQUITY INDEX FUNDS<br />
MARCH 31, 2014<br />
representatives of NTI, as well as independent control personnel<br />
from <strong>Northern</strong> Trust’s Legal and Fund Administration and NTI’s<br />
Compliance and Risk Management groups. The Asset Management<br />
PVC is responsible for the fair valuation of portfolio<br />
securities and the monitoring of the fair valuation process, subject<br />
to the Board’s oversight.<br />
The Asset Management PVC is responsible for making the determination<br />
of the fair value of a security. In making its determination,<br />
the Asset Management PVC considers factors that it<br />
deems appropriate to the determination of the fair value of the<br />
security. Such factors include, but are not limited to, the type of<br />
security; the current financial position of the issuer; the cost of<br />
the investment; information as to any transactions or offers with<br />
respect to a security; market value of a similar freely-traded security;<br />
and news events. NTI will continue to monitor markets and<br />
the issuer’s circumstances that affect a security’s valuation to<br />
determine the continued appropriateness of a security’s fair<br />
valuation. The Asset Management PVC will review if the markets<br />
and issuer’s circumstances relevant to the valuation of a fair valued<br />
security change materially.<br />
For each Level 3 security, if any, that has been fair valued pursuant<br />
to the policies adopted by the Board, the fair value price is<br />
compared against the last available and next available market<br />
quotations. The results of such back testing and fair valued securities<br />
are reported quarterly to the Valuation Committee of the<br />
Board.<br />
The use of fair valuation involves the risk that the values used by<br />
the <strong>Funds</strong> to price their investments may be higher or lower than<br />
the values used by other unaffiliated investment companies and<br />
investors to price the same investments.<br />
B) FUTURES CONTRACTS Certain <strong>Funds</strong> invest in long or short<br />
futures contracts for hedging purposes, to increase total return<br />
(i.e., for speculative purposes) or to maintain liquidity. When<br />
used as a hedge, a Fund may sell a futures contract in order to<br />
offset a decrease in the fair value of its portfolio securities that<br />
might otherwise result from a market decline. A Fund may do so<br />
either to hedge the value of its portfolio securities as a whole, or<br />
to protect against declines occurring prior to sales of securities<br />
in the value of the securities to be sold. Conversely, a Fund may<br />
purchase a futures contract as a hedge in anticipation of<br />
purchases of securities. In addition, a Fund may utilize futures<br />
contracts in anticipation of changes in the composition of its<br />
portfolio holdings. A Fund bears the market risk arising from<br />
changes in the value of these financial instruments. At the time a<br />
Fund enters into a futures contract, it is generally required to<br />
make a margin deposit with the custodian of a specified amount<br />
of liquid assets. Futures are marked to market each day with the<br />
change in value reflected in the unrealized gains or losses. Risk<br />
may arise as a result of the potential inability of the counterparties<br />
to meet the terms of their contracts. Credit risk is<br />
mitigated to the extent that the exchange on which a particular<br />
futures contract is traded assumes the risk of a counterparty<br />
defaulting on its obligations under the contract. The Statements<br />
of Operations include any realized gains or losses, on closed<br />
futures contracts in Net realized gains (losses) on futures contracts,<br />
and any unrealized gains or losses on open futures<br />
contracts, in Net change in unrealized appreciation<br />
(depreciation) on futures contracts.<br />
At March 31, 2014, the Mid Cap <strong>Index</strong>, Small Cap <strong>Index</strong>, and<br />
Stock <strong>Index</strong> <strong>Funds</strong> had entered into exchange-traded long<br />
futures contracts. The aggregate fair value of securities pledged to<br />
cover margin requirements for open positions was approximately<br />
$2,455,000, $1,655,000 and $10,505,000, respectively. The<br />
Emerging Markets <strong>Equity</strong> <strong>Index</strong>, Global Real Estate <strong>Index</strong>, Global<br />
Sustainability <strong>Index</strong> and International <strong>Equity</strong> <strong>Index</strong> <strong>Funds</strong> had<br />
entered into exchange-traded long futures contracts at<br />
March 31, 2014. The aggregate fair value of cash and foreign<br />
currencies to cover margin requirements for open positions was<br />
approximately $1,544,000, $930,000, $243,000, and $5,097,000,<br />
respectively. Further information on the impact of these positions<br />
on the <strong>Funds</strong>’ financial statements can be found in Note 9.<br />
C) FOREIGN CURRENCY TRANSLATION Values of investments<br />
denominated in foreign currencies are converted into U.S. dollars<br />
using the spot rates on the NYSE, generally at 3:00 P.M. Central<br />
Time. The cost of purchases and proceeds from sales of investments,<br />
interest and dividend income are translated into U.S. dollars<br />
using the spot rates on the NYSE, generally at 3:00 P.M.<br />
Central Time. The gains or losses, if any, on investments resulting<br />
from changes in foreign exchange rates are included in the Statements<br />
of Operations in Net realized gains (losses) on investments<br />
and Net change in unrealized appreciation (depreciation) on<br />
investments. The gains or losses, if any, on translation of other<br />
assets and liabilities denominated in foreign currencies are<br />
included in Net realized gains (losses) on foreign currency transactions<br />
and Net change in unrealized appreciation (depreciation)<br />
on foreign currency translations in the Statements of Operations.<br />
D) FORWARD FOREIGN CURRENCY EXCHANGE CONTRACTS<br />
Certain <strong>Funds</strong> are authorized to enter into forward foreign currency<br />
exchange contracts for the purchase or sale of a specific<br />
foreign currency at a fixed price on a future date as a hedge<br />
against either specific transactions or portfolio positions, or as a<br />
cross-hedge transaction or for speculative purposes. The<br />
objective of a Fund’s foreign currency hedging transactions is to<br />
reduce the risk that the U.S. dollar value of a Fund’s foreign currency<br />
denominated securities will decline in value due to changes<br />
in foreign currency exchange rates. All forward foreign currency<br />
exchange contracts are “marked-to-market” daily at the applicable<br />
exchange rates. Any resulting unrealized gains or losses are<br />
NORTHERN FUNDS ANNUAL REPORT 117 EQUITY INDEX FUNDS
EQUITY INDEX FUNDS<br />
NOTES TO THE FINANCIAL STATEMENTS continued<br />
recorded in Net change in unrealized appreciation (depreciation)<br />
on foreign currency translations in the Statements of Operations.<br />
A Fund records realized gains or losses at the time the forward<br />
foreign currency exchange contract is offset by entering into a<br />
closing transaction with the same counterparty or is extinguished<br />
by delivery of the currency. Realized gains or losses, if any, are<br />
included in Net realized gains (losses) on foreign currency transactions<br />
in the Statements of Operations.<br />
Risks may arise upon entering into these contracts from the<br />
potential inability of counterparties to meet the terms of their<br />
contracts and from unanticipated movements in the value of a<br />
foreign currency relative to the U.S. dollar. The contractual<br />
amounts of forward foreign currency exchange contracts do not<br />
necessarily represent the amounts potentially subject to risk. The<br />
measurement of the risks associated with these instruments is<br />
meaningful only when all related and offsetting transactions are<br />
considered. The <strong>Funds</strong> bear the market risk from changes in<br />
forward foreign currency exchange rates and the credit risk if the<br />
counterparty to the contract fails to perform. Further<br />
information on the impact of these positions on the <strong>Funds</strong>’<br />
financial statements can be found in Note 9.<br />
E) INVESTMENT TRANSACTIONS AND INCOME Investment transactions<br />
are recorded as of the trade date. The <strong>Funds</strong> determine<br />
the gain or loss realized from investment transactions by using an<br />
identified cost basis method. Interest income is recognized on an<br />
accrual basis and includes amortization of premiums and accretion<br />
of discounts using the effective yield method. The interest<br />
rates reflected in the Schedules of Investments represent either<br />
the stated coupon rate, annualized yield on date of purchase for<br />
discount notes, the current reset rate for floating rate securities,<br />
the 7-day yield for money market funds or, for interest-only or<br />
principal-only securities, the current effective yield. Cost of<br />
investments includes amortization of premiums and accretion of<br />
discounts, if any. Dividend income is recognized on the<br />
ex-dividend date. Dividends from foreign securities are recorded<br />
on the ex-dividend date, or as soon as the information is available.<br />
Distributions received from a Fund’s investments in real<br />
estate investment trusts (“REITs”) are comprised of return of<br />
capital, capital gains and income. The actual character of the<br />
amounts received during the year is not known until the fiscal<br />
year end. A Fund records the character of distributions received<br />
from the REITs during the year based on estimates available. A<br />
Fund’s characterization may be subsequently revised based on<br />
information received from the REITs after their tax reporting<br />
periods conclude.<br />
F) EXPENSES Each Fund is charged for those expenses that are<br />
directly attributable to that Fund. Expenses incurred which do<br />
not specifically relate to an individual Fund are allocated among<br />
all <strong>Funds</strong> in the Trust in proportion to each Fund’s relative<br />
net assets.<br />
G) REDEMPTION FEES The Emerging Markets <strong>Equity</strong> <strong>Index</strong>,<br />
Global Real Estate <strong>Index</strong>, Global Sustainability <strong>Index</strong>, and International<br />
<strong>Equity</strong> <strong>Index</strong> <strong>Funds</strong> charge a 2 percent redemption fee<br />
on the redemption of shares (including by exchange) held for<br />
30 days or less. For the purpose of applying the fee, the <strong>Funds</strong> use<br />
a first-in, first-out (“FIFO”) method so that shares held longest<br />
are treated as being redeemed first and shares held shortest are<br />
treated as being redeemed last. The redemption fee is paid to the<br />
<strong>Funds</strong> and is intended to offset the trading, market impact and<br />
other costs associated with short-term money movements in and<br />
out of the <strong>Funds</strong>. The redemption fee may be collected by<br />
deduction from the redemption proceeds or, if assessed after the<br />
redemption transaction, through a separate billing. The<br />
redemption fee does not apply to certain types of redemptions as<br />
described in the <strong>Funds</strong>’ prospectus.<br />
Redemption fees for the fiscal year ended March 31, 2014, were<br />
approximately $2,000, $2,000 and $1,000 for the Emerging<br />
Markets <strong>Equity</strong> <strong>Index</strong>, the Global Real Estate <strong>Index</strong> and the<br />
Global Sustainability <strong>Index</strong> <strong>Funds</strong>, respectively. Redemption fees<br />
for the fiscal year ended March 31, 2014, were less than $500 for<br />
the International <strong>Equity</strong> <strong>Index</strong> Fund. Redemption fees for the<br />
fiscal year ended March 31, 2013, were $10,000 and $2,000 for<br />
the Emerging Markets <strong>Equity</strong> <strong>Index</strong> and the Global Real Estate<br />
<strong>Index</strong> <strong>Funds</strong>, respectively. Redemption fees for the fiscal year<br />
ended March 31, 2013, were less than $500 for the Global<br />
Sustainability <strong>Index</strong> and the International <strong>Equity</strong> <strong>Index</strong> <strong>Funds</strong>.<br />
These amounts are included in Payments for Shares Redeemed in<br />
Note 8 — Capital Share Transactions. The impact from<br />
redemption fees paid to the <strong>Funds</strong> was less than $0.001 per share.<br />
H) DISTRIBUTIONS TO SHAREHOLDERS Distributions of dividends<br />
from net investment income, if any, are declared and paid as<br />
follows:<br />
Emerging Markets <strong>Equity</strong> <strong>Index</strong><br />
Global Real Estate <strong>Index</strong><br />
Global Sustainability <strong>Index</strong><br />
International <strong>Equity</strong> <strong>Index</strong><br />
Mid Cap <strong>Index</strong><br />
Small Cap <strong>Index</strong><br />
Stock <strong>Index</strong><br />
DECLARATION AND<br />
PAYMENT FREQUENCY<br />
<strong>Annual</strong>ly<br />
Quarterly<br />
<strong>Annual</strong>ly<br />
<strong>Annual</strong>ly<br />
<strong>Annual</strong>ly<br />
<strong>Annual</strong>ly<br />
Quarterly<br />
Distributions of net realized capital gains, if any, are declared and<br />
paid at least annually. Distributions to shareholders are recorded<br />
on the ex-dividend date.<br />
Income dividends and capital gains distributions are determined<br />
in accordance with federal income tax regulations. Such amounts<br />
EQUITY INDEX FUNDS 118 NORTHERN FUNDS ANNUAL REPORT
EQUITY INDEX FUNDS<br />
MARCH 31, 2014<br />
may differ from income and capital gains recorded in accordance<br />
with U.S. GAAP. Accordingly, the <strong>Funds</strong> may periodically make<br />
reclassifications among certain of their capital accounts to reflect<br />
differences between financial reporting and federal income tax<br />
basis distributions. These reclassifications are reported in order<br />
to reflect the tax treatment for certain permanent differences that<br />
exist between income tax regulations and U.S. GAAP. These<br />
reclassifications may relate to net operating losses, Section 988<br />
currency gains and losses, Passive Foreign Investment Companies<br />
(“PFICs’’) gains and losses, recharacterization of dividends<br />
received from investments in REITs, expired capital loss<br />
carryforwards, and gain or loss on in-kind transactions. These<br />
reclassifications have no impact on the total net assets or the net<br />
asset values per share of the <strong>Funds</strong>. At March 31, 2014, the<br />
following reclassifications were recorded:<br />
Amounts in thousands<br />
ACCUMULATED<br />
UNDISTRIBUTED<br />
NET INVESTMENT<br />
INCOME (LOSS)<br />
ACCUMULATED<br />
UNDISTRIBUTED<br />
NET REALIZED<br />
GAIN (LOSS)<br />
CAPITAL<br />
STOCK<br />
Emerging Markets <strong>Equity</strong><br />
<strong>Index</strong> $(1,214) $1,214 $ —<br />
Global Real Estate <strong>Index</strong> 259 (259) —<br />
Global Sustainability <strong>Index</strong> (16) 16 —<br />
International <strong>Equity</strong> <strong>Index</strong> (716) (11,564) 12,280<br />
Mid Cap <strong>Index</strong> (741) 741 —<br />
Small Cap <strong>Index</strong> (238) (9,463) 9,701<br />
Stock <strong>Index</strong> (978) (19,766) 20,744<br />
I) FEDERAL INCOME TAXES No provision for federal income taxes<br />
has been made since each Fund’s policy is to comply with the<br />
requirements of Subchapter M of the Internal Revenue Code of<br />
1986, as amended, applicable to regulated investment companies<br />
and to distribute, each year, substantially all of its taxable income<br />
and capital gains to its shareholders.<br />
For the period subsequent to October 31, 2013, through the fiscal<br />
year ended March 31, 2014, the following <strong>Funds</strong> incurred net<br />
capital losses and/or Section 988 net currency losses which the<br />
<strong>Funds</strong> intend to treat as having been incurred in the following<br />
fiscal year:<br />
Amounts in thousands<br />
Emerging Markets <strong>Equity</strong> <strong>Index</strong> $68,892<br />
International <strong>Equity</strong> <strong>Index</strong> $610<br />
The Regulated Investment Company Modernization Act of 2010<br />
(the “Act”) eliminated the eight-year limit on the use of capital<br />
loss carryforwards that arise in taxable years beginning after its<br />
enactment date of December 22, 2010. The changes became<br />
effective for the <strong>Funds</strong> for the fiscal year ended March 31, 2012.<br />
Consequently, capital losses incurred by the <strong>Funds</strong> in taxable<br />
years beginning with the taxable year ended March 31, 2012 can<br />
be carried forward for an unlimited period. However, capital<br />
losses incurred by the <strong>Funds</strong> in taxable years beginning before<br />
the taxable year ended March 31, 2012 with an expiration date<br />
may not be used to offset capital gains until all net capital losses<br />
incurred in taxable years beginning with the taxable year ended<br />
March 31, 2012 without an expiration date have been utilized. As<br />
a result, pre-enactment capital loss carryforwards may be more<br />
likely to expire unused. Additionally, post-enactment capital loss<br />
carryforwards will retain their character as either short-term or<br />
long-term capital losses instead of as short-term capital losses as<br />
under prior law. The <strong>Funds</strong>’ ability to utilize capital loss<br />
carryforwards in the future may be limited under the Internal<br />
Revenue Code and related regulations based on the results of<br />
future transactions.<br />
Capital losses incurred that will be carried forward under the<br />
provisions of the Act are as follows:<br />
Amounts in thousands<br />
SHORT-TERM<br />
CAPITAL LOSS<br />
CARRYFORWARD<br />
LONG-TERM<br />
CAPITAL LOSS<br />
CARRYFORWARD<br />
Emerging Markets <strong>Equity</strong> <strong>Index</strong> $2,967 $46,010<br />
International <strong>Equity</strong> <strong>Index</strong> — 56,856*<br />
* Amounts include acquired capital loss carryovers which may be<br />
limited under current tax laws.<br />
The <strong>Funds</strong> in the above table may offset future capital gains with<br />
these capital loss carryforwards.<br />
At March 31, 2014, the capital loss carryforwards for U.S. federal<br />
income tax purposes and their respective years of expiration for<br />
the <strong>Funds</strong> in the table below were as follows:<br />
Amounts in thousands<br />
MARCH 31,<br />
2017<br />
MARCH 31,<br />
2018<br />
MARCH 31,<br />
2019<br />
Emerging Markets <strong>Equity</strong> <strong>Index</strong> $12,794 $101,299 $4,624<br />
Global Sustainability <strong>Index</strong> — — 2,330<br />
International <strong>Equity</strong> <strong>Index</strong> 63,735* 194,512* 11,357*<br />
Stock <strong>Index</strong> 1,886* 3,047* —<br />
* Amounts include acquired capital loss carryovers which may be<br />
limited under current tax laws, expiring in varying amounts<br />
through March 31, 2019.<br />
The <strong>Funds</strong> in the above table may offset future capital gains with<br />
these capital loss carryforwards.<br />
The Global Real Estate <strong>Index</strong> Fund has elected to defer net capital<br />
losses and/or Section 988 net currency losses incurred from<br />
NORTHERN FUNDS ANNUAL REPORT 119 EQUITY INDEX FUNDS
EQUITY INDEX FUNDS<br />
NOTES TO THE FINANCIAL STATEMENTS continued<br />
November 1, 2013 through November 30, 2013, the Fund’s last tax<br />
year end, as having arisen on the first day of the following tax year:<br />
The tax character of distributions paid during the fiscal year<br />
ended March 31, 2014, was as follows:<br />
Amounts in thousands<br />
Global Real Estate <strong>Index</strong> $5,417<br />
Amounts in thousands<br />
DISTRIBUTIONS FROM<br />
ORDINARY<br />
INCOME*<br />
LONG-TERM<br />
CAPITAL GAINS<br />
At November 30, 2013, the Global Real Estate <strong>Index</strong> Fund’s last<br />
tax year end, there were no post enactment losses.<br />
At November 30, 2013, the Global Real Estate <strong>Index</strong> Fund’s last<br />
tax year end, the capital loss carryforwards for U.S. federal<br />
income tax purposes and their year of expiration for the Fund in<br />
the table below were as follows:<br />
Amounts in<br />
thousands<br />
NOVEMBER 30,<br />
2016<br />
NOVEMBER 30,<br />
2017<br />
NOVEMBER 30,<br />
2018<br />
NOVEMBER 30,<br />
2019<br />
Global Real<br />
Estate <strong>Index</strong> $97,667 $496,446 $10,164 $13,694<br />
The Fund in the above table may offset future capital gains with<br />
these capital loss carryforwards.<br />
At March 31, 2014, the tax components of undistributed net<br />
investment income, undistributed realized gains and unrealized<br />
gains were as follows:<br />
Amounts in thousands<br />
ORDINARY<br />
INCOME*<br />
UNDISTRIBUTED<br />
LONG-TERM<br />
CAPITAL GAINS<br />
UNREALIZED<br />
GAINS<br />
Emerging Markets <strong>Equity</strong><br />
<strong>Index</strong> $9,350 $ — $241,006<br />
Global Sustainability <strong>Index</strong> 1,754 — 46,409<br />
International <strong>Equity</strong> <strong>Index</strong> 59,018 — 658,572<br />
Mid Cap <strong>Index</strong> 6,812 21,335 362,780<br />
Small Cap <strong>Index</strong> 2,363 2,685 294,777<br />
Stock <strong>Index</strong> 13,664 17,096 1,968,268<br />
* Ordinary income includes taxable market discount income and<br />
short-term capital gains, if any.<br />
The tax components of undistributed net investment income,<br />
undistributed realized gains and unrealized losses at<br />
November 30, 2013, the Global Real Estate <strong>Index</strong> Fund’s last<br />
tax year end, were as follows:<br />
UNDISTRIBUTED<br />
ORDINARY LONG-TERM UNREALIZED<br />
Amounts in thousands<br />
INCOME* CAPITAL GAINS GAINS<br />
Global Real Estate <strong>Index</strong> $19,657 $ — $102,340<br />
* Ordinary income includes taxable market discount income and<br />
short-term capital gains, if any.<br />
Emerging Markets <strong>Equity</strong> <strong>Index</strong> $42,947 $ —<br />
Global Sustainability <strong>Index</strong> 2,889 —<br />
International <strong>Equity</strong> <strong>Index</strong> 83,000 —<br />
Mid Cap <strong>Index</strong> 18,854 29,575<br />
Small Cap <strong>Index</strong> 10,647 31,922<br />
Stock <strong>Index</strong> 101,707 17,304<br />
* Ordinary income includes taxable market discount income and<br />
short-term capital gains, if any.<br />
The tax character of distributions paid during the fiscal year<br />
ended March 31, 2013, was as follows:<br />
Amounts in thousands<br />
DISTRIBUTIONS FROM<br />
ORDINARY<br />
INCOME*<br />
LONG-TERM<br />
CAPITAL GAINS<br />
Emerging Markets <strong>Equity</strong> <strong>Index</strong> $44,000 $ —<br />
Global Sustainability <strong>Index</strong> 2,800 —<br />
International <strong>Equity</strong> <strong>Index</strong> 53,302 —<br />
Mid Cap <strong>Index</strong> 11,362 16,039<br />
Small Cap <strong>Index</strong> 9,996 4,381<br />
Stock <strong>Index</strong> 80,033 —<br />
* Ordinary income includes taxable market discount income and<br />
short-term capital gains, if any.<br />
The tax character of distributions paid during the Global Real<br />
Estate <strong>Index</strong> Fund’s tax years ended November 30, 2013 and<br />
November 30, 2012 was designated for the purpose of the dividends<br />
paid deductions as follows:<br />
Amount in thousands<br />
NOVEMBER 30, 2013 AND<br />
NOVEMBER 30, 2012<br />
DISTRIBUTIONS FROM<br />
ORDINARY<br />
INCOME*<br />
LONG-TERM<br />
CAPITAL GAINS<br />
Global Real Estate <strong>Index</strong> (2013) $44,614 $ —<br />
Global Real Estate <strong>Index</strong> (2012) 19,073 —<br />
* Ordinary income includes taxable market discount income and<br />
short-term capital gains, if any.<br />
The Global Real Estate <strong>Index</strong> Fund has a tax year end of<br />
November 30 th . Therefore, the tax character of distributions paid<br />
EQUITY INDEX FUNDS 120 NORTHERN FUNDS ANNUAL REPORT
EQUITY INDEX FUNDS<br />
MARCH 31, 2014<br />
for the period December 1, 2013 through March 31, 2014 will be<br />
determined at the end of its tax year.<br />
As of March 31, 2014, no Fund had uncertain tax positions that<br />
would require financial statement recognition or disclosure.<br />
The <strong>Funds</strong>’ federal tax returns, except for the Global Real Estate<br />
<strong>Index</strong> Fund, filed for the fiscal years ended March 31, 2011<br />
through March 31, 2013 remain subject to examination by the<br />
Internal Revenue Service. The Global Real Estate <strong>Index</strong> Fund’s<br />
federal tax returns filed for the tax years ended November 30, 2011<br />
through November 30, 2013 remain subject to examination by the<br />
Internal Revenue Service. Interest or penalties incurred, if any, on<br />
future unknown, uncertain tax positions taken by the <strong>Funds</strong> will<br />
be recorded as Interest expense on the Statements of Operations.<br />
J) OTHER RISKS Certain <strong>Funds</strong> may invest in emerging market<br />
securities. Additional risks are involved when a Fund invests its<br />
assets in countries with emerging economies or securities markets.<br />
These countries generally are located in the Asia and Pacific<br />
regions, the Middle East, Eastern Europe, Central America,<br />
South America and Africa. Political and economic structures in<br />
many of these countries may lack the social, political and<br />
economic stability characteristics of more developed countries.<br />
In general, the securities markets of these countries are less liquid,<br />
subject to greater price volatility and have smaller market<br />
capitalizations. As a result, the risks presented by investments in<br />
these countries are heightened.<br />
3. SERVICE PLAN<br />
The Trust has adopted a Service Plan pursuant to which the<br />
Trust may enter into agreements with <strong>Northern</strong> Trust, its<br />
affiliates or other institutions (“Service Organizations”) under<br />
which the Service Organizations agree to provide certain administrative<br />
support services and, in some cases, personal and<br />
account maintenance services for their customers, who are<br />
beneficial owners of shares of the <strong>Funds</strong>. As compensation for<br />
services provided pursuant to the Service Plan, the Service Organizations<br />
receive a fee at an annual rate of up to 0.25 percent of<br />
the average daily net assets of the <strong>Funds</strong> beneficially owned by<br />
their customers. There were no shareholder servicing fees paid to<br />
<strong>Northern</strong> Trust or its affiliates during the fiscal year ended<br />
March 31, 2014.<br />
These expenses are included in the Statements of Operations<br />
under Shareholder servicing fees for the fiscal year ended<br />
March 31, 2014.<br />
4. BANK BORROWINGS<br />
The Trust entered into a $150,000,000 senior unsecured revolving<br />
credit facility on November 29, 2012, which is administered<br />
by JPMorgan Chase Bank, N.A., for liquidity and other purposes<br />
(the “Credit Facility”). The interest rate charged under the Credit<br />
Facility is equal to the sum of (i) the Federal <strong>Funds</strong> Rate plus (ii)<br />
if the one month London Interbank Offered Rate (“LIBOR”) on<br />
the date of borrowing exceeds the Federal <strong>Funds</strong> Rate, the<br />
amount by which it so exceeds, plus (iii) 1.00 percent. In addition,<br />
there is an annual commitment fee of 0.08 percent on the<br />
unused portion of the credit line under the Credit Facility, payable<br />
quarterly in arrears which is included in Other expenses on<br />
the Statements of Operations.<br />
At a meeting held on November 22, 2013, the Board approved an<br />
agreement that terminated, replaced and restated the Credit<br />
Facility (as so terminated, replaced and restated, the “New Credit<br />
Facility”). The interest rate charged under the New Credit<br />
Facility is the same as it was for the Credit Facility. In addition,<br />
there is an annual commitment fee of 0.07 percent on the unused<br />
portion of the credit line under the New Credit Facility, payable<br />
quarterly in arrears. The New Credit Facility went into effect on<br />
November 25, 2013 and will expire on November 24, 2014,<br />
unless renewed.<br />
At March 31, 2014, the <strong>Funds</strong> did not have any outstanding<br />
loans.<br />
When utilized, the average dollar amounts of the borrowings and<br />
the weighted average interest rates for the fiscal year ended<br />
March 31, 2014 on these borrowings were:<br />
Amounts in thousands<br />
DOLLAR<br />
AMOUNT<br />
RATE<br />
Emerging Markets <strong>Equity</strong> <strong>Index</strong> $6,716 1.17%<br />
Global Real Estate <strong>Index</strong> 1,400 1.17%<br />
Global Sustainability <strong>Index</strong> 200 1.18%<br />
No other <strong>Funds</strong> incurred any interest expenses during the fiscal<br />
year ended March 31, 2014.<br />
5. INVESTMENT ADVISORY AND OTHER<br />
AGREEMENTS<br />
As compensation for advisory services and the assumption of<br />
related expenses, the investment adviser is entitled to receive an<br />
advisory fee, computed daily and payable monthly, at annual<br />
rates set forth in the table below (expressed as a percentage of<br />
each Fund’s respective average daily net assets). During the fiscal<br />
year ended March 31, 2014, the investment adviser contractually<br />
agreed to reimburse the <strong>Funds</strong> for certain expenses (other than<br />
acquired fund fees and expenses; a portion of the compensation<br />
paid to each Trustee who is not an officer, director or employee<br />
of <strong>Northern</strong> Trust Corporation or its subsidiaries; expenses<br />
related to third-party consultants engaged by the Board of the<br />
Trust; membership dues paid to the Investment Company<br />
NORTHERN FUNDS ANNUAL REPORT 121 EQUITY INDEX FUNDS
EQUITY INDEX FUNDS<br />
NOTES TO THE FINANCIAL STATEMENTS continued<br />
Institute and Mutual Fund Directors Forum; extraordinary<br />
expenses; and interest, if any) as shown on the accompanying<br />
Statements of Operations, to adhere to the expense limitations<br />
set forth below. The amount of the reimbursement is included in<br />
Less expenses reimbursed by investments adviser as a reduction<br />
to Total Expenses in the Statements of Operations.<br />
The annual advisory fees and the contractual expense limitations<br />
for the fiscal year ended March 31, 2014, for the <strong>Funds</strong> were as<br />
follows:<br />
CONTRACTUAL<br />
ANNUAL<br />
ADVISORY FEE<br />
EXPENSE<br />
LIMITATIONS<br />
Emerging Markets <strong>Equity</strong> <strong>Index</strong> 0.35% 0.30%<br />
Global Real Estate <strong>Index</strong> 0.35% 0.50%<br />
Global Sustainability <strong>Index</strong> 0.35% 0.30%<br />
International <strong>Equity</strong> <strong>Index</strong> 0.25% 0.25%<br />
Mid Cap <strong>Index</strong> 0.20% 0.15%<br />
Small Cap <strong>Index</strong> 0.20% 0.15%<br />
Stock <strong>Index</strong> 0.10% 0.10%<br />
The contractual reimbursement arrangements are expected to<br />
continue until at least July 31, 2014. The contractual reimbursement<br />
arrangements will continue automatically for periods of one<br />
year (each such one year period, a “Renewal Year”). The arrangement<br />
may be terminated, as to any succeeding Renewal Year, by<br />
NTI or a Fund upon 60 days’ written notice prior to the end of the<br />
current Renewal Year. The Board may terminate the contractual<br />
arrangements at any time with respect to a Fund if it determines<br />
that it is in the best interest of the Fund and its shareholders.<br />
As compensation for services rendered as transfer agent, including<br />
the assumption by <strong>Northern</strong> Trust of the expenses related<br />
thereto, <strong>Northern</strong> Trust receives a fee, computed daily and payable<br />
monthly, at an annual rate of 0.10 percent of the average<br />
daily net assets outstanding for each of the <strong>Funds</strong>. Transfer agent<br />
fees are reflected in the <strong>Funds</strong>’ Statements of Operations.<br />
For compensation as administrator, NTI is entitled to receive a<br />
fee, computed daily and payable monthly, at the annual rate of<br />
0.15 percent of each Fund’s average daily net assets. Administration<br />
fees are reflected in the <strong>Funds</strong>’ Statements of Operations.<br />
NTI also has a sub-administration agreement with <strong>Northern</strong> Trust,<br />
pursuant to which <strong>Northern</strong> Trust performs certain administrative<br />
services for the <strong>Funds</strong>. NTI pays <strong>Northern</strong> Trust for its subadministration<br />
services out of NTI’s administration fees.<br />
For compensation as custodian, <strong>Northern</strong> Trust receives an<br />
amount based on a pre-determined schedule of charges approved<br />
by the Board. The <strong>Funds</strong> have entered into an expense off-set<br />
arrangement with the custodian whereby credits realized as a result<br />
of uninvested cash balances are used to reduce a portion of the<br />
<strong>Funds</strong>’ custodian expenses. Custodian credits, if any, are reflected<br />
as Less custodian credits in the <strong>Funds</strong>’ Statements of Operations.<br />
<strong>Northern</strong> <strong>Funds</strong> Distributors, LLC, the distributor for the <strong>Funds</strong>,<br />
received no compensation from the <strong>Funds</strong> under its distribution<br />
agreement. However, it received compensation from NTI for its<br />
services as distributor pursuant to a separate letter agreement<br />
between it and NTI.<br />
Certain officers of the Trust are also officers of <strong>Northern</strong> Trust and<br />
NTI. All officers serve without compensation from the <strong>Funds</strong>. The<br />
Trust provides a deferred compensation plan for its Trustees who<br />
are not officers of <strong>Northern</strong> Trust or NTI. Prior to August 22,<br />
2013, under the deferred compensation plan, Trustees may have<br />
elected to defer all or a portion of their compensation. Effective<br />
August 22, 2013, the Trustees may no longer defer their<br />
compensation. Any amounts deferred and invested under the plan<br />
shall remain invested pursuant to the terms of the plan. Amounts<br />
deferred are included in Trustee fees on the Statements of Assets<br />
and Liabilities. Each Trustee’s account shall be deemed to be<br />
invested in shares of the Diversified Assets Portfolio of <strong>Northern</strong><br />
Institutional<strong>Funds</strong>and/ortheGlobalTacticalAssetAllocation<br />
Fund of the Trust and/or, at the discretion of the Trust, another<br />
money market fund selected by the Trust that complies with the<br />
provisions of Rule 2a-7 under the 1940 Act or one or more shortterm<br />
fixed-income instruments selected by the Trust that are<br />
“eligible securities” as defined by that rule. The net investment<br />
income, gains and losses achieved by such deemed investment shall<br />
be credited to the Trustee’s account as provided in the plan.<br />
6. RELATED PARTY TRANSACTIONS<br />
Pursuant to an exemptive order issued by the Securities and<br />
Exchange Commission (“SEC”), each Fund may invest its<br />
uninvested cash in a money market fund advised by the investment<br />
adviser or its affiliates. Accordingly, each Fund will bear<br />
indirectly a proportionate share of that money market fund’s<br />
operating expenses. These operating expenses include advisory,<br />
administration, transfer agency and custody fees that the money<br />
market fund pays to the investment adviser and/or its affiliates.<br />
The uninvested cash of each of the <strong>Funds</strong> currently is invested in<br />
the <strong>Northern</strong> Institutional Diversified Assets Portfolio. The<br />
aggregate annual rate of advisory, administration, transfer agency<br />
and custody fees payable to the investment adviser and/or its<br />
affiliates on any assets invested in the <strong>Northern</strong> Institutional<br />
Diversified Assets Portfolio is 0.35 percent of the average daily net<br />
assets. However, pursuant to the exemptive order, the investment<br />
adviser will reimburse each Fund for advisory fees otherwise payable<br />
by the Fund on any assets invested in the <strong>Northern</strong> Institutional<br />
Diversified Assets Portfolio. This reimbursement is included<br />
EQUITY INDEX FUNDS 122 NORTHERN FUNDS ANNUAL REPORT
EQUITY INDEX FUNDS<br />
MARCH 31, 2014<br />
in Less expenses reimbursed by investment adviser as a reduction<br />
to Total Expenses on the Statements of Operations. This<br />
reimbursement’s impact on each Fund’s net expenses and net<br />
investment income ratios is included in each Fund’s Financial<br />
Highlights. The exemptive order requires the <strong>Funds</strong>’ Board to<br />
determine before a vote on the Advisory Agreement that the advisory<br />
fees incurred in connection with the investment of uninvested<br />
cash in affiliated money market funds are not for<br />
duplicative services.<br />
7. INVESTMENT TRANSACTIONS<br />
For the fiscal year ended March 31, 2014, the aggregate costs of<br />
purchases and proceeds from sales of securities (excluding<br />
short-term investments) for the <strong>Funds</strong> were as follows:<br />
PURCHASES<br />
SALES<br />
Amounts in thousands U.S. GOVERNMENT OTHER U.S. GOVERNMENT OTHER<br />
Emerging Markets<br />
<strong>Equity</strong> <strong>Index</strong> $ — $ 667,801 $ — $ 787,503<br />
Global Real Estate<br />
<strong>Index</strong> — 225,442 — 123,625<br />
Global<br />
Sustainability<br />
<strong>Index</strong> — 39,799 — 18,259<br />
International <strong>Equity</strong><br />
<strong>Index</strong> — 3,074,572 — 1,374,446<br />
Mid Cap <strong>Index</strong> — 279,081 — 143,180<br />
Small Cap <strong>Index</strong> — 172,894 — 133,387<br />
Stock <strong>Index</strong> — 417,753 — 564,252<br />
The difference between book basis and tax basis net unrealized<br />
appreciation (depreciation) is attributable primarily to the tax<br />
deferral of losses on wash sales, the realization for tax purposes<br />
of unrealized gains on certain foreign currency contracts, the<br />
deferral of post-October currency and capital losses for tax<br />
purposes and the timing of income recognition on investments<br />
in REITs and PFICs.<br />
At March 31, 2014, for federal income tax purposes, gross unrealized<br />
appreciation, gross unrealized depreciation, net unrealized<br />
appreciation (depreciation) on investments (including the<br />
effects of foreign currency translation) and the cost basis of<br />
securities were as follows:<br />
Amounts in<br />
thousands<br />
UNREALIZED<br />
APPRECIATION<br />
UNREALIZED<br />
DEPRECIATION<br />
NET<br />
APPRECIATION<br />
(DEPRECIATION)<br />
COST<br />
BASIS OF<br />
SECURITIES<br />
Emerging<br />
Markets <strong>Equity</strong><br />
<strong>Index</strong> $ 411,317 $(170,780) $ 240,537 $1,675,792<br />
Global Real<br />
Estate <strong>Index</strong> 189,259 (52,998) 136,261 1,238,351<br />
Global<br />
Sustainability<br />
<strong>Index</strong> 48,679 (2,358) 46,321 129,605<br />
International<br />
<strong>Equity</strong> <strong>Index</strong> 790,327 (132,354) 657,973 3,898,648<br />
Mid Cap <strong>Index</strong> 378,237 (15,457) 362,780 952,647<br />
Small Cap <strong>Index</strong> 332,589 (37,812) 294,777 695,752<br />
Stock <strong>Index</strong> 1,999,712 (31,443) 1,968,269 3,659,638<br />
8. CAPITAL SHARE TRANSACTIONS<br />
Transactions in capital shares for the fiscal year ended March 31, 2014, were as follows:<br />
Amounts in thousands<br />
SHARES<br />
SOLD<br />
PROCEEDS<br />
FROM<br />
SHARES SOLD<br />
SHARES FROM<br />
REINVESTED<br />
DIVIDENDS<br />
REINVESTMENT<br />
OF<br />
DIVIDENDS<br />
SHARES<br />
REDEEMED<br />
PAYMENTS<br />
FOR SHARES<br />
REDEEMED<br />
NET<br />
INCREASE/<br />
(DECREASE)<br />
IN SHARES<br />
NET<br />
INCREASE/<br />
(DECREASE)<br />
IN NET ASSETS<br />
Emerging Markets <strong>Equity</strong> <strong>Index</strong> 59,509 $ 657,823 345 $ 3,823 (71,509) $ (780,267) (11,655) $ (118,621)<br />
Global Real Estate <strong>Index</strong> 52,043 488,864 673 6,015 (44,023) (412,238) 8,693 82,641<br />
Global Sustainability <strong>Index</strong> 2,998 33,803 62 703 (1,301) (14,336) 1,759 20,170<br />
International <strong>Equity</strong> <strong>Index</strong> 177,506 2,099,110 920 10,975 (35,607) (421,601) 142,819 1,688,484<br />
Mid Cap <strong>Index</strong> 18,974 305,069 2,184 35,823 (11,018) (179,207) 10,140 161,685<br />
Small Cap <strong>Index</strong> 21,226 245,635 2,856 33,781 (17,744) (206,447) 6,338 72,969<br />
Stock <strong>Index</strong> 59,157 1,263,937 1,542 33,726 (65,562) (1,405,809) (4,863) (108,146)<br />
NORTHERN FUNDS ANNUAL REPORT 123 EQUITY INDEX FUNDS
EQUITY INDEX FUNDS<br />
NOTES TO THE FINANCIAL STATEMENTS continued<br />
Transactions in capital shares for the fiscal year ended March 31, 2013, were as follows:<br />
Amounts in thousands<br />
SHARES<br />
SOLD<br />
PROCEEDS<br />
FROM<br />
SHARES SOLD<br />
SHARES FROM<br />
REINVESTED<br />
DIVIDENDS<br />
REINVESTMENT<br />
OF<br />
DIVIDENDS<br />
SHARES<br />
REDEEMED<br />
PAYMENTS<br />
FOR SHARES<br />
REDEEMED<br />
NET<br />
INCREASE<br />
IN SHARES<br />
NET<br />
INCREASE<br />
IN NET ASSETS<br />
Emerging Markets <strong>Equity</strong> <strong>Index</strong> 65,133 $747,303 421 $4,949 (25,732) $(287,720) 39,822 $464,532<br />
Global Real Estate <strong>Index</strong> 70,757 624,766 580 5,139 (19,140) (170,356) 52,197 459,549<br />
Global Sustainability <strong>Index</strong> 4,178 39,116 65 610 (3,384) (30,553) 859 9,173<br />
International <strong>Equity</strong> <strong>Index</strong> 99,682* 1,001,874* 937 9,671 (39,667) (386,875) 60,952 624,670<br />
Mid Cap <strong>Index</strong> 22,515 301,723 1,369 18,108 (9,314) (122,920) 14,570 196,911<br />
Small Cap <strong>Index</strong> 26,987** 249,048** 731 6,753 (10,371) (95,349) 17,347 160,452<br />
Stock <strong>Index</strong> 112,376*** 1,984,137*** 658 11,827 (53,210) (937,305) 59,824 1,058,659<br />
* Numbers include assets received in connection with fund reorganization of approximately 24,466,000 shares sold and $243,678,000 in<br />
proceeds from shares sold. For further information on the reorganization, see Note 12.<br />
** Numbers include assets received in connection with fund reorganization of approximately 7,650,000 shares sold and $69,233,000 in<br />
proceeds from shares sold. For further information on the reorganization, see Note 12.<br />
*** Numbers include assets received in connection with fund reorganization of approximately 36,026,000 shares sold and $632,618,000 in<br />
proceeds from shares sold. For further information on the reorganization, see Note 12.<br />
9. DERIVATIVE INSTRUMENTS<br />
None of the derivatives held in the <strong>Funds</strong> have been designated as hedging instruments. Information concerning the types of derivatives<br />
in which the <strong>Funds</strong> invest, the objectives for using them and their related risks can be found in Note 2.<br />
Below are the types of derivatives by primary risk exposure as presented in the Statements of Assets and Liabilities as of March 31, 2014:<br />
Amounts in thousands ASSETS LIABILITIES<br />
FUND NAME<br />
DERIVATIVE TYPE<br />
STATEMENTS OF ASSETS AND<br />
LIABILITIES LOCATION<br />
VALUE<br />
STATEMENTS OF ASSETS AND<br />
LIABILITIES LOCATION<br />
VALUE<br />
Emerging Markets <strong>Equity</strong> <strong>Index</strong> <strong>Equity</strong> contracts Net Assets — Unrealized<br />
appreciation<br />
$1,299* Net Assets — Unrealized<br />
depreciation<br />
$ —*<br />
Forward foreign<br />
currency exchange<br />
contracts<br />
Unrealized gain on forward<br />
foreign currency exchange<br />
contracts<br />
42 Unrealized loss on forward foreign<br />
currency exchange contracts<br />
(7)<br />
Global Real Estate <strong>Index</strong> <strong>Equity</strong> contracts Net Assets — Unrealized<br />
appreciation<br />
240* Net Assets — Unrealized<br />
depreciation<br />
(19)*<br />
Forward foreign<br />
currency exchange<br />
contracts<br />
Unrealized gain on forward<br />
foreign currency exchange<br />
contracts<br />
86 Unrealized loss on forward foreign<br />
currency exchange contracts<br />
(89)<br />
Global Sustainability <strong>Index</strong> <strong>Equity</strong> contracts Net Assets — Unrealized<br />
appreciation<br />
87* Net Assets — Unrealized<br />
depreciation<br />
—*<br />
Forward foreign<br />
currency exchange<br />
contracts<br />
Unrealized gain on forward<br />
foreign currency exchange<br />
contracts<br />
13 Unrealized loss on forward foreign<br />
currency exchange contracts<br />
(11)<br />
EQUITY INDEX FUNDS 124 NORTHERN FUNDS ANNUAL REPORT
EQUITY INDEX FUNDS<br />
MARCH 31, 2014<br />
Amounts in thousands ASSETS LIABILITIES<br />
FUND NAME<br />
DERIVATIVE TYPE<br />
STATEMENTS OF ASSETS AND<br />
LIABILITIES LOCATION<br />
VALUE<br />
STATEMENTS OF ASSETS AND<br />
LIABILITIES LOCATION<br />
VALUE<br />
International <strong>Equity</strong> <strong>Index</strong> <strong>Equity</strong> contracts Net Assets — Unrealized<br />
appreciation<br />
Forward foreign Unrealized gain on forward<br />
currency exchange foreign currency exchange<br />
contracts<br />
contracts<br />
Mid Cap <strong>Index</strong> <strong>Equity</strong> contracts Net Assets — Unrealized<br />
appreciation<br />
Small Cap <strong>Index</strong> <strong>Equity</strong> contracts Net Assets — Unrealized<br />
appreciation<br />
Stock <strong>Index</strong> <strong>Equity</strong> contracts Net Assets — Unrealized<br />
appreciation<br />
$2,110* Net Assets — Unrealized<br />
depreciation<br />
112 Unrealized loss on forward foreign<br />
currency exchange contracts<br />
285* Net Assets — Unrealized<br />
depreciation<br />
—* Net Assets — Unrealized<br />
depreciation<br />
1,129* Net Assets — Unrealized<br />
depreciation<br />
$(228)*<br />
(480)<br />
—*<br />
(208)*<br />
—*<br />
* Includes cumulative appreciation/depreciation on futures contracts as reported in the Schedule of Investments’ footnotes. Only the current<br />
day’s variation margin is reported within the Statements of Assets and Liabilities.<br />
The <strong>Funds</strong> may enter into transactions subject to enforceable netting agreements or other similar arrangements (“netting agreements”).<br />
Generally, netting agreements allow the <strong>Funds</strong> to offset any exposure to a specific counterparty with any collateral received or delivered<br />
to that counterparty based on the terms of the agreements. Generally, the <strong>Funds</strong> manage their cash collateral and securities collateral<br />
on a counterparty basis.<br />
As of March 31, 2014, gross amounts of assets and liabilities for forward foreign exchange contracts not offset in the Statements of Assets<br />
and Liabilities, related collateral and net amounts after taking into account master netting arrangements, by counterparty, are as follows:<br />
Amounts in thousands<br />
GROSS AMOUNTS NOT OFFSET IN THE<br />
STATEMENTS OF ASSETS AND LIABILITIES<br />
FUND NAME<br />
COUNTERPARTY<br />
GROSS AMOUNTS OF ASSETS<br />
PRESENTED IN STATEMENTS OF<br />
ASSETS AND LIABILITIES<br />
FINANCIAL<br />
INSTRUMENTS<br />
CASH COLLATERAL<br />
RECEIVED<br />
NET<br />
AMOUNT<br />
Emerging Markets <strong>Equity</strong> <strong>Index</strong> UBS $42 $(7) $ — $35<br />
Total $42 $(7) $ — $35<br />
Global Real Estate <strong>Index</strong> Citibank $4 $(4) $ — $ —<br />
Goldman Sachs — — — —<br />
Morgan Stanley — — — —<br />
UBS 82 — — 82<br />
Total $86 $(4) $ — $82<br />
Global Sustainability <strong>Index</strong> Citibank $ — $ — $ — $ —<br />
Goldman Sachs — — — —<br />
Morgan Stanley 13 — — 13<br />
Total $13 $ — $ — $13<br />
International <strong>Equity</strong> <strong>Index</strong> Citibank $20 $(20) $ — $ —<br />
Goldman Sachs 13 (13) — —<br />
Morgan Stanley 69 (63) — 6<br />
UBS 10 — — 10<br />
Total $112 $(96) $ — $16<br />
NORTHERN FUNDS ANNUAL REPORT 125 EQUITY INDEX FUNDS
EQUITY INDEX FUNDS<br />
NOTES TO THE FINANCIAL STATEMENTS continued<br />
Amounts in thousands<br />
FUND NAME<br />
COUNTERPARTY<br />
GROSS AMOUNTS OF LIABILITIES<br />
PRESENTED IN STATEMENTS OF<br />
ASSETS AND LIABILITIES<br />
GROSS AMOUNTS NOT OFFSET IN THE<br />
STATEMENTS OF ASSETS AND LIABILITIES<br />
FINANCIAL<br />
INSTRUMENTS<br />
CASH COLLATERAL<br />
RECEIVED<br />
Emerging Markets <strong>Equity</strong> <strong>Index</strong> UBS $(7) $7 $ — $ —<br />
NET<br />
AMOUNT<br />
Total $(7) $7 $ — $ —<br />
Global Real Estate <strong>Index</strong> Citibank $(34) $4 $ — $(30)<br />
Goldman Sachs (8) — — (8)<br />
Morgan Stanley (47) — — (47)<br />
UBS — — — —<br />
Total $(89) $4 $ — $(85)<br />
Global Sustainability <strong>Index</strong> Citibank $(7) $ — $ — $(7)<br />
Goldman Sachs (4) — — (4)<br />
Morgan Stanley — — — —<br />
Total $(11) $ — $ — $(11)<br />
International <strong>Equity</strong> <strong>Index</strong> Citibank $(217) $20 $ — $(197)<br />
Goldman Sachs (200) 13 — (187)<br />
Morgan Stanley (63) 63 — —<br />
UBS — — — —<br />
Total $(480) $96 $ — $(384)<br />
The following tables set forth by primary risk exposure the <strong>Funds</strong>’ realized gains (losses) and change in unrealized appreciation<br />
(depreciation) by type of derivative contract for the fiscal year ended March 31, 2014:<br />
Amounts in thousands<br />
AMOUNT OF REALIZED GAIN (LOSS) ON DERIVATIVE CONTRACTS<br />
FUND NAME DERIVATIVE TYPE STATEMENTS OF OPERATIONS LOCATION VALUE<br />
Emerging Markets <strong>Equity</strong> <strong>Index</strong> <strong>Equity</strong> contracts Net realized gains (losses) on futures contracts $ 3,308<br />
Forward foreign currency<br />
exchange contracts<br />
Net realized gains (losses) on foreign currency transactions 313<br />
Global Real Estate <strong>Index</strong> <strong>Equity</strong> contracts Net realized gains (losses) on futures contracts 6,612<br />
Forward foreign currency<br />
exchange contracts<br />
Net realized gains (losses) on foreign currency transactions 11<br />
Global Sustainability <strong>Index</strong> <strong>Equity</strong> contracts Net realized gains (losses) on futures contracts 574<br />
Forward foreign currency<br />
exchange contracts<br />
Net realized gains (losses) on foreign currency transactions (13)<br />
International <strong>Equity</strong> <strong>Index</strong> <strong>Equity</strong> contracts Net realized gains (losses) on futures contracts 6,762<br />
Forward foreign currency<br />
exchange contracts<br />
Net realized gains (losses) on foreign currency transactions 426<br />
Mid Cap <strong>Index</strong> <strong>Equity</strong> contracts Net realized gains (losses) on futures contracts 4,244<br />
Small Cap <strong>Index</strong> <strong>Equity</strong> contracts Net realized gains (losses) on futures contracts 6,046<br />
Stock <strong>Index</strong> <strong>Equity</strong> contracts Net realized gains (losses) on futures contracts 25,686<br />
EQUITY INDEX FUNDS 126 NORTHERN FUNDS ANNUAL REPORT
EQUITY INDEX FUNDS<br />
MARCH 31, 2014<br />
CHANGE IN UNREALIZED APPRECIATION (DEPRECIATION) ON DERIVATIVE<br />
Amounts in thousands<br />
CONTRACTS<br />
FUND NAME DERIVATIVE TYPE STATEMENTS OF OPERATIONS LOCATION VALUE<br />
Emerging Markets <strong>Equity</strong> <strong>Index</strong> <strong>Equity</strong> contracts Net change in unrealized appreciation (depreciation) on futures contracts $1,446<br />
Forward foreign currency<br />
exchange contracts<br />
Net change in unrealized appreciation (depreciation) on foreign currency<br />
translations<br />
50<br />
Global Real Estate <strong>Index</strong> <strong>Equity</strong> contracts Net change in unrealized appreciation (depreciation) on futures contracts (348)<br />
Forward foreign currency<br />
exchange contracts<br />
Net change in unrealized appreciation (depreciation) on foreign currency<br />
translations<br />
(53)<br />
Global Sustainability <strong>Index</strong> <strong>Equity</strong> contracts Net change in unrealized appreciation (depreciation) on futures contracts 44<br />
Forward foreign currency<br />
exchange contracts<br />
Net change in unrealized appreciation (depreciation) on foreign currency<br />
translations<br />
1<br />
International <strong>Equity</strong> <strong>Index</strong> <strong>Equity</strong> contracts Net change in unrealized appreciation (depreciation) on futures contracts 2,078<br />
Forward foreign currency<br />
exchange contracts<br />
Net change in unrealized appreciation (depreciation) on foreign currency<br />
translations<br />
(428)<br />
Mid Cap <strong>Index</strong> <strong>Equity</strong> contracts Net change in unrealized appreciation (depreciation) on futures contracts (452)<br />
Small Cap <strong>Index</strong> <strong>Equity</strong> contracts Net change in unrealized appreciation (depreciation) on futures contracts (614)<br />
Stock <strong>Index</strong> <strong>Equity</strong> contracts Net change in unrealized appreciation (depreciation) on futures contracts (659)<br />
Volume of derivative activity for the fiscal year ended March 31, 2014*:<br />
FORWARD FOREIGN CURRENCY<br />
EXCHANGE CONTRACTS<br />
NUMBER<br />
OF<br />
TRADES<br />
AVERAGE<br />
NOTIONAL<br />
AMOUNT**<br />
FUTURES<br />
EQUITY CONTRACTS<br />
NUMBER<br />
OF<br />
TRADES<br />
AVERAGE<br />
NOTIONAL<br />
AMOUNT**<br />
Emerging Markets <strong>Equity</strong> <strong>Index</strong> 26 $2,458 133 $2,902<br />
Global Real Estate <strong>Index</strong> 205 637 726 682<br />
Global Sustainability <strong>Index</strong> 66 143 293 165<br />
International <strong>Equity</strong> <strong>Index</strong> 140 2,463 264 1,756<br />
Mid Cap <strong>Index</strong> — — 328 973<br />
Small Cap <strong>Index</strong> — — 325 961<br />
Stock <strong>Index</strong> — — 289 3,910<br />
* Activity during the period is measured by number of trades during the period and average notional amount forward foreign currency<br />
exchange and futures equity contracts.<br />
** Amounts in thousands.<br />
10. INDEMNIFICATIONS AND WARRANTIES<br />
In the ordinary course of their business, the <strong>Funds</strong> may enter<br />
into contracts or agreements that contain indemnifications or<br />
warranties. Future events could occur that lead to the execution<br />
of these provisions against the <strong>Funds</strong>. The maximum exposure<br />
to the <strong>Funds</strong> under these provisions is unknown, as this would<br />
involve future claims that have not yet occurred. However, the<br />
<strong>Funds</strong> have not had prior claims or losses pursuant to these<br />
contracts and believe the risk of loss to be remote.<br />
11. LEGAL PROCEEDINGS<br />
In December 2007, the Mid Cap <strong>Index</strong> Fund (the “Fund”), as a<br />
shareholder of Lyondell Chemical Company (“Lyondell”),<br />
participated in a cash out merger of Lyondell in which it received<br />
$48/share of merger consideration. Lyondell later filed for bankruptcy<br />
and two entities created by the Lyondell bankruptcy plan of<br />
reorganization have initiated lawsuits, based on fraudulent transfer<br />
claims, seeking to recover, or clawback, proceeds received by<br />
shareholders, including the Fund, in the December 2007 merger.<br />
NORTHERN FUNDS ANNUAL REPORT 127 EQUITY INDEX FUNDS
EQUITY INDEX FUNDS<br />
NOTES TO THE FINANCIAL STATEMENTS continued<br />
The first action, Edward S. Weisfelner, as Trustee of the LB Creditor<br />
Trust v. Fund 1, et al. (the “Creditor Action”), was initiated<br />
on October 22, 2010 and is now pending in the U.S. Bankruptcy<br />
court for the Southern District of New York. The Creditor Action<br />
asserts causes of action for intentional and constructive fraudulent<br />
transfer under state law. On January 14, 2014, the U.S.<br />
Bankruptcy Court issued a decision and order dismissing (a) the<br />
intentional fraudulent transfer claim as to all defendants<br />
(without prejudice), (b) the constructive fraudulent claim as to<br />
all conduits and non-beneficial owners of Lyondell stock (with<br />
prejudice), and (c) the secured lender deficiency claims that had<br />
been assigned to the Creditor Trust. The Court, however,<br />
rejected the remaining arguments in the motions to dismiss. It is<br />
anticipated that the Creditor Trust will file an amended complaint<br />
to replead the intentional fraudulent transfer claim and<br />
other claims that were not dismissed.<br />
The second action, Edward S. Weisfelner, as trustee of the LB<br />
Litigation Trust v. A Holmes & H Holmes TTEE, et al. (the<br />
“Litigation Action”), was initiated as a putative defendant class<br />
action on December 23, 2010, in the U.S. Bankruptcy Court for<br />
the Southern District of New York. The Fund, while not<br />
expressly named, is included in the definition of the putative<br />
class of defendants. A claim for intentional fraudulent transfer<br />
under the U.S. Bankruptcy Code is the only remaining claim in<br />
this action. On February 4, 2014, the Court stated that the decision<br />
and order issued in the Creditor Action is deemed to apply<br />
in the Litigation Action. The Litigation Trust has indicated it also<br />
intends to file an amended complaint to cure deficiencies in its<br />
intentional fraudulent transfer claim.<br />
Both the Creditor and Litigation Actions attempt to recover the<br />
proceeds paid out to the holders of Lyondell shares at the time of<br />
the 2007 merger. The value of the proceeds received by the Fund<br />
was approximately $4,171,000. The Fund cannot predict the<br />
outcome of these proceedings, but an adverse decision could<br />
have a material impact on the Fund’s net asset value. The Fund<br />
intends to vigorously defend these actions.<br />
In 2007, the Stock <strong>Index</strong> Fund was a shareholder of the Tribune<br />
Company (“Tribune”). In December of 2007, as a part of a leveraged<br />
buy-out transaction (the “LBO”), Tribune was converted<br />
from a public company to a privately-held company. Tribune<br />
later filed for bankruptcy.<br />
On December 7, 2010, <strong>Northern</strong> <strong>Funds</strong> was named as a defendant<br />
and a putative member of the proposed defendant class of<br />
shareholders named in an adversary proceeding (the “Committee<br />
Action”) brought by The Official Committee of Unsecured Creditors<br />
of Tribune Company (the “Committee”) in the U.S. Bankruptcy<br />
Court for the District of Delaware, in connection with<br />
Tribune’s bankruptcy proceeding. On June 2, 2011, a second suit<br />
was initiated by certain creditors of Tribune in the Delaware<br />
Superior Court with respect to claims related to the LBO (Niese<br />
et al. v. A.G. Edwards, Inc. et al.), in which <strong>Northern</strong> <strong>Funds</strong> was<br />
named as a defendant. The indenture trustees, on behalf of certain<br />
noteholders of Tribune, filed a third suit and named <strong>Northern</strong><br />
<strong>Funds</strong> as a defendant on June 2, 2011 in the U.S. District<br />
Court for the <strong>Northern</strong> District of Illinois (Deutsche Bank Trust<br />
Co. et al. v. Ohlson Enterprises et al.). Each of these cases has<br />
now been consolidated into a Multi-District Litigation proceeding,<br />
pending in the Southern District of New York. The cases<br />
attempt to “clawback” the proceeds paid out in connection with<br />
the LBO.<br />
The defendants have jointly moved to dismiss all of the actions<br />
filed by the individual creditors in the Niese and Deutsche Bank<br />
cases. The Committee Action was not subject to the motion to<br />
dismiss. On September 23, 2013, the District Court dismissed the<br />
individual creditors’ actions. The individual creditors filed a<br />
notice of appeal of the Court’s decision on September 30, 2013.<br />
The appeal is currently pending before the United States Court of<br />
Appeals for the Second Circuit.<br />
The value of the proceeds received by the Stock <strong>Index</strong> Fund in<br />
the LBO was approximately $790,000, which includes proceeds of<br />
approximately $372,000 received by the NIF <strong>Equity</strong> <strong>Index</strong><br />
Portfolio, which was acquired by the Stock <strong>Index</strong> Fund in 2012.<br />
The Fund cannot predict the outcome of these proceedings, but<br />
an adverse decision could have a material impact on the Fund’s<br />
net asset value. The Fund intends to vigorously defend these<br />
actions.<br />
12. REORGANIZATION<br />
On August 9, 2012, the Board of the Trust approved a Plan of<br />
Reorganization (the “Plan”) providing for the reorganization of<br />
the series of <strong>Northern</strong> Institutional <strong>Funds</strong> (“NIF”) listed in the<br />
table below (each an “Acquired Fund”) into a corresponding<br />
series of the Trust as set forth below under the heading Acquiring<br />
Fund (each an “Acquiring Fund”). Pursuant to the Plan, all of<br />
the assets of each Acquired Fund were transferred to the corresponding<br />
Acquiring Fund, as shown in the table below, in<br />
exchange for shares of the Acquiring Fund of equal aggregate<br />
value and the corresponding Acquiring Fund’s assumption of all<br />
of the current and future liabilities of the Acquired Fund. The<br />
cost basis of the investments received from the Acquired <strong>Funds</strong><br />
was carried forward to the corresponding Acquiring <strong>Funds</strong> for<br />
U.S. GAAP and tax purposes. Immediately following the<br />
reorganization, holders of Class A shares of each Acquired Fund<br />
held shares of the corresponding Acquiring Fund having an<br />
aggregate net asset value equal to the aggregate net asset value of<br />
the Class A shares held in the Acquired Fund immediately prior<br />
to the reorganization. The reorganization was accomplished by a<br />
tax-free exchange of shares and was completed on November 2,<br />
2012 as set forth in the table.<br />
EQUITY INDEX FUNDS 128 NORTHERN FUNDS ANNUAL REPORT
EQUITY INDEX FUNDS<br />
MARCH 31, 2014<br />
ACQUIRED FUND<br />
ACQUIRING FUND<br />
Amounts in thousands, except Share Conversion Ratio<br />
NIF<br />
EQUITY<br />
INDEX<br />
PORTFOLIO<br />
NIF<br />
INTERNATIONAL<br />
EQUITY INDEX<br />
PORTFOLIO<br />
NIF SMALL<br />
COMPANY INDEX<br />
PORTFOLIO<br />
NF STOCK<br />
INDEX<br />
FUND<br />
NF<br />
INTERNATIONAL<br />
EQUITY INDEX<br />
FUND<br />
NF SMALL<br />
CAP INDEX<br />
FUND<br />
Share Conversion Ratio 0.7989 0.7872 2.0034 0.7989 0.7872 2.0034<br />
Acquired Fund’s Shares 45,097 31,079 3,819 NA NA NA<br />
Acquiring Fund’s Shares NA NA NA 36,026 24,466 7,650<br />
Acquiring Fund’s Unrealized Appreciation 154,241 15,549 10,245 NA NA NA<br />
Net Assets Before The Reorganization 632,618 243,678 69,233 3,465,032 1,713,446 535,416<br />
Aggregate Net Assets Immediately After The Reorganization NA NA NA 4,097,650 1,957,124 604,649<br />
The tables below summarize the operations of the Acquired<br />
<strong>Funds</strong> for the acquiring period from December 1, 2011 to<br />
November 2, 2012, and the <strong>Funds</strong>’ results of operations for the<br />
year ended March 31, 2013.<br />
FOR THE PERIOD FROM DECEMBER 1, 2011 TO NOVEMBER 2, 2012<br />
(in thousands)<br />
FUND<br />
NET<br />
INVESTMENT<br />
INCOME (LOSS)<br />
NET REALIZED<br />
GAINS AND NET<br />
CHANGE IN<br />
UNREALIZED<br />
APPRECIATION<br />
ON INVESTMENTS<br />
NET INCREASE<br />
IN NET ASSETS<br />
RESULTING<br />
FROM<br />
OPERATIONS<br />
NIF <strong>Equity</strong> <strong>Index</strong><br />
Portfolio $14,155 $101,788 $115,943<br />
NIF International<br />
<strong>Equity</strong> <strong>Index</strong><br />
Portfolio 7,869 11,429 19,298<br />
NIF Small Company<br />
<strong>Index</strong> Portfolio 1,120 7,443 8,563<br />
FOR THE YEAR ENDED MARCH 31, 2013 (In thousands)<br />
FUND<br />
NET<br />
INVESTMENT<br />
INCOME<br />
NET REALIZED<br />
GAINS AND NET<br />
CHANGE IN<br />
UNREALIZED<br />
APPRECIATION<br />
ON INVESTMENTS<br />
NET INCREASE<br />
IN NET ASSETS<br />
RESULTING<br />
FROM<br />
OPERATIONS<br />
NF Stock <strong>Index</strong> Fund $81,256 $483,670 $564,926<br />
NF International <strong>Equity</strong><br />
<strong>Index</strong> Fund 55,189 169,014 224,203<br />
NF Small Cap <strong>Index</strong><br />
Fund 9,253 95,002 104,255<br />
Because the combined investment portfolios have been managed<br />
as a single integrated portfolio since the reorganization was<br />
completed, it is not practical to separate the amounts of net<br />
investment income (loss), net realized gains and change in<br />
unrealized appreciation (depreciation) on investments, and net<br />
increase (decrease) in net assets resulting from operations, of the<br />
Acquired <strong>Funds</strong> that have been included in the Acquiring<br />
<strong>Funds</strong>’ Statements of Operations since November 3, 2012.<br />
13. SUBSEQUENT EVENTS<br />
Management has evaluated subsequent events for the <strong>Funds</strong><br />
through the date the financial statements were issued, and has<br />
concluded that there are no recognized or non-recognized subsequent<br />
events relevant for financial statement disclosure other<br />
than the item noted below.<br />
A Special Joint Meeting of Shareholders of <strong>Northern</strong> <strong>Funds</strong>,<br />
including the <strong>Northern</strong> Multi-Manager <strong>Funds</strong>, and <strong>Northern</strong><br />
Institutional <strong>Funds</strong> was held on May 19, 2014. At the meeting,<br />
shareholders of each Fund approved a new management agreement<br />
between each Fund and its investment adviser, to provide<br />
each Fund with investment advisory and administration services<br />
under a single agreement and fee structure. The annual rates for<br />
the new management fees are disclosed in the proxy statement.<br />
See “Shareholder Meeting Results” below on page 132.<br />
NORTHERN FUNDS ANNUAL REPORT 129 EQUITY INDEX FUNDS
EQUITY INDEX FUNDS<br />
REPORT OF INDEPENDENT REGISTERED PUBLIC ACCOUNTING FIRM<br />
To the Shareholders and Board of Trustees of <strong>Northern</strong> <strong>Funds</strong>:<br />
We have audited the accompanying statements of assets and liabilities of Emerging Markets <strong>Equity</strong> <strong>Index</strong> Fund, Global Real Estate<br />
<strong>Index</strong> Fund, Global Sustainability <strong>Index</strong> Fund, International <strong>Equity</strong> <strong>Index</strong> Fund, Mid Cap <strong>Index</strong> Fund, Small Cap <strong>Index</strong> Fund, and<br />
Stock <strong>Index</strong> Fund (collectively, the “<strong>Funds</strong>”), seven separate portfolios of <strong>Northern</strong> <strong>Funds</strong> (the “Trust”), including the schedules of<br />
investments, as of March 31, 2014, and the related statements of operations for the year then ended, the statements of changes in<br />
net assets for each of the two years in the period then ended, and the financial highlights for each of the five years in the period then<br />
ended. These financial statements and financial highlights are the responsibility of the Trust’s management. Our responsibility is to<br />
express an opinion on these financial statements and financial highlights based on our audits.<br />
We conducted our audits in accordance with the standards of the Public Company Accounting Oversight Board (United States).<br />
Those standards require that we plan and perform the audits to obtain reasonable assurance about whether the financial statements<br />
and financial highlights are free of material misstatement. The Trust is not required to have, nor were we engaged to perform, an<br />
audit of its internal control over financial reporting. Our audits included consideration of internal control over financial reporting<br />
as a basis for designing audit procedures that are appropriate in the circumstances, but not for the purpose of expressing an opinion<br />
on the effectiveness of the <strong>Funds</strong>’ internal control over financial reporting. Accordingly, we express no such opinion. An audit also<br />
includes examining, on a test basis, evidence supporting the amounts and disclosures in the financial statements, assessing the<br />
accounting principles used and significant estimates made by management, as well as evaluating the overall financial statement<br />
presentation. Our procedures included confirmation of securities owned as of March 31, 2014, by correspondence with the custodian,<br />
transfer agent, and brokers; where replies were not received from brokers, we performed other auditing procedures. We<br />
believe that our audits provide a reasonable basis for our opinion.<br />
In our opinion, the financial statements and financial highlights referred to above present fairly, in all material respects, the financial<br />
position of each of the <strong>Funds</strong> referred to above as of March 31, 2014, the results of their operations for the year then ended, the<br />
changes in their net assets for each of the two years in the period then ended, and the financial highlights for each of the five years in<br />
the period then ended, in conformity with accounting principles generally accepted in the United States of America.<br />
DELOITTE & TOUCHE LLP<br />
Chicago, Illinois<br />
May 23, 2014<br />
EQUITY INDEX FUNDS 130 NORTHERN FUNDS ANNUAL REPORT
EQUITY INDEX FUNDS<br />
TAX INFORMATION<br />
MARCH 31, 2014 (UNAUDITED)<br />
QUALIFIED DIVIDEND INCOME (QDI) — Under the Jobs and<br />
Growth Tax Relief Reconciliation Act of 2003 (the “Act”), the<br />
following percentages of ordinary dividends paid during the fiscal<br />
year ended March 31, 2014 are designated as “qualified dividend<br />
income”, as defined in the Act, subject to reduced tax rates<br />
in 2013:<br />
Fund<br />
QDI<br />
PERCENTAGE<br />
Emerging Markets <strong>Equity</strong> <strong>Index</strong> 74.18%<br />
Global Real Estate <strong>Index</strong> 21.08%<br />
Global Sustainability <strong>Index</strong> 100.00%<br />
International <strong>Equity</strong> <strong>Index</strong> 100.00%<br />
Mid Cap <strong>Index</strong> 38.06%<br />
Small Cap <strong>Index</strong> 37.21%<br />
Stock <strong>Index</strong> 91.81%<br />
CORPORATE DIVIDENDS RECEIVED DEDUCTION (DRD) — A percentage<br />
of the dividends distributed during the fiscal year for the<br />
following <strong>Funds</strong> qualifies for the dividends-received deduction<br />
for corporate shareholders:<br />
FOREIGN TAX CREDIT — The <strong>Funds</strong> below intend to make an<br />
election that will allow shareholders to treat their proportionate<br />
share of foreign taxes paid by the <strong>Funds</strong> as having been paid by<br />
them. The amounts per share which represent income from<br />
sources within, and taxes paid to, foreign countries are as follows:<br />
Fund TAXES INCOME<br />
Emerging Markets <strong>Equity</strong> <strong>Index</strong> $0.0279 $0.3048<br />
Global Real Estate <strong>Index</strong> 0.0037 0.1567<br />
Global Sustainability <strong>Index</strong> 0.0094 0.1957<br />
International <strong>Equity</strong> <strong>Index</strong> 0.0143 0.3498<br />
CAPITAL GAIN DISTRIBUTION — The following <strong>Funds</strong> made<br />
capital gain distributions in December 2013, and hereby designated<br />
these long-term capital gain distributions as follow (per<br />
share):<br />
LONG-TERM<br />
CAPITAL GAIN<br />
Fund 15%<br />
Mid Cap <strong>Index</strong> $0.413269<br />
Small Cap <strong>Index</strong> 0.433579<br />
Fund<br />
CORPORATE DRD<br />
PERCENTAGE<br />
Stock <strong>Index</strong> 0.073278<br />
Global Sustainability <strong>Index</strong> 35.02%<br />
Mid Cap <strong>Index</strong> 36.63%<br />
Small Cap <strong>Index</strong> 34.44%<br />
Stock <strong>Index</strong> 91.44%<br />
NORTHERN FUNDS ANNUAL REPORT 131 EQUITY INDEX FUNDS
EQUITY INDEX FUNDS<br />
SHAREHOLDER MEETING RESULTS<br />
MARCH 31, 2014 (UNAUDITED)<br />
A Special Joint Meeting of Shareholders of <strong>Northern</strong> <strong>Funds</strong>,<br />
including the <strong>Northern</strong> Multi-Manager <strong>Funds</strong>, and <strong>Northern</strong><br />
Institutional <strong>Funds</strong> was held on May 19, 2014, at the office of<br />
<strong>Northern</strong> Trust Investments, Inc. 50 South LaSalle Street, Chicago,<br />
Illinois. At the meeting the following matters were voted<br />
upon by the shareholders of <strong>Northern</strong> <strong>Funds</strong> (the resulting votes<br />
are presented below):<br />
1. Election of nine Trustees of <strong>Northern</strong> <strong>Funds</strong><br />
NOMINEE AFFIRMATIVE WITHHELD<br />
William L. Bax 16,123,676,354 84,106,065<br />
Edward J. Condon, Jr. 16,127,563,265 80,219,154<br />
Mark G. Doll 16,128,157,353 79,625,066<br />
Sandra Polk Guthman 16,122,618,125 85,164,294<br />
Cynthia R. Plouché 16,124,728,401 83,054,018<br />
Stephen N. Potter 16,132,017,275 75,765,144<br />
Mary Jacobs Skinner 16,129,747,417 78,035,002<br />
Richard P. Strubel 16,126,864,893 80,917,526<br />
Casey J. Sylla 16,128,132,320 79,650,099<br />
2. To approve a new management agreement, included<br />
with the Proxy Statement for the Meeting, between each<br />
Fund and its investment adviser, to provide each Fund<br />
with investment advisory and administration services<br />
under a single agreement and fee structure.<br />
FUND FOR AGAINST ABSTAIN<br />
BROKER<br />
NON-VOTE<br />
Emerging Markets<br />
<strong>Equity</strong> <strong>Index</strong> Fund 166,954,224 52,976 8,920 4,145,194<br />
Global Real Estate<br />
<strong>Index</strong> Fund 136,690,268 73,026 14,779 4,187,229<br />
Global Sustainability<br />
<strong>Index</strong> Fund 11,371,284 1,811 7,046 1,411,593<br />
International <strong>Equity</strong><br />
<strong>Index</strong> Fund 334,913,341 48,575 1,732,855 4,251,101<br />
Mid Cap <strong>Index</strong> Fund 68,653,935 64,031 81,870 2,528,915<br />
Small Cap <strong>Index</strong> Fund 68,036,795 66,827 146,058 3,397,392<br />
Stock <strong>Index</strong> Fund 216,654,798 45,710 319,938 9,067,017<br />
3. To approve a change to the fundamental investment<br />
objectives for certain <strong>Northern</strong> <strong>Funds</strong> to nonfundamental,<br />
which would permit the Trustees of the<br />
Trust, instead of shareholders, to approve a change in the<br />
objective.<br />
FUND FOR AGAINST ABSTAIN<br />
BROKER<br />
NON-VOTE<br />
International <strong>Equity</strong><br />
<strong>Index</strong> Fund 334,100,896 864,900 1,728,975 4,251,101<br />
Small Cap <strong>Index</strong> Fund 66,523,176 1,603,790 122,714 3,397,392<br />
Stock <strong>Index</strong> Fund 210,759,687 5,762,929 497,830 9,067,017<br />
EQUITY INDEX FUNDS 132 NORTHERN FUNDS ANNUAL REPORT
EQUITY INDEX FUNDS<br />
FUND EXPENSES<br />
MARCH 31, 2014 (UNAUDITED)<br />
As a shareholder of the <strong>Funds</strong>, you incur two types of costs:<br />
(1) transaction costs, if any, including redemption fees on certain<br />
exchanges and redemptions in the Emerging Markets <strong>Equity</strong> <strong>Index</strong>,<br />
Global Real Estate <strong>Index</strong>, Global Sustainability <strong>Index</strong>, and International<br />
<strong>Equity</strong> <strong>Index</strong> <strong>Funds</strong>; and (2) ongoing costs, including advisory<br />
fees and other fund expenses. This Example is intended to help<br />
you understand your ongoing costs (in dollars) of investing in the<br />
<strong>Funds</strong> and to compare these costs with the ongoing costs of investing<br />
in other mutual funds.<br />
The Example is based on an investment of $1,000 invested at the<br />
beginning of the period and held for the entire period, October 1,<br />
2013 through March 31, 2014.<br />
ACTUAL EXPENSES<br />
The first line of the tables below provides information about<br />
actual account values and actual expenses. You may use the<br />
information in this line, together with the amount you invested,<br />
to estimate the expenses that you paid over the period. Simply<br />
divide your account value by $1,000 (for example, an $8,600<br />
account value divided by $1,000 = 8.6), then multiply the result<br />
by the number in the first line under the heading entitled<br />
“Expenses Paid 10/1/13 - 3/31/14” to estimate the expenses you<br />
paid on your account during this period.<br />
HYPOTHETICAL EXAMPLE FOR COMPARISON<br />
PURPOSES<br />
The second line in the tables below provides information about<br />
hypothetical account values and hypothetical expenses based on<br />
the <strong>Funds</strong>’ actual expense ratios and an assumed rate of return of<br />
5 percent per year before expenses, which is not the <strong>Funds</strong>’ actual<br />
return. The hypothetical account values and expenses may not be<br />
used to estimate the actual ending account balance or expenses<br />
you paid for the period. You may use this information to compare<br />
the ongoing costs of investing in the <strong>Funds</strong> and other funds.<br />
To do so, compare this 5 percent hypothetical example with the<br />
5 percent hypothetical examples that appear in the shareholder<br />
reports of the other funds.<br />
Please note that the expenses shown in the table are meant to<br />
highlight your ongoing costs only and do not reflect any transactional<br />
costs, such as sales charges (loads), redemption fees, or<br />
exchange fees or other costs such as advisory fees related to affiliated<br />
money market funds investments, but shareholders of other<br />
funds may incur such costs. For example, the information does<br />
not reflect redemption fees (as described on page 118), if any, in<br />
the Emerging Markets <strong>Equity</strong> <strong>Index</strong>, Global Real Estate <strong>Index</strong>,<br />
Global Sustainability <strong>Index</strong>, and International <strong>Equity</strong> <strong>Index</strong><br />
<strong>Funds</strong>. If these fees were included, your costs would have been<br />
higher. The information also does not reflect reimbursements on<br />
advisory fees incurred in connection with the investment of<br />
uninvested cash in affiliated money market funds (as described<br />
on page 122), which may result in different expense ratios in the<br />
Financial Highlights. Therefore, the hypothetical information is<br />
useful in comparing ongoing costs only, and will not help you<br />
determine the relative total costs of owning different funds.<br />
EMERGING MARKETS EQUITY INDEX<br />
EXPENSE<br />
RATIO<br />
BEGINNING<br />
VALUE<br />
10/1/13<br />
ENDING<br />
ACCOUNT<br />
VALUE<br />
3/31/14<br />
EXPENSES<br />
PAID*<br />
10/1/13 -<br />
3/31/14<br />
Actual 0.30% $1,000 $1,011.40 $1.50<br />
Hypothetical** 0.30% $1,000 $1,023.44 $1.51<br />
GLOBAL REAL ESTATE INDEX<br />
EXPENSE<br />
RATIO<br />
BEGINNING<br />
ACCOUNT<br />
VALUE<br />
10/1/13<br />
ENDING<br />
ACCOUNT<br />
VALUE<br />
3/31/14<br />
EXPENSES<br />
PAID*<br />
10/1/13 -<br />
3/31/14<br />
Actual 0.50% $1,000 $1,026.40 $2.53<br />
Hypothetical** 0.50% $1,000 $1,022.44 $2.52<br />
GLOBAL SUSTAINABILITY INDEX<br />
EXPENSE<br />
RATIO<br />
BEGINNING<br />
ACCOUNT<br />
VALUE<br />
10/1/13<br />
ENDING<br />
ACCOUNT<br />
VALUE<br />
3/31/14<br />
EXPENSES<br />
PAID*<br />
10/1/13 -<br />
3/31/14<br />
Actual 0.30% $1,000 $1,091.90 $1.56<br />
Hypothetical** 0.30% $1,000 $1,023.44 $1.51<br />
INTERNATIONAL EQUITY INDEX<br />
EXPENSE<br />
RATIO<br />
BEGINNING<br />
ACCOUNT<br />
VALUE<br />
10/1/13<br />
ENDING<br />
ACCOUNT<br />
VALUE<br />
3/31/14<br />
EXPENSES<br />
PAID*<br />
10/1/13 -<br />
3/31/14<br />
Actual 0.25% $1,000 $1,062.90 $1.29<br />
Hypothetical** 0.25% $1,000 $1,023.68 $1.26<br />
MID CAP INDEX<br />
EXPENSE<br />
RATIO<br />
BEGINNING<br />
ACCOUNT<br />
VALUE<br />
10/1/13<br />
ENDING<br />
ACCOUNT<br />
VALUE<br />
3/31/14<br />
EXPENSES<br />
PAID*<br />
10/1/13 -<br />
3/31/14<br />
Actual 0.15% $1,000 $1,115.60 $0.79<br />
Hypothetical** 0.15% $1,000 $1,024.18 $0.76<br />
SMALL CAP INDEX<br />
EXPENSE<br />
RATIO<br />
BEGINNING<br />
ACCOUNT<br />
VALUE<br />
10/1/13<br />
ENDING<br />
ACCOUNT<br />
VALUE<br />
3/31/14<br />
EXPENSES<br />
PAID*<br />
10/1/13 -<br />
3/31/14<br />
Actual 0.15% $1,000 $1,098.90 $0.78<br />
Hypothetical** 0.15% $1,000 $1,024.18 $0.76<br />
NORTHERN FUNDS ANNUAL REPORT 133 EQUITY INDEX FUNDS
EQUITY INDEX FUNDS<br />
FUND EXPENSES<br />
MARCH 31, 2014 (UNAUDITED)<br />
STOCK INDEX<br />
EXPENSE<br />
RATIO<br />
BEGINNING<br />
ACCOUNT<br />
VALUE<br />
10/1/13<br />
ENDING<br />
ACCOUNT<br />
VALUE<br />
3/31/14<br />
EXPENSES<br />
PAID*<br />
10/1/13 -<br />
3/31/14<br />
Actual 0.10% $1,000 $1,124.50 $0.53<br />
Hypothetical** 0.10% $1,000 $1,024.43 $0.50<br />
* Expenses are calculated using the <strong>Funds</strong>’ annualized expense<br />
ratios, which represent ongoing expenses as a percentage of net<br />
assets for the six months ended March 31, 2014. Expenses are<br />
calculated by multiplying the annualized expense ratio by the<br />
average account value over the period; then multiplying the result<br />
by the number of days in the most recent fiscal half year (182);<br />
and then dividing that result by the number of days in the current<br />
fiscal year (365). Expense ratios for the most recent half year may<br />
differ from expense ratios based on one year data in the Financial<br />
Highlights.<br />
** Hypothetical expenses are based on the <strong>Funds</strong>’ actual annualized<br />
expense ratios and an assumed rate of return of 5 percent per year<br />
before expenses.<br />
EQUITY INDEX FUNDS 134 NORTHERN FUNDS ANNUAL REPORT
EQUITY INDEX FUNDS<br />
TRUSTEES AND OFFICERS<br />
MARCH 31, 2014 (UNAUDITED)<br />
Set forth below is information about the Trustees and Officers of <strong>Northern</strong> <strong>Funds</strong>. Each Trustee has served in that capacity since he<br />
or she was originally elected or appointed to the Board of Trustees. The <strong>Northern</strong> <strong>Funds</strong>’ Statement of Additional Information<br />
contains additional information about the Trustees and is available upon request and without charge by calling 800-595-9111.<br />
INDEPENDENT TRUSTEES<br />
NAME, ADDRESS (1) , AGE,<br />
POSITIONS HELD WITH THE<br />
TRUST AND LENGTH OF<br />
SERVICE AS TRUSTEE (2)<br />
PRINCIPAL OCCUPATIONS DURING PAST FIVE YEARS<br />
OTHER DIRECTOR-SHIPS<br />
HELD BY TRUSTEE (3)<br />
NUMBER OF FUNDS<br />
OVERSEEN IN FUND<br />
COMPLEX (4)<br />
William L. Bax<br />
Age: 70<br />
Trustee of <strong>Northern</strong><br />
<strong>Funds</strong> since 2005<br />
• Managing Partner of PricewaterhouseCoopers, Chicago<br />
(an accounting firm) from 1997 to 2003;<br />
• Director of Big Shoulders Fund since 1997;<br />
• Director of Lurie Children’s Hospital since 1998;<br />
• Trustee of DePaul University from 1998 to 2009;<br />
• Director of Andrew Corporation (a communications<br />
product company) from 2006 to 2008.<br />
• Arthur J. Gallagher & Co.<br />
(an insurance brokerage<br />
company).<br />
56<br />
Edward J. Condon, Jr.<br />
Age: 73<br />
Trustee of <strong>Northern</strong><br />
<strong>Funds</strong> since 2000<br />
Mark G. Doll<br />
Age: 64<br />
Trustee of <strong>Northern</strong><br />
<strong>Funds</strong> since 2013<br />
• Chairman and CEO of The Paradigm Group, Ltd.<br />
(a financial adviser) since 1993;<br />
• Principal and Co-Founder of Paradigm Capital, Ltd.<br />
(a financial adviser) since 1996;<br />
• Founding Member and Director of the Illinois Venture<br />
Capital Association since 2001;<br />
• Member of the Board of Governors of The<br />
Metropolitan Club since 2003;<br />
• Member of the Board of Advisors of AAVIN <strong>Equity</strong><br />
Partners (a private equity firm) since 2005;<br />
• Member of the National Advisory Board of National<br />
Domestic Violence Hotline since 2005;<br />
• Member of the Board of Directors at LightBridge<br />
Healthcare Research Inc. (a healthcare-related<br />
educational materials provider) since 2006;<br />
• Member of Advisory Board of Lextech Global Services<br />
(a systems engineering services company) since 2009;<br />
• Member of Advisory Council of Northwestern Brain<br />
Tumor Institute since 2010;<br />
• Chairman of The Board of Directors of ViMedicus, Inc.<br />
(a healthcare-related educational materials provider)<br />
since 2010.<br />
• Executive Vice President and Chief Investment Officer,<br />
Northwestern Mutual Life Insurance Company from<br />
2008 to 2012;<br />
• Senior Vice President — Public Markets, Northwestern<br />
Mutual Life Insurance Company from 2002 to 2008;<br />
• President, Northwestern Mutual Series Fund, Mason<br />
Street Advisors and Mason Street <strong>Funds</strong> from 2002 to<br />
2008;<br />
• Chairman, Archdiocese of Milwaukee Finance Council<br />
since 2005;<br />
• Member of Investment Committee of Milwaukee Art<br />
Museum since 1995;<br />
• Member of Investment Committee of Greater<br />
Milwaukee Foundation since 2003;<br />
• Member of Investment Committee of Milwaukee<br />
Symphony Orchestra since 2006.<br />
• None 56<br />
• None 56<br />
NORTHERN FUNDS ANNUAL REPORT 135 EQUITY INDEX FUNDS
EQUITY INDEX FUNDS<br />
TRUSTEES AND OFFICERS continued<br />
INDEPENDENT TRUSTEES<br />
NAME, ADDRESS (1) , AGE,<br />
POSITIONS HELD WITH THE<br />
TRUST AND LENGTH OF<br />
SERVICE AS TRUSTEE (2)<br />
PRINCIPAL OCCUPATIONS DURING PAST FIVE YEARS<br />
OTHER DIRECTOR-SHIPS<br />
HELD BY TRUSTEE (3)<br />
NUMBER OF FUNDS<br />
OVERSEEN IN FUND<br />
COMPLEX (4)<br />
Sandra Polk Guthman<br />
Age: 70<br />
Vice Chair<br />
since 2014 and<br />
Trustee of <strong>Northern</strong><br />
<strong>Funds</strong> since 2000<br />
• Chair since 1993 and CEO from 1993 to 2012 of Polk<br />
Bros. Foundation (an Illinois not-for-profit<br />
corporation);<br />
• Director of National Public Finance Guarantee<br />
Corporation (f/k/a MBIA Insurance Corp. of Illinois)<br />
(a municipal bond insurance company) from 1994 to<br />
2014;<br />
• Trustee of Rush University Medical Center since 2007;<br />
• Trustee of Wellesley College since 2010.<br />
• None 56<br />
Cynthia R. Plouché (5)<br />
Trustee Nominee<br />
Age: 57<br />
• Senior Portfolio Manager and member of Investment<br />
Policy Committee, Williams Capital Management, LLC<br />
from 2006 to 2012;<br />
• Managing Director and Chief Investment Officer of<br />
Blaylock-Abacus Asset management, Inc. from June<br />
2003 to 2006;<br />
• Founder, Chief Investment Officer and Managing<br />
Director of Abacus Financial Group from May 1991 to<br />
2003, a manager of fixed income portfolios for<br />
institutional clients;<br />
• Assessor, Moraine Township, Illinois since January<br />
2014.<br />
• AXA Premier VIP Trust<br />
(Registered investment<br />
company — 36 portfolios)<br />
56<br />
Mary Jacobs Skinner, Esq.<br />
Age: 56<br />
Trustee of <strong>Northern</strong><br />
<strong>Funds</strong> since 1998<br />
• Partner in the law firm of Sidley Austin LLP. • None 47<br />
Richard P. Strubel<br />
Age: 74<br />
Chairman of the<br />
Board of each Trust<br />
since 2008<br />
Trustee of <strong>Northern</strong><br />
<strong>Funds</strong> since 2000<br />
• Vice Chairman and Director of Cardean Learning<br />
Group (formerly UNext, Inc.) (a provider of<br />
educational services via the Internet) from 2004 to<br />
2007;<br />
• President, Chief Operating Officer and Director of<br />
UNext, Inc. from 1999 to 2004.<br />
• Gildan Activewear, Inc. (a<br />
56<br />
clothing marketing and<br />
manufacturing company);<br />
• Goldman Sachs Mutual Fund<br />
Complex (94 portfolios);<br />
• Goldman Sachs BDC, Inc. (6)<br />
Casey J. Sylla<br />
Age: 70<br />
Trustee of <strong>Northern</strong><br />
<strong>Funds</strong> since 2008<br />
• Board member, University of Wisconsin — Eau Claire<br />
Foundation since 2006;<br />
• Advisor, G.D. Searle Family Trusts from 2010 to 2012<br />
and Independent Trustee since 2012.<br />
• GATX Corporation<br />
(transportation services)<br />
56<br />
(1) Each Nominee may be contacted by writing to the Trustee, c/o Diana E. McCarthy, Drinker Biddle & Reath LLP, One Logan Square,<br />
Suite 2000, Philadelphia, PA 19103-6996.<br />
(2) Each Trustee will hold office for an indefinite term until the earliest of: (i) the next meeting of shareholders, if any, called for the purpose<br />
of considering the election or re-election of such Trustee and until the election and qualification of his or her successor, if any, elected at<br />
such meeting; (ii) the date a Trustee resigns or retires, or a Trustee is removed by the Board of Trustees or shareholders, in accordance<br />
with the Trust’s Agreement and Declaration of Trust; or (iii) in accordance with the current resolutions of the Board of Trustees (which<br />
may be changed without shareholder vote) on the last day of the calendar year in which he or she attains the age of seventy-five years.<br />
(3) This column includes only directorships of companies required to report to the SEC under the Exchange Act (i.e., public companies) or<br />
other investment companies registered under the 1940 Act.<br />
EQUITY INDEX FUNDS 136 NORTHERN FUNDS ANNUAL REPORT
EQUITY INDEX FUNDS<br />
MARCH 31, 2014 (UNAUDITED)<br />
(4) The <strong>Northern</strong> mutual funds complex consists of 56 portfolios — 48 portfolios of <strong>Northern</strong> <strong>Funds</strong>, including 9 Multi-Manager <strong>Funds</strong>,<br />
and 8 portfolios of <strong>Northern</strong> Institutional <strong>Funds</strong>. Ms. Skinner oversees 47 portfolios in the complex — 39 portfolios of the Trust and 8<br />
portfolios of <strong>Northern</strong> Institutional <strong>Funds</strong>.<br />
(5) Ms. Plouché was nominated as a Trustee of <strong>Northern</strong> <strong>Funds</strong> at a meeting of the Board of Trustees of <strong>Northern</strong> <strong>Funds</strong> held on<br />
February 14, 2014. Ms. Plouché’s nomination is subject to a vote of <strong>Northern</strong> <strong>Funds</strong> shareholders at a special meeting to be held on<br />
May 19, 2014.<br />
(6) Registration statement filed with SEC but not yet effective as of the date of this Joint Proxy Statement.<br />
INTERESTED TRUSTEE<br />
NAME, ADDRESS (1) , AGE,<br />
POSITIONS HELD WITH THE<br />
TRUST AND LENGTH OF<br />
SERVICE AS TRUSTEE (2)<br />
PRINCIPAL OCCUPATIONS DURING PAST FIVE YEARS<br />
OTHER DIRECTOR-SHIPS<br />
HELD BY TRUSTEE (3)<br />
NUMBER OF FUNDS<br />
OVERSEEN IN FUND<br />
COMPLEX (4)<br />
Stephen N. Potter (5)<br />
Age: 57<br />
Trustee of <strong>Northern</strong><br />
<strong>Funds</strong> since 2008<br />
• President, <strong>Northern</strong> Trust Asset Management since<br />
2008;<br />
• Chairman and President of <strong>Northern</strong> Trust<br />
Investments, Inc. since March 2008;<br />
• Executive Vice President of <strong>Northern</strong> Trust<br />
Corporation since October 2003;<br />
• President of <strong>Northern</strong> Trust Global Investments, Ltd.<br />
from March 2008 to February 2009;<br />
• Director of The <strong>Northern</strong> Trust Company of<br />
Connecticut from 2009 to 2013;<br />
• Director of <strong>Northern</strong> Trust Global Investments, Ltd.<br />
from February 2000 to February 2009;<br />
• Director of <strong>Northern</strong> Trust Global Advisors, Inc. from<br />
May 2008 to January 2012.<br />
• None 47<br />
(1) Mr. Potter may be contacted by writing to the Trustee, c/o Diana E. McCarthy, Drinker Biddle & Reath LLP, One Logan Square, Suite<br />
2000, Philadelphia, PA 19103-6996.<br />
(2) Each Trustee will hold office for an indefinite term until the earliest of: (i) the next meeting of shareholders, if any, called for the purpose<br />
of considering the election or re-election of such Trustee and until the election and qualification of his or her successor, if any, elected at<br />
such meeting; (ii) the date a Trustee resigns or retires, or a Trustee is removed by the Board of Trustees or shareholders, in accordance<br />
with the Trust’s Agreement and Declaration of Trust; or (iii) in accordance with the current resolutions of the Board of Trustees (which<br />
may be changed without shareholder vote) on the last day of the calendar year in which he or she attains the age of seventy-five years.<br />
(3) This column includes only directorships of companies required to report to the SEC under the Exchange Act (i.e., public companies) or<br />
other investment companies registered under the 1940 Act.<br />
(4) The <strong>Northern</strong> mutual funds complex consists of 56 portfolios — 48 portfolios of the Trust, including 9 portfolios of <strong>Northern</strong> Multi-<br />
Manager <strong>Funds</strong>, and 8 portfolios of <strong>Northern</strong> Institutional <strong>Funds</strong>. Mr. Potter oversees 47 portfolios in the complex — 39 portfolios of the<br />
Trust and 8 portfolios of <strong>Northern</strong> Institutional <strong>Funds</strong>.<br />
(5) An “interested person” as defined by the 1940 Act. Mr. Potter is deemed to be an “interested” Trustee because he is an officer, director,<br />
employee, and a shareholder of <strong>Northern</strong> Trust Corporation and/or its affiliates.<br />
NORTHERN FUNDS ANNUAL REPORT 137 EQUITY INDEX FUNDS
EQUITY INDEX FUNDS<br />
TRUSTEES AND OFFICERS continued<br />
OFFICERS OF THE TRUST (1)<br />
NAME, ADDRESS, AGE,<br />
POSITIONS HELD WITH TRUST<br />
AND LENGTH OF SERVICE<br />
Lloyd A. Wennlund<br />
Age: 56<br />
50 South LaSalle Street<br />
Chicago, Illinois 60603<br />
President since 2000<br />
Eric K. Schweitzer<br />
Age: 52<br />
50 South LaSalle Street<br />
Chicago, Illinois 60603<br />
Vice President since 2000<br />
Susan J. Hill<br />
Age: 57<br />
50 South LaSalle Street<br />
Chicago, Illinois 60603<br />
Chief Compliance Officer<br />
since 2004<br />
Darlene Chappell<br />
Age: 51<br />
50 South LaSalle Street<br />
Chicago, Illinois 60603<br />
Anti-Money Laundering<br />
Compliance Officer since 2009<br />
Randal Rein<br />
Age: 43<br />
50 South LaSalle Street<br />
Chicago, Illinois 60603<br />
Treasurer since 2008<br />
Michael Pryszcz<br />
Age: 46<br />
50 South LaSalle Street<br />
Chicago, Illinois 60603<br />
Assistant Treasurer since 2008<br />
Richard Crabill<br />
Age: 45<br />
50 South LaSalle Street<br />
Chicago, Illinois 60603<br />
Assistant Treasurer since 2008<br />
Michael Meehan<br />
Age: 43<br />
50 South LaSalle Street<br />
Chicago, Illinois 60603<br />
Assistant Treasurer since 2011<br />
PRINCIPAL OCCUPATIONS DURING PAST FIVE YEARS<br />
Executive Vice President since 2003 and Director since 2001 of NTI; Executive Vice President and other<br />
positions at TNTC and Managing Executive, Mutual <strong>Funds</strong> for <strong>Northern</strong> Trust Asset Management since 1994;<br />
Head of Defined Contribution Business at TNTC since 2011; Director, NT Global Advisors, Inc. from 2006 to<br />
2012; Director, The <strong>Northern</strong> Trust Company of Connecticut from 2012 to 2013; President and Director of<br />
<strong>Northern</strong> Trust Securities, Inc. from 1997 to 2009.<br />
Senior Vice President at NTI since 2001; Senior Vice President at TNTC since 2000; Director; NT Global<br />
Advisors, Inc. since 2012.<br />
Chief Compliance Officer of The <strong>Northern</strong> Trust Company of Connecticut from 2007 to 2013; Chief<br />
Compliance Officer of <strong>Northern</strong> Trust Global Advisors, Inc. from 2007 to 2011; Chief Compliance Officer of<br />
NTI from 2005 to 2013; Senior Vice President of NTI since 2005.<br />
Anti-Money Laundering Compliance Officer for NTI, <strong>Northern</strong> Trust Securities, Inc. and NT Alpha Strategies<br />
Fund since 2009; Anti-Money Laundering Compliance Officer for NT <strong>Equity</strong> Long/Short Strategies Fund and<br />
FlexShares Trust since 2011; Vice President and Compliance Consultant for TNTC since 2006; Anti-Money<br />
Laundering Compliance Officer for The <strong>Northern</strong> Trust Company of Connecticut from 2009 to 2013.<br />
Senior Vice President of NTI since 2010 and Senior Vice President of Fund Administration of TNTC through<br />
2010; Vice President of Fund Administration of TNTC from 2007 to 2010; Second Vice President of Fund<br />
Administration of TNTC from 2002 to 2007.<br />
Senior Vice President of Fund Accounting of TNTC since 2010; Vice President of Fund Accounting of TNTC<br />
from 2005 to 2010; Second Vice President of Fund Accounting of TNTC from 2000 to 2005.<br />
Senior Vice President of Fund Administration of TNTC since 2011; Vice President of Fund Administration of<br />
TNTC from 2005 to 2011.<br />
Vice President of NTI since 2011; Vice President of Fund Administration of TNTC from 2009 to 2011; Second<br />
Vice President of Fund Administration of TNTC from 2008 to 2009.<br />
EQUITY INDEX FUNDS 138 NORTHERN FUNDS ANNUAL REPORT
EQUITY INDEX FUNDS<br />
MARCH 31, 2014 (UNAUDITED)<br />
OFFICERS OF THE TRUST (1)<br />
NAME, ADDRESS, AGE,<br />
POSITIONS HELD WITH TRUST<br />
AND LENGTH OF SERVICE<br />
Gregory A. Chidsey<br />
Age: 45<br />
50 South LaSalle Street<br />
Chicago, Illinois 60603<br />
Assistant Treasurer since 2013<br />
Craig R. Carberry, Esq.<br />
Age: 53<br />
50 South LaSalle Street<br />
Chicago, Illinois 60603<br />
Secretary since 2010<br />
Owen T. Meacham, Esq.<br />
Age: 43<br />
50 South LaSalle Street<br />
Chicago, Illinois 60603<br />
Assistant Secretary since 2008<br />
Jose J. Del Real, Esq.<br />
Age: 36<br />
50 South LaSalle Street<br />
Chicago, Illinois 60603<br />
Assistant Secretary since 2011<br />
PRINCIPAL OCCUPATIONS DURING PAST FIVE YEARS<br />
Senior Vice President of Financial <strong>Report</strong>ing of TNTC since 2010; Senior Manager and Assistant Treasurer for<br />
the Van Kampen <strong>Funds</strong> from 2007 to 2010; Vice President in Fund Administration of TNTC from 2004 to 2007.<br />
Senior Legal Counsel and U.S. <strong>Funds</strong> General Counsel at TNTC since May 2000; Secretary of NTI since 2000;<br />
Secretary of NT Alpha Strategies Fund since 2004; Secretary of <strong>Northern</strong> Trust Global Advisors, Inc. from 2007<br />
to 2012; Secretary of The <strong>Northern</strong> Trust Company of Connecticut from 2009 to 2013; Secretary of NT <strong>Equity</strong><br />
Long/Short Strategies Fund and FlexShares Trust since 2011; Secretary of NETS Trust from 2008 to 2009.<br />
Senior Vice President and Regulatory Administration Senior Attorney of TNTC since 2011; Vice President and<br />
Regulatory Administration Senior Attorney of TNTC from 2007 to 2011; Secretary of Harding, Loevner <strong>Funds</strong><br />
since 2010; Assistant Secretary of Ashmore <strong>Funds</strong> since 2010.<br />
Vice President and Regulatory Administration Senior Attorney of TNTC since 2012; Vice President and<br />
Regulatory Administration Attorney of TNTC from 2011 to 2012; Second Vice President and Regulatory<br />
Administration Attorney of TNTC from 2010 to 2011; Associate Attorney in the Investment Services Group at<br />
the law firm of Vedder Price, P.C. from 2006 to 2010.<br />
(1) Each Officer serves until his or her resignation, removal, retirement or election of his or her successor.<br />
NORTHERN FUNDS ANNUAL REPORT 139 EQUITY INDEX FUNDS
EQUITY INDEX FUNDS<br />
APPROVAL OF MANAGEMENT AGREEMENT<br />
The Board of Trustees of <strong>Northern</strong> <strong>Funds</strong> (“NF Trustees”) oversees<br />
and reviews the investment performance and expenses of<br />
<strong>Northern</strong> <strong>Funds</strong> at regularly scheduled meetings held during the<br />
<strong>Funds</strong>’ fiscal year.<br />
The NF Trustees, including a majority of the Trustees who are<br />
not parties to the Proposed Management Agreement (“NF<br />
Management Agreement”) or “interested persons” (as defined by<br />
the 1940 Act) of any party thereto (the “NF Independent<br />
Trustees”) voting separately, approved the Proposed Management<br />
Agreement for the Emerging Markets <strong>Equity</strong> <strong>Index</strong> Fund,<br />
Global Real Estate <strong>Index</strong> Fund, Global Sustainability <strong>Index</strong> Fund,<br />
International <strong>Equity</strong> <strong>Index</strong> Fund, Mid Cap <strong>Index</strong> Fund, Small<br />
Cap <strong>Index</strong> Fund and Stock <strong>Index</strong> Fund (the “<strong>Funds</strong>”) on February<br />
14, 2014. The foregoing meeting is referred to below as the<br />
“NF Contract Meeting.”<br />
The NF Trustees received written materials and verbal presentations<br />
relating to the NF Management Agreement in<br />
preparation for their consideration of the Agreement, including<br />
reports from the Board’s Governance Committee, which<br />
reviewed certain information pertinent to the NF Management<br />
Agreement at its meeting. At the NF Contract Meeting, the NF<br />
Board considered the applicable reports and presentations and<br />
discussed the information that had been provided. In connection<br />
with their deliberations, the NF Independent Trustees met separately<br />
with and were advised by their independent legal counsel<br />
regarding their responsibilities under applicable law. They also<br />
met in executive sessions at the NF Contract Meeting without<br />
employees of NTI present.<br />
In evaluating the NF Management Agreement at the NF Contract<br />
Meeting, the NF Trustees relied upon their knowledge, resulting<br />
from their meetings and other interactions throughout the year<br />
and past years, of NTI, its services and the <strong>Funds</strong>. The NF Trustees<br />
received materials relating to NTI’s investment management<br />
services both in meetings specifically dedicated to the review of<br />
the NF Management Agreement and in other meetings held<br />
during the year. These materials included: (i) information on the<br />
investment performance of the <strong>Funds</strong> in comparison to other<br />
mutual funds and benchmark indices; (ii) compliance reports;<br />
(iii) information about NTI’s and its affiliates’ risk management<br />
processes; (iv) fees charged to and expenses borne by the <strong>Funds</strong>;<br />
(v) NTI’s profitability and costs; (vi) the qualifications of NTI<br />
and its affiliates to provide services to the <strong>Funds</strong>; and<br />
(vii) policies adopted by NTI regarding brokerage, including soft<br />
dollars, trade allocations and other matters.<br />
The NF Trustees reviewed, among other things, information<br />
specifically relating to: (i) the terms of the NF Management<br />
Agreement; (ii) the <strong>Funds</strong>’ investment performance over different<br />
time periods in comparison to the investment performance<br />
of mutual fund peer groups and categories selected by Lipper Inc.<br />
(“Lipper”), a third-party provider of mutual fund data; (iii) the<br />
contractual Management Fees and the <strong>Funds</strong>’ total expenses<br />
(after reimbursements) borne by the <strong>Funds</strong> in comparison to<br />
those borne by mutual fund peer groups and categories selected<br />
by Lipper; (iv) the Management Fees charged to the <strong>Funds</strong><br />
compared to the management fees charged by NTI to NTI’s<br />
other comparable institutional accounts; (v) NTI’s staffing for<br />
the <strong>Funds</strong> and the experience of the portfolio managers and<br />
other personnel; (vi) NTI’s financial resources and its ability to<br />
attract and retain portfolio management talent; (vii) NTI’s<br />
investments in technology to benefit the <strong>Funds</strong>; (viii) the fees<br />
paid by the <strong>Funds</strong> to NTI and its affiliates for services, and the<br />
expenses incurred by them in connection with the provision of<br />
those services; and (ix) the benefits received by NTI and its affiliates<br />
from their relationships with the <strong>Funds</strong>. In evaluating the NF<br />
Management Agreement for each of the <strong>Funds</strong>, the NF Trustees<br />
gave weight to various factors, but did not identify any single<br />
factor as controlling their decision.<br />
Nature, Quality and Extent of Services<br />
The NF Trustees considered, as part of their review, the nature,<br />
quality and extent of the services provided by NTI. In this regard,<br />
they considered both the investment advisory services, and the<br />
administrative and other non-advisory services that are provided<br />
to the <strong>Funds</strong> by NTI and its affiliates. These services include acting<br />
as the <strong>Funds</strong>’ administrator, custodian and transfer agent.<br />
The Trustees considered the quality of NTI’s communications<br />
with and services to shareholders, as well as the expenditures<br />
made by NTI and its affiliates to improve the quality and scope of<br />
their services to the <strong>Funds</strong>. They noted NTI’s enhancements to<br />
the pricing and fund accounting systems made during the year<br />
and other investments in technology. The NF Trustees also considered<br />
the strength of NTI’s and its affiliates’ risk management<br />
processes, NTI’s compliance oversight program with respect to<br />
all of the <strong>Funds</strong>’ service providers and the continued active<br />
involvement of internal audit in reviewing operations related to<br />
the <strong>Funds</strong>. In addition, they noted NTI’s and its affiliates’ strong<br />
financial position, stability and willingness to support the <strong>Funds</strong>.<br />
The NF Trustees also considered the consistency of NTI personnel<br />
and investment approach with respect to the <strong>Funds</strong>. The NF<br />
Trustees concluded that NTI was able to commit, and had<br />
committed, substantial financial and other resources to the<br />
operations of the <strong>Funds</strong> and was able to provide quality services<br />
to the <strong>Funds</strong>.<br />
Performance<br />
The NF Trustees considered the investment performance of the<br />
<strong>Funds</strong>. They first considered whether the <strong>Funds</strong> had operated<br />
within their respective investment objectives, as well as their<br />
compliance with their investment restrictions. For <strong>Funds</strong> that<br />
EQUITY INDEX FUNDS 140 NORTHERN FUNDS ANNUAL REPORT
EQUITY INDEX FUNDS<br />
MARCH 31, 2014 (UNAUDITED)<br />
had been in existence for the applicable periods, the NF Trustees<br />
received information on their investment performance for one,<br />
three, five and ten years, as applicable, as well as performance for<br />
the most recent quarter and year-to-date. The NF Trustees<br />
compared the investment performance of the <strong>Funds</strong> to the performance<br />
of other Securities and Exchange Commission (“SEC”)<br />
registered funds and to rankings issued by Lipper. The NF Trustees<br />
also reviewed the <strong>Funds</strong>’ investment performance relative to<br />
their respective performance benchmarks. The NF Trustees concluded<br />
based on the information received, that the <strong>Funds</strong>’ performance<br />
was satisfactory for most <strong>Funds</strong>, and that NTI was<br />
taking steps to address any under-performing <strong>Funds</strong>.<br />
Fees, Profitability and Costs<br />
The NF Trustees also evaluated the <strong>Funds</strong>’ contractual Management<br />
Fee rates; the <strong>Funds</strong>’ total operating expense ratios; NTI’s<br />
contractual commitments to continue expense reimbursements<br />
for at least one year with respect to the <strong>Funds</strong>; and whether a<br />
consistent methodology was in place in determining the fees and<br />
expenses of the <strong>Funds</strong>. In this regard, the NF Trustees considered<br />
that the proposed Management Fees for the <strong>Funds</strong> would be, in<br />
all cases, lower than the current combined contractual advisory<br />
and administration fees, and that total annual fund operating<br />
expenses before expense reimbursements would also be lower,<br />
although net expenses paid by the shareholders would be the<br />
same as under the current advisory and administration agreements.<br />
The NF Trustees also considered that, for those <strong>Funds</strong><br />
that were sweeping uninvested cash into an NTI affiliated money<br />
market fund, NTI was in each case rebating back to the investing<br />
<strong>Funds</strong> all of the advisory fees that were not waived by NTI of the<br />
applicable money market fund in compliance with the <strong>Northern</strong><br />
<strong>Funds</strong>’ exemptive order.<br />
The NF Trustees reviewed information on the proposed Management<br />
Fee rates under the NF Management Agreement and the<br />
<strong>Funds</strong>’ total operating expense ratios compared to similar<br />
information for mutual funds advised by unaffiliated investment<br />
management firms. The comparisons of the <strong>Funds</strong>’ Management<br />
Fee rates and total operating expense ratios were prepared by<br />
Lipper. The NF Trustees considered that each of the <strong>Funds</strong>’ total<br />
operating expense ratios after reimbursement of expenses was<br />
below its respective Lipper peer objective median.<br />
The NF Trustees also reviewed information comparing the<br />
Fund’s proposed Management Fee rates to the fee rates charged<br />
by NTI to similarly managed, private institutional accounts. They<br />
noted that there were not applicable comparisons for each Fund.<br />
For <strong>Funds</strong> where there were applicable comparisons, the NF<br />
Trustees considered the differences in, and level of complexity of,<br />
services provided by NTI with regard to the private institutional<br />
accounts, as well as regulatory, operational and compliance<br />
differences, board and committee support and other differences.<br />
These comparisons assisted the NF Trustees in evaluating the<br />
reasonableness of the investment advisory fees paid by the <strong>Funds</strong>.<br />
In addition, the NF Trustees considered the amount of assets in<br />
the <strong>Funds</strong>; the information provided by NTI relating to the costs<br />
of the services provided by it and its affiliates; and the profits<br />
realized by them through their relationship on a Fund-by-Fund<br />
basis. The NF Trustees reviewed NTI’s assumptions and<br />
methodology for allocating costs to each Fund, recognizing that<br />
cost allocation methodologies are inherently subjective and not<br />
audited. The NF Trustees reviewed information with respect to<br />
NTI’s profitability compared to other publicly-traded advisers.<br />
They considered that comparisons of management agreement<br />
profitability across fund families are difficult because of numerous<br />
factors, including the type of funds managed, business mix,<br />
cost allocation methodologies and other factors. The NF Trustees<br />
concluded that NTI’s profitability was not unreasonable based on<br />
the services and benefits provided and the costs assumed by NTI.<br />
Economies of Scale<br />
The NF Trustees considered whether NTI had passed, and was<br />
likely to continue to pass, benefits from its economies of scale to<br />
shareholders. In this regard, the NF Trustees considered NTI’s<br />
view that the <strong>Funds</strong> may be sharing in economies of scale<br />
through the level at which the <strong>Funds</strong>’ Management Fees are set<br />
and through NTI’s contractual expense reimbursements that<br />
limit the expenses for the <strong>Funds</strong> to specific levels.<br />
Other Benefits to NTI<br />
The NF Trustees also reviewed other benefits accruing to NTI<br />
and its affiliates as a result of their relationship with the <strong>Funds</strong>.<br />
Those benefits included fees received by the affiliates for transfer<br />
agency, custodial and administrative functions. The Trustees also<br />
considered that many of the <strong>Funds</strong>’ shareholders had other client<br />
relationships with The <strong>Northern</strong> Trust Company. In addition,<br />
the NF Trustees considered that the scale of the <strong>Funds</strong> provided<br />
opportunities to NTI to obtain securities trading advantages for<br />
its other advisory clients. The NF Trustees also considered the<br />
extent to which NTI and its other clients, as well as the <strong>Funds</strong>,<br />
benefited from receipt of the research products and services<br />
generated by the <strong>Funds</strong>’ equity investment portfolios.<br />
After deliberation, the NF Trustees concluded at the NF Contract<br />
Meeting with respect to all of the <strong>Funds</strong> that the Management<br />
Fees to be paid by the <strong>Funds</strong> were reasonable in light of the services<br />
provided by NTI, its costs and the <strong>Funds</strong>’ asset levels, and<br />
that the NF Management Agreement should be approved.<br />
NORTHERN FUNDS ANNUAL REPORT 141 EQUITY INDEX FUNDS
EQUITY INDEX FUNDS<br />
THIS PAGE INTENTIONALLY LEFT BLANK<br />
EQUITY INDEX FUNDS 142 NORTHERN FUNDS ANNUAL REPORT
EQUITY INDEX FUNDS<br />
INVESTMENT CONSIDERATIONS<br />
EQUITY INDEX FUNDS<br />
EMERGING MARKETS EQUITY<br />
INDEX FUND 1,2,3,8<br />
GLOBAL REAL ESTATE INDEX FUND 2,3,5,8<br />
GLOBAL SUSTAINABILITY INDEX<br />
FUND 2,3,7,8<br />
INTERNATIONAL EQUITY INDEX FUND 2,3,8<br />
MID CAP INDEX FUND 2,4,8<br />
SMALL CAP INDEX FUND 2,6,8<br />
STOCK INDEX FUND 2,8<br />
1 Emerging Markets Risk: Markets of emerging market countries are less<br />
developed and less liquid, subject to greater price volatility and generally subject to<br />
increased economic, political, regulatory and other uncertainties than more<br />
developed markets.<br />
2 <strong>Equity</strong> Market Risk: The value of equity securities owned by the Fund may<br />
decline, at times sharply and unpredictably, because of economic changes or other<br />
events that affect individual issuers or large portions of the market.<br />
3 Foreign Securities Risk: Investing in foreign (non-U.S.) securities may result in the<br />
Fund experiencing more rapid and extreme changes in value than a fund that<br />
invests exclusively in securities of U.S. companies.<br />
4 Mid Cap Risk: The stocks of mid-sized companies may be subject to more abrupt<br />
or erratic market movements than stocks of larger, more established companies.<br />
5 REIT/Real Estate Risk: Investments in real estate companies will make the Fund<br />
more susceptible to risks associated with the ownership of real estate and with the<br />
real estate industry in general, including lower trading volumes and more abrupt or<br />
erratic price movements than the overall securities markets. Investing in REITs<br />
involves certain unique risks in addition to those risks associated with investing in the<br />
real estate industry in general.<br />
6 Small Cap Risk: The stocks of smaller companies may be subject to more abrupt,<br />
erratic market movements than stocks of larger, more established companies. Small<br />
companies may have limited product lines or financial resources, or may be<br />
dependent on a small or inexperienced management group, and their securities<br />
may trade less frequently and in lower volume than the securities of larger<br />
companies, which could lead to higher transaction costs. Generally, the smaller the<br />
company size, the greater the risk.<br />
7 Socially Responsible Investment Risk: The socially responsible investment<br />
policies of the Fund’s index may restrict the investments available to the Fund. This<br />
could cause the Fund to underperform similar funds that do not have a social<br />
responsibility objective.<br />
8 Tracking Risk: The Fund’s performance may vary substantially from the<br />
performance of the benchmark index it tracks as a result of share purchases and<br />
redemptions, transaction costs, expenses and other factors.<br />
NORTHERN FUNDS ANNUAL REPORT 143 EQUITY INDEX FUNDS
EQUITY INDEX FUNDS<br />
FOR MORE INFORMATION<br />
PORTFOLIO HOLDINGS<br />
<strong>Northern</strong> <strong>Funds</strong> files its complete schedule of portfolio holdings<br />
with the Securities and Exchange Commission (“SEC”) for the<br />
first and third quarters of each fiscal year on Form N-Q. The<br />
<strong>Funds</strong>’ Forms N-Q are available on the SEC’s Web site at sec.gov.<br />
You may also review and obtain copies at the SEC’s Public<br />
Reference Room in Washington, D.C. Information about the<br />
Public Reference Room may be obtained by calling<br />
800-SEC-0330.<br />
PROXY VOTING<br />
<strong>Northern</strong> <strong>Funds</strong>’ Proxy Voting Policies and Procedures and each<br />
Fund’s portfolio securities voting record for the 12-month period<br />
ended June 30 are available upon request and without charge by<br />
visiting <strong>Northern</strong> <strong>Funds</strong>’ Web site at northernfunds.com or the<br />
SEC’s Web site at sec.gov or by calling the <strong>Northern</strong> <strong>Funds</strong> Center<br />
at 800-595-9111.<br />
EQUITY INDEX FUNDS 144 NORTHERN FUNDS ANNUAL REPORT
When building a sound <strong>Northern</strong> <strong>Funds</strong> investment strategy,<br />
you’ll want to select a mix of equity, fixed income and money<br />
market funds that have return potential and an acceptable<br />
level of risk. Please carefully read the prospectus and summary<br />
prospectus and consider the investment objectives, risks,<br />
charges and expenses of <strong>Northern</strong> <strong>Funds</strong> before investing.<br />
Visit northernfunds.com or call 800-595-9111 to obtain<br />
a prospectus and summary prospectus. The prospectus<br />
and summary prospectus contain this and other information<br />
about the funds.<br />
PROTECTING YOUR PRIVACY<br />
Protecting your privacy is important at <strong>Northern</strong> <strong>Funds</strong>, which<br />
is why we wanted you to know:<br />
We do not sell non-public personal information about our<br />
investors or former investors to any outside company.<br />
We have policies that limit access to your information to<br />
only those people who need it to perform their jobs and<br />
provide services to you, and we have physical, electronic<br />
and procedural safeguards that comply with federal<br />
standards to guard your personal information.<br />
We collect information about you from applications, forms,<br />
conversations and your use of our Web site; third parties<br />
with your permission; and your transactions with us, our<br />
affiliates and our joint marketing partners.<br />
We do not disclose the information we collect about<br />
our investors or former investors to anyone, except to<br />
companies that perform services for us, affiliates with<br />
whom we have joint marketing agreements such as<br />
<strong>Northern</strong> Trust, (1) for our everyday purposes, such as<br />
to process transactions, maintain accounts, respond to<br />
court orders and legal investigations or report to credit<br />
bureaus or (2) as permitted by law.<br />
The information includes account balances and account<br />
history. You may limit our use or sharing of information<br />
about you with our affiliates and joint marketing partners<br />
for marketing purposes by calling 800-595-9111<br />
weekdays from 7:00 a.m. to 7:00 p.m. Central time or<br />
by writing to us at <strong>Northern</strong> <strong>Funds</strong>, P.O. Box 75986,<br />
Chicago, IL 60675-5986.<br />
If our information sharing practices change, we will send<br />
you a revised notice. You can also visit our Web site,<br />
northernfunds.com, for an online version of our current<br />
privacy notice.<br />
SHAREHOLDER COMMUNICATIONS<br />
In order to help reduce expenses and reduce the amount of<br />
mail that you receive, we generally send a single copy of all<br />
materials, including prospectuses, financial reports, proxy<br />
statements and information statements to all investors who<br />
share the same mailing address, even if more than one person<br />
in a household holds shares of a fund.<br />
If you do not want your mailings combined with those of other<br />
members of your household, you may opt-out at any time by<br />
contacting the <strong>Northern</strong> <strong>Funds</strong> Center either by telephone at<br />
800-595-9111; by mail at <strong>Northern</strong> <strong>Funds</strong>, P.O. Box 75986,<br />
Chicago, Illinois 60675-5986; or by sending an e-mail to<br />
northern-funds@ntrs.com.<br />
Not part of the <strong>Annual</strong> <strong>Report</strong><br />
HIGHER<br />
RISK/<br />
REWARD<br />
LOWER<br />
RISK/<br />
REWARD<br />
GROWTH<br />
INCOME<br />
LIQUIDITY<br />
NORTHERN<br />
FAMILY OF FUNDS<br />
RISK/REWARD POTENTIAL<br />
EQUITY FUNDS<br />
INTERNATIONAL EQUITIES & SECTOR FUNDS<br />
Multi-Manager Emerging Markets <strong>Equity</strong><br />
Emerging Markets <strong>Equity</strong> <strong>Index</strong><br />
Technology<br />
Multi-Manager Global Real Estate<br />
Global Real Estate <strong>Index</strong><br />
Multi-Manager Global Listed Infrastructure<br />
International <strong>Equity</strong><br />
Multi-Manager International <strong>Equity</strong><br />
International <strong>Equity</strong> <strong>Index</strong><br />
Global Sustainability <strong>Index</strong><br />
SMALL- & MEDIUM-CAP EQUITY FUNDS<br />
Small Cap Value<br />
Small Cap Core<br />
Multi-Manager Small Cap<br />
Small Cap <strong>Index</strong><br />
Multi-Manager Mid Cap<br />
Mid Cap <strong>Index</strong><br />
INCOME & LARGE-CAP EQUITY FUNDS<br />
Large Cap Growth<br />
Large Cap <strong>Equity</strong><br />
Large Cap Value<br />
Multi-Manager Large Cap<br />
Large Cap Core<br />
Stock <strong>Index</strong><br />
Income <strong>Equity</strong><br />
ASSET ALLOCATION FUND<br />
Global Tactical Asset Allocation<br />
FIXED INCOME FUNDS<br />
LONGER-TERM & HIGH YIELD BOND FUNDS<br />
Multi-Manager Emerging Markets Debt Opportunity<br />
Multi-Manager High Yield Opportunity<br />
High Yield Fixed Income<br />
High Yield Municipal<br />
California Tax-Exempt<br />
Arizona Tax-Exempt<br />
Tax-Exempt<br />
U.S. Treasury <strong>Index</strong><br />
SHORT & INTERMEDIATE-TERM BOND FUNDS<br />
Fixed Income<br />
Bond <strong>Index</strong><br />
Core Bond<br />
California Intermediate Tax-Exempt<br />
Intermediate Tax-Exempt<br />
Short-Intermediate Tax-Exempt<br />
U.S. Government<br />
Short Bond<br />
Short-Intermediate U.S. Government<br />
Ultra-Short Fixed Income<br />
Tax-Advantaged Ultra-Short Fixed Income<br />
MONEY MARKET FUNDS<br />
MONEY MARKET FUNDS<br />
California Municipal Money Market<br />
Municipal Money Market<br />
Money Market<br />
U.S. Government Select Money Market<br />
U.S. Government Money Market<br />
An investment in the Money Market <strong>Funds</strong> is not insured or guaranteed<br />
by the FDIC or any other governmental agency. Although the <strong>Funds</strong><br />
seek to maintain a value of $1.00 per share, it is possible to lose money.
PRESORTED<br />
STANDARD<br />
U.S. POSTAGE<br />
PAID<br />
FARMINGDALE, NY<br />
PERMIT NO. 225<br />
e<br />
SIGN UP FOR E-DELIVERY<br />
To get future shareholder reports<br />
online and to eliminate mailings,<br />
go to: northernfunds.com/e-delivery<br />
©2014 <strong>Northern</strong> <strong>Funds</strong><br />
INDX ANR (5/14)