Vanguard Mid-Cap Value ETF Fact Sheet - Bright Directions
Vanguard Mid-Cap Value ETF Fact Sheet - Bright Directions
Vanguard Mid-Cap Value ETF Fact Sheet - Bright Directions

You also want an ePaper? Increase the reach of your titles
YUMPU automatically turns print PDFs into web optimized ePapers that Google loves.
<strong>Vanguard</strong> <strong>Mid</strong>-<strong>Cap</strong> <strong>Value</strong> <strong>ETF</strong><br />
As of December 31, 2014<br />
VOE<br />
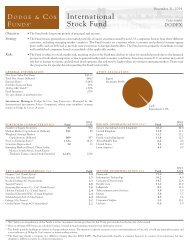
Expense ratio comparison 1<br />
1.30%<br />
<strong>Mid</strong>-<strong>Cap</strong> <strong>Value</strong><br />
Funds<br />
Average<br />
0.34%<br />
<strong>Mid</strong>-<strong>Cap</strong><br />
<strong>Value</strong> <strong>ETF</strong>s<br />
Average<br />
0.09%<br />
<strong>Mid</strong>-<strong>Cap</strong><br />
<strong>Value</strong> <strong>ETF</strong><br />
<strong>ETF</strong> attributes<br />
<strong>Mid</strong>-<strong>Cap</strong> <strong>Value</strong><br />
<strong>ETF</strong><br />
CRSP US <strong>Mid</strong><br />
<strong>Cap</strong> <strong>Value</strong> Index<br />
Number of stocks 205 205<br />
Median market cap $10.2B $10.2B<br />
Price/earnings ratio 21.0x 20.8x<br />
Price/book ratio 2.0x 2.1x<br />
Return on equity 14.1% 13.4%<br />
Earnings growth rate 9.7% 9.7%<br />
Foreign holdings 0.8% 0.0%<br />
Turnover rate 2 14.2% —<br />
Standard deviation 3 10.0% 10.0%<br />
Talk with your advisor<br />
to learn more about<br />
<strong>Vanguard</strong> <strong>ETF</strong>s® ,the<br />
low-cost exchangetraded<br />
funds driven by<br />
<strong>Vanguard</strong>'s leading<br />
indexing expertise.<br />
Ten largest holdings and % of total net assets 4<br />
United Continental Holdings Inc. 1.5%<br />
Delphi Automotive plc 1.3<br />
Mylan Inc. 1.3<br />
Seagate Technology plc 1.2<br />
AmerisourceBergen Corp. 1.1<br />
Alcoa Inc. 1.1<br />
Hartford Financial Services Group Inc. 1.1<br />
Fidelity National Information Services Inc. 1.1<br />
Boston Scientific Corp. 1.1<br />
Northeast Utilities 1.0<br />
Top ten as % of total net assets 11.8%<br />
Top 10 sector diversification as % of common stock 5<br />
Financials 23.9%<br />
Consumer Goods 16.2<br />
Industrials 11.6<br />
Consumer Services 10.1<br />
Utilities 10.0<br />
Health Care 8.0<br />
Basic Materials 7.2<br />
Technology 6.8<br />
Oil & Gas 5.5<br />
Telecommunications 0.7<br />
1 Represents the expense ratio for the <strong>Vanguard</strong> <strong>ETF</strong> as reported in the most recent prospectus. There are material differences between mutual funds and <strong>ETF</strong>s.<br />
Unlike mutual funds, <strong>ETF</strong>s are priced continuously and bought and sold throughout the day in the secondary market (at a premium or discount to net asset value)<br />
with the assistance of a stockbroker, which entails paying commissions. Sources: Lipper, a Thomson Reuters Company, and <strong>Vanguard</strong>, December 31, 2013.<br />
2 For most recent fiscal year. Turnover rate excludes the value of portfolio securities received or delivered as a result of in-kind purchases or redemptions of the<br />
fund’s capital shares, including <strong>Vanguard</strong> <strong>ETF</strong> Creation Units.<br />
3 A measure of the volatility of a fund—based on the fund’s last three years of monthly returns—used to indicate the dispersion of past returns. A higher standard<br />
deviation means a greater potential for volatility. For funds with less than 36 months of performance history, standard deviation is not calculated.<br />
4 The holdings listed exclude any temporary cash investments and equity index products.<br />
5 Sector categories are based on the Industry Classification Benchmark system.<br />
<strong>Vanguard</strong> <strong>ETF</strong> Shares are not redeemable with the issuing Fund other than in very large aggregations worth millions of dollars. Instead, investors must buy or sell<br />
<strong>Vanguard</strong> <strong>ETF</strong> Shares in the secondary market and hold those shares in a brokerage account. In doing so, the investor may incur brokerage commissions and may<br />
pay more than net asset value when buying and receive less than net asset value when selling.<br />
All <strong>ETF</strong> products are subject to risk, which may result in the loss of principal. Prices of mid-cap <strong>ETF</strong> products often fluctuate more than those of large-cap <strong>ETF</strong><br />
products.<br />
For more information about <strong>Vanguard</strong> <strong>ETF</strong> Shares, visit vanguard.com, call 866-499-8473, or contact your broker to obtain a prospectus. Investment<br />
objectives, risks, charges, expenses, and other important information are contained in the prospectus; read and consider it carefully before investing.<br />
© 2015 The <strong>Vanguard</strong> Group, Inc. All rights reserved. U.S. Patent Nos. 6,879,964; 7,337,138; 7,720,749; 7,925,573; 8,090,646; 8,417,623.<br />
<strong>Vanguard</strong> Marketing Corporation, Distributor.<br />
FA0935_1214