Vanguard Mid-Cap Value ETF Fact Sheet - Bright Directions
Vanguard Mid-Cap Value ETF Fact Sheet - Bright Directions
Vanguard Mid-Cap Value ETF Fact Sheet - Bright Directions

Create successful ePaper yourself
Turn your PDF publications into a flip-book with our unique Google optimized e-Paper software.
<strong>Vanguard</strong> <strong>Mid</strong>-<strong>Cap</strong> <strong>Value</strong> <strong>ETF</strong><br />
VOE<br />
As of December 31, 2014<br />
Investment approach<br />
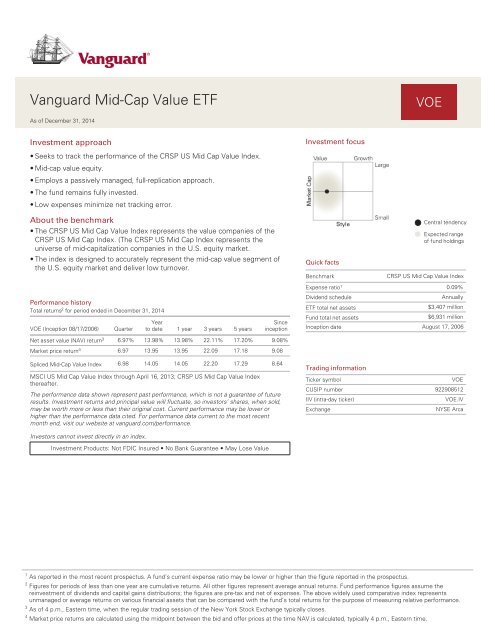
Investment focus<br />
• Seeks to track the performance of the CRSP US <strong>Mid</strong> <strong>Cap</strong> <strong>Value</strong> Index.<br />
• <strong>Mid</strong>-cap value equity.<br />
• Employs a passively managed, full-replication approach.<br />
• The fund remains fully invested.<br />
• Low expenses minimize net tracking error.<br />
About the benchmark<br />
• The CRSP US <strong>Mid</strong> <strong>Cap</strong> <strong>Value</strong> Index represents the value companies of the<br />
CRSP US <strong>Mid</strong> <strong>Cap</strong> Index. (The CRSP US <strong>Mid</strong> <strong>Cap</strong> Index represents the<br />
universe of mid-capitalization companies in the U.S. equity market.<br />
• The index is designed to accurately represent the mid-cap value segment of<br />
the U.S. equity market and deliver low turnover.<br />
Quick facts<br />
Benchmark<br />
Central tendency<br />
Expected range<br />
of fund holdings<br />
CRSP US <strong>Mid</strong> <strong>Cap</strong> <strong>Value</strong> Index<br />
Performance history<br />
Total returns 2 for period ended in December 31, 2014<br />
VOE (Inception 08/17/2006)<br />
Quarter<br />
Year<br />
to date 1 year 3 years 5 years<br />
Since<br />
inception<br />
Expense ratio 1 0.09%<br />
Dividend schedule<br />
Annually<br />
<strong>ETF</strong> total net assets<br />
$3,407 million<br />
Fund total net assets<br />
$6,931 million<br />
Inception date August 17, 2006<br />
Net asset value (NAV) return 3 6.97% 13.98% 13.98% 22.11% 17.20% 9.08%<br />
Market price return 4 6.97 13.95 13.95 22.09 17.18 9.08<br />
Spliced <strong>Mid</strong>-<strong>Cap</strong> <strong>Value</strong> Index 6.98 14.05 14.05 22.20 17.29 8.64<br />
MSCI US <strong>Mid</strong> <strong>Cap</strong> <strong>Value</strong> Index through April 16, 2013; CRSP US <strong>Mid</strong> <strong>Cap</strong> <strong>Value</strong> Index<br />
thereafter.<br />
The performance data shown represent past performance, which is not a guarantee of future<br />
results. Investment returns and principal value will fluctuate, so investors’ shares, when sold,<br />
may be worth more or less than their original cost. Current performance may be lower or<br />
higher than the performance data cited. For performance data current to the most recent<br />
month end, visit our website at vanguard.com/performance.<br />
Trading information<br />
Ticker symbol<br />
VOE<br />
CUSIP number 922908512<br />
IIV (intra-day ticker)<br />
VOE.IV<br />
Exchange<br />
NYSE Arca<br />
Investors cannot invest directly in an index.<br />
Investment Products: Not FDIC Insured • No Bank Guarantee • May Lose <strong>Value</strong><br />
1 As reported in the most recent prospectus. A fund’s current expense ratio may be lower or higher than the figure reported in the prospectus.<br />
2 Figures for periods of less than one year are cumulative returns. All other figures represent average annual returns. Fund performance figures assume the<br />
reinvestment of dividends and capital gains distributions; the figures are pre-tax and net of expenses. The above widely used comparative index represents<br />
unmanaged or average returns on various financial assets that can be compared with the fund’s total returns for the purpose of measuring relative performance.<br />
3 As of 4 p.m., Eastern time, when the regular trading session of the New York Stock Exchange typically closes.<br />
4 Market price returns are calculated using the midpoint between the bid and offer prices at the time NAV is calculated, typically 4 p.m., Eastern time.
<strong>Vanguard</strong> <strong>Mid</strong>-<strong>Cap</strong> <strong>Value</strong> <strong>ETF</strong><br />
As of December 31, 2014<br />
VOE<br />
Expense ratio comparison 1<br />
1.30%<br />
<strong>Mid</strong>-<strong>Cap</strong> <strong>Value</strong><br />
Funds<br />
Average<br />
0.34%<br />
<strong>Mid</strong>-<strong>Cap</strong><br />
<strong>Value</strong> <strong>ETF</strong>s<br />
Average<br />
0.09%<br />
<strong>Mid</strong>-<strong>Cap</strong><br />
<strong>Value</strong> <strong>ETF</strong><br />
<strong>ETF</strong> attributes<br />
<strong>Mid</strong>-<strong>Cap</strong> <strong>Value</strong><br />
<strong>ETF</strong><br />
CRSP US <strong>Mid</strong><br />
<strong>Cap</strong> <strong>Value</strong> Index<br />
Number of stocks 205 205<br />
Median market cap $10.2B $10.2B<br />
Price/earnings ratio 21.0x 20.8x<br />
Price/book ratio 2.0x 2.1x<br />
Return on equity 14.1% 13.4%<br />
Earnings growth rate 9.7% 9.7%<br />
Foreign holdings 0.8% 0.0%<br />
Turnover rate 2 14.2% —<br />
Standard deviation 3 10.0% 10.0%<br />
Talk with your advisor<br />
to learn more about<br />
<strong>Vanguard</strong> <strong>ETF</strong>s® ,the<br />
low-cost exchangetraded<br />
funds driven by<br />
<strong>Vanguard</strong>'s leading<br />
indexing expertise.<br />
Ten largest holdings and % of total net assets 4<br />
United Continental Holdings Inc. 1.5%<br />
Delphi Automotive plc 1.3<br />
Mylan Inc. 1.3<br />
Seagate Technology plc 1.2<br />
AmerisourceBergen Corp. 1.1<br />
Alcoa Inc. 1.1<br />
Hartford Financial Services Group Inc. 1.1<br />
Fidelity National Information Services Inc. 1.1<br />
Boston Scientific Corp. 1.1<br />
Northeast Utilities 1.0<br />
Top ten as % of total net assets 11.8%<br />
Top 10 sector diversification as % of common stock 5<br />
Financials 23.9%<br />
Consumer Goods 16.2<br />
Industrials 11.6<br />
Consumer Services 10.1<br />
Utilities 10.0<br />
Health Care 8.0<br />
Basic Materials 7.2<br />
Technology 6.8<br />
Oil & Gas 5.5<br />
Telecommunications 0.7<br />
1 Represents the expense ratio for the <strong>Vanguard</strong> <strong>ETF</strong> as reported in the most recent prospectus. There are material differences between mutual funds and <strong>ETF</strong>s.<br />
Unlike mutual funds, <strong>ETF</strong>s are priced continuously and bought and sold throughout the day in the secondary market (at a premium or discount to net asset value)<br />
with the assistance of a stockbroker, which entails paying commissions. Sources: Lipper, a Thomson Reuters Company, and <strong>Vanguard</strong>, December 31, 2013.<br />
2 For most recent fiscal year. Turnover rate excludes the value of portfolio securities received or delivered as a result of in-kind purchases or redemptions of the<br />
fund’s capital shares, including <strong>Vanguard</strong> <strong>ETF</strong> Creation Units.<br />
3 A measure of the volatility of a fund—based on the fund’s last three years of monthly returns—used to indicate the dispersion of past returns. A higher standard<br />
deviation means a greater potential for volatility. For funds with less than 36 months of performance history, standard deviation is not calculated.<br />
4 The holdings listed exclude any temporary cash investments and equity index products.<br />
5 Sector categories are based on the Industry Classification Benchmark system.<br />
<strong>Vanguard</strong> <strong>ETF</strong> Shares are not redeemable with the issuing Fund other than in very large aggregations worth millions of dollars. Instead, investors must buy or sell<br />
<strong>Vanguard</strong> <strong>ETF</strong> Shares in the secondary market and hold those shares in a brokerage account. In doing so, the investor may incur brokerage commissions and may<br />
pay more than net asset value when buying and receive less than net asset value when selling.<br />
All <strong>ETF</strong> products are subject to risk, which may result in the loss of principal. Prices of mid-cap <strong>ETF</strong> products often fluctuate more than those of large-cap <strong>ETF</strong><br />
products.<br />
For more information about <strong>Vanguard</strong> <strong>ETF</strong> Shares, visit vanguard.com, call 866-499-8473, or contact your broker to obtain a prospectus. Investment<br />
objectives, risks, charges, expenses, and other important information are contained in the prospectus; read and consider it carefully before investing.<br />
© 2015 The <strong>Vanguard</strong> Group, Inc. All rights reserved. U.S. Patent Nos. 6,879,964; 7,337,138; 7,720,749; 7,925,573; 8,090,646; 8,417,623.<br />
<strong>Vanguard</strong> Marketing Corporation, Distributor.<br />
FA0935_1214