POPULATION ECOLOGY: A Unijied Study of Animals and Plants
POPULATION ECOLOGY: A Unijied Study of Animals and Plants
POPULATION ECOLOGY: A Unijied Study of Animals and Plants

You also want an ePaper? Increase the reach of your titles
YUMPU automatically turns print PDFs into web optimized ePapers that Google loves.
<strong>POPULATION</strong> <strong>ECOLOGY</strong><br />
A <strong>Unijied</strong> <strong>Study</strong> <strong>of</strong> <strong>Animals</strong> <strong>and</strong> <strong>Plants</strong>
This page intentionally left blank
A <strong>Unijied</strong> <strong>Study</strong> <strong>of</strong> <strong>Animals</strong> <strong>and</strong> <strong>Plants</strong><br />
MICHAEL BEGON BSC, P ~D<br />
MARTIN MORTIMER BSC. P ~ D<br />
DAVID J. THOMPSON BA, DPhil<br />
All <strong>of</strong> the Department <strong>of</strong><br />
Environmental <strong>and</strong> Evolutionary Biology<br />
The University <strong>of</strong> Liverpool<br />
THIRD EDITION<br />
Blackwell<br />
Science
0 198l,l986,1996 by<br />
Blackwell Science Ltd<br />
Editorial Offices:<br />
Osney Mead, Oxford OX2 OEL<br />
25 John Street, London WClN 2BL<br />
23 Ainslie Place, Edinburgh M 3 6AJ<br />
3 50 Main Street, Malden<br />
MA 02148 5018, USA<br />
54 University Street, Carlton<br />
Victoria 30 5 3, Australia<br />
10, rue Casimir Delavigne<br />
7 5006 Paris, France<br />
Other Editorial Offices:<br />
Blackwell Wissenschafts-Verlag GmbH<br />
Kurfiirstendamm 5 7<br />
10 70 7 Berlin, Germany<br />
Blackwell Science KK<br />
MG Kodenmacho Building<br />
7-1 0 Kodenmacho Nihombashi<br />
Chuo-ku, Tokyo 104, Japan<br />
First published 19 8 1<br />
Reprinted 1982,1983,1985<br />
Second edition l986<br />
Reprinted 1987,1988,1989,1990,1992,1993<br />
Third edition 1996<br />
Reprinted 1997,1999,2000, 2002<br />
Set by Semantic Graphics, Singapore<br />
Printed <strong>and</strong> bound in the United Kingdom<br />
by TJ International Ltd, Padstow, Cornwall<br />
The Blackwell Science logo is a<br />
trade mark <strong>of</strong> Blackwell Science Ltd,<br />
registered at the United Kingdom<br />
Trade Marks Registry<br />
The right <strong>of</strong> the Author ta be<br />
identified as the Author <strong>of</strong> this Work<br />
has been asserted in accordance<br />
with the Copyright, Designs <strong>and</strong><br />
Patents Act 1988.<br />
All rights reserved. No part <strong>of</strong> this<br />
publication may be reproduced, stored in<br />
a retrieval system, or transmitted,<br />
in any form or by any means, electronic,<br />
mechanical, photocopying, recording or<br />
otherwise, except as permitted by the UK<br />
Copyright, Designs <strong>and</strong> Patents Act 1988,<br />
without the prior permission <strong>of</strong> the<br />
copyright owner.<br />
A catalogue record for this title<br />
is available from the British Library<br />
ISBN 0-632-03478-5<br />
Library <strong>of</strong> Congress<br />
Cataloging-in-Publicatioh Data<br />
Begon, Michael.<br />
Population ecology: a unified study<br />
<strong>of</strong> animals <strong>and</strong> plants1<br />
Michael Begon, Martin Mortimer.<br />
David J. Thompson. - 3rd ed.<br />
p. cm.<br />
Includes bibliographical references<br />
(p. ) <strong>and</strong> index.<br />
ISBN 0-632-03478-5<br />
1 Population biology. 2 Ecology.<br />
I Mortimer, Martin<br />
I1 Thompson, David J. 111 Title.<br />
QH352.B43 1996<br />
574.5'248-dc20 95-23676<br />
CIP<br />
For further information on<br />
Blackwell Science, visit our website:<br />
www.blackwell-science.com
Preface, vii<br />
Part 1 : Single-Species Populations<br />
Describing populations, 3<br />
1 .l Introduction, 3<br />
1.2 Population processes, 3<br />
1.3 The diagrammatic life table, 5<br />
1.3 .l General form, 5<br />
1.3.2 The common field grasshopper, an annual<br />
species, 6<br />
1.3.3 Ragwort, a biennial, 7<br />
1.3.4 More complex life cycles, 9<br />
1.3.5 Age <strong>and</strong> stage: the problems <strong>of</strong> describing<br />
some plant <strong>and</strong> animal populations, 10<br />
1.4 Conventional life tables, 13<br />
1 A.1 The cohort life table, 13<br />
1 A.2 The static life table, 17<br />
1.4.3 Resumk, 18<br />
1.5 Some generalizations, 18<br />
1.6 The modular growth <strong>of</strong> organisms, 21<br />
1.7 Buried seed banks, 26<br />
Intraspecific competition, 28<br />
2.1 The nature <strong>of</strong> intraspecific competition, 28<br />
2.2 Three characteristics <strong>of</strong> intraspecific<br />
competition, 29<br />
2.3 Density-dependence: a fourth characteristic, 29<br />
2.4 Scramble <strong>and</strong> contest, 31<br />
2.5 Actual effects <strong>of</strong> intraspecific competition, 33<br />
2.5.1 Palmblad's data, 33<br />
2.5.2 Competition in plants: a deeper look, 37<br />
2.5.3 Individual variability, 42<br />
2.5.4 Self-thinning in plants, 43<br />
2.5.5 Competition in Patella cochlear, 48<br />
2.5.6 Competition in the fruit fly, 50<br />
2.6 Negative competition, 50<br />
3 Models <strong>of</strong> single-species populations, 52<br />
3.1 Introduction, 52<br />
3.2 Populations breeding at discrete intervals, 52<br />
3.2.1 The basic equations, 52<br />
3.2.2 Incorporation <strong>of</strong> a range <strong>of</strong> competition, 54<br />
3.2.3 Models for annual plants, 56<br />
3.3 Continuous breeding, 58<br />
3.4 The utility <strong>of</strong> the equations, 60<br />
3.4.1 Causes <strong>of</strong> population fluctuations, 60<br />
3.4.2 The equations as descriptions, 62<br />
3.4.3 'Cobwebbing'-a more general<br />
approach, 65<br />
3.5 Incorporation <strong>of</strong> age-specific fecundity <strong>and</strong><br />
mortality, 66<br />
3.5.1 The matrix model, 69<br />
3.5.2 Using the model, 70<br />
3.5.3 A working example: Poa annua, 72<br />
Part 2: Interspecific Interactions<br />
4 Interspecific competition, 77<br />
4.1 The nature <strong>of</strong> interspecific interactions, 77<br />
4.2 Interspecific competition, 78<br />
4.3 A field example: granivorous ants, 78<br />
4.4 Competition between plant species: experimental<br />
approaches, 83<br />
4.4.1 Manipulating density, 83<br />
4.4.2 Manipulating resources, 89<br />
4.5 The ecological niche, 90<br />
4.6 The Competitive Exclusion Principle, 92<br />
4.7 Competitive exclusion in the field, 92<br />
4.8 Competitive release, 95<br />
4.9 Coexistence: resource partitioning, 95<br />
4.10 Character displacement, 98<br />
4.11 Competition: its avoidance or its<br />
non-existence?, 98<br />
4.12 Competition <strong>and</strong> coexistence in plants, 101<br />
4.13 A logistic model <strong>of</strong> two-species competition, 105<br />
4.13.1 The model's utility, 107<br />
4.13.2 A test <strong>of</strong> the model: fruit fly<br />
competition, 109<br />
4.14 Analysis <strong>of</strong> competition in plants, 110<br />
4.15 Niche overlap, 112<br />
4.16 Competition <strong>and</strong> heterogeneity, 1 l4
vi<br />
CONTENTS<br />
5 Predation, l17<br />
Introduction, 11 7<br />
Patterns <strong>of</strong> abundance, 118<br />
Coevolution, <strong>and</strong> specialization amongst<br />
predators, 119<br />
5.3.1 One explanation for the degrees <strong>of</strong><br />
specialization, 12 1<br />
5.3.2 Food preference <strong>and</strong> predator<br />
switching, 122<br />
Time <strong>and</strong> timing, 124<br />
Effects on prey fitness, 125<br />
5.5.1 The effects <strong>of</strong> herbivores on plant<br />
fitness, 126<br />
The effects <strong>of</strong> predation-rate on predator<br />
fitness, 131<br />
5.6.1 Thresholds, 131<br />
5.6.2 Food quality, 132<br />
The fu,nctional response <strong>of</strong> predators to prey<br />
availability, 13 3<br />
5.7.1 The 'type 2' response, 133<br />
5.7.2 The 'type 1' response, 135<br />
5.7.3 Variation in? h<strong>and</strong>ling time <strong>and</strong> searching<br />
efficiency: 'type 3' responses, 136<br />
5.7.4 Switching <strong>and</strong> 'type 3' responses, 136<br />
Aggregated effects, 13 7<br />
5.8..1 Parasite-host distributions, l3 7<br />
5.8.2 Refuges, 138<br />
5.8.3 Partial refuges: aggregative responses, 139<br />
5.8.4 Further responses to patchiness, 140<br />
5.8.5 'Even' distributions, 141<br />
5.8.6 Underlying behaviour, 142<br />
5.8.7 'Hide-<strong>and</strong>-seek', 143<br />
Mutual interference amongst predators, 144<br />
5.9.1 A similar effect amongst parasites, 146<br />
5.10 Interference <strong>and</strong> pseudo-interference, 146<br />
5.11 Optimal foraging, 148<br />
5.12 Resume, 149<br />
5.13 Mathematical models, 149<br />
5.13.1 Host-parasitoid models, 150<br />
5.13.2 Heterogeneity in host-parasitoid<br />
interactions, 155<br />
5.13.3 A model <strong>of</strong> grazing systems, 160<br />
5.14 'Patterns <strong>of</strong> abundance' reconsidered, 164<br />
5.15 Harvesting, 165<br />
5.15.1 Characteristics <strong>of</strong> harvested<br />
populations, 165<br />
5 .l 5.2 Harvesting in structured populations, 170<br />
5.15.3 Incorporating population structure:<br />
matrix models <strong>of</strong> harvesting, 173<br />
Part 3: Synthesis<br />
6 Population regulation, 177<br />
6.1 Introduction, 177<br />
6.2 Nicholson's view, l77<br />
6.3 Andrewartha <strong>and</strong> Birch's view, 177<br />
6.4 An example: Thrips imaginis, 178<br />
6.5 Some general conclusions, 180<br />
6.6 A life-table analysis <strong>of</strong> a Colorado beetle<br />
population, l81<br />
6.6.1 Life-table data, 181<br />
6.6.2 'Key-factor' analysis, l83<br />
6.6.3 Regulation <strong>of</strong> the population, 184<br />
6.6.4 A population model, 185<br />
6.7 The problem re-emerges, 186<br />
6.7.1 Life-table analyses, 186<br />
6.7.2 Single-species time series, 188<br />
6.7.3 Population regulation in vertebrates, 190<br />
6.8 Population regulation in plants, 191<br />
6.9 Genetic change, 200<br />
6.10 Territoriality, 201<br />
6.11 'Space capture' in plants, 203<br />
6.12 Chaos in ecological systems, 205<br />
Beyond population ecology, 210<br />
7.1 Introduction, 210<br />
7.2 Metapopulation dynamics, 210<br />
7.2.1 Metapopulation models, 2 10<br />
7.2.2 Examples <strong>of</strong> metapopulations, 212<br />
7.2.3 Applications <strong>of</strong> the metapopulation<br />
concept, 214<br />
7.3 Community structure, 216<br />
7.3.1 The role <strong>of</strong> interspecific competition, 216<br />
7.3.2 The role <strong>of</strong> predation, 21 7<br />
7.3.3 The role <strong>of</strong> disturbance, 219<br />
7.3.4 The role <strong>of</strong> instability, 220<br />
7.3.5 The role <strong>of</strong> habitat size <strong>and</strong> diversity, 222<br />
7.3.6 Conclusions. 224<br />
References; 225<br />
Author index, 239<br />
Organism index, 242<br />
Subject index, 245
This book is intended primarily for students. It is<br />
designed to describe the present state <strong>of</strong> population<br />
ecology in terms which can be readily understood by<br />
undergraduates with little or no prior knowledge <strong>of</strong><br />
the subject. We have, however, presented our view,<br />
rather than some definitive view <strong>of</strong> the subject, <strong>and</strong><br />
consequently, we have tried to provide sufficient<br />
information for everybody (student <strong>and</strong> expert alike) to<br />
disagree with us wherever they think fit.<br />
Population ecology is, to us, the study <strong>of</strong> the sizes<br />
(<strong>and</strong> to a lesser extent the distributions) <strong>of</strong> plant <strong>and</strong><br />
animal populations, <strong>and</strong> <strong>of</strong> the processes, particularly<br />
the biological processes, which determine these sizes.<br />
As such, it must inevitably be a numerical <strong>and</strong><br />
quantitative subject. Nevertheless, we have avoided<br />
complex mathematics, <strong>and</strong> we have, wherever possible,<br />
relegated the mathematical aspects <strong>of</strong> a topic to<br />
the final parts <strong>of</strong> the section in which that topic is<br />
examined. This will, we hope, make population ecology<br />
more generally accessible, <strong>and</strong> more palatable.<br />
But this is not to say that the mathematics have been<br />
played down. Rather, we have tried to play up the<br />
importance <strong>of</strong> real data from the real world: it is these,<br />
<strong>and</strong> not some mathematical abstraction, which must<br />
always be the major <strong>and</strong> ultimate concern <strong>of</strong> the<br />
population ecologist.<br />
Developing the subject in this way, however, emphasizes<br />
that mathematical models do have an essential<br />
role to play. Time <strong>and</strong> again they crystallize our<br />
underst<strong>and</strong>ing <strong>of</strong> a topic, or actually tell us more<br />
about the real world than we can learn directly from<br />
the real world itself. Nature may be the ultimate<br />
concern <strong>of</strong> population ecology, but mathematical<br />
models, laboratory experiments <strong>and</strong> field experiments<br />
<strong>and</strong> observations can all help to further our underst<strong>and</strong>ing.<br />
We have also tried to establish the point implied by<br />
the subtitle: that population ecology is a unified study<br />
<strong>of</strong> animals <strong>and</strong> plants. We are, <strong>of</strong> course, aware <strong>of</strong> the<br />
differences between the two. We feel, however, that<br />
plant <strong>and</strong> animal populations have had their own,<br />
independent ecologists for too long, <strong>and</strong> that, since the<br />
same fundamental principles apply to both, there is<br />
most to be gained at present from a concentration on<br />
similarities rather than differences.<br />
In this third edition, we have retained the basic<br />
structure <strong>of</strong> the first two editions; but we have sought<br />
to evolve the text in areas where we feel particular<br />
progress has been made <strong>and</strong> consolidated. We have<br />
looked further at the role <strong>of</strong> spatial scale in the<br />
stability <strong>of</strong> host-parasitoid <strong>and</strong> competitive interactions<br />
<strong>and</strong> following from this, revisited the role <strong>of</strong><br />
density-dependence in population regulation. We<br />
have addressed the problem <strong>of</strong> the detection <strong>of</strong> chaos,<br />
buried seeds, herbivory in plants, <strong>and</strong> introduced a<br />
major new section on the concept <strong>of</strong> the metapopulation.<br />
We have also tried further to cement some <strong>of</strong> the<br />
links between animal <strong>and</strong> plant populations by paying<br />
attention to descriptive equations common to both.<br />
The book is set out in three parts. The first starts<br />
from the simplest first principles <strong>and</strong> examines the<br />
dynamics <strong>and</strong> interactions occurring within singlespecies<br />
populations. The second part, occupying approximately<br />
half <strong>of</strong> the book is concerned with<br />
interspecific interactions: interspecific competition<br />
<strong>and</strong> predation. 'Predation', however, is defined very<br />
broadly, <strong>and</strong> includes the plant-herbivore, hostparasite,<br />
host-parasitoid <strong>and</strong> prey-predator interactions.<br />
The third part <strong>of</strong> the book synthesizes <strong>and</strong><br />
exp<strong>and</strong>s upon the topics from the preceding chapters,<br />
<strong>and</strong> does so at three levels: the regulation <strong>and</strong><br />
determination <strong>of</strong> population size, the concept <strong>of</strong> the<br />
metapopulation, <strong>and</strong> the importance <strong>of</strong> intra- <strong>and</strong><br />
inter-population interactions in determining community<br />
structure.<br />
A number <strong>of</strong> people read all or most <strong>of</strong> the<br />
manuscript prior to publication <strong>of</strong> the first edition, <strong>and</strong><br />
made generous <strong>and</strong> helpful suggestions, many <strong>of</strong><br />
vii
viii<br />
PREFACE<br />
which we have now incorporated. We are deeply<br />
grateful to Pr<strong>of</strong>essor Tony Bradshaw, Pr<strong>of</strong>essor J.L.<br />
Harper, Pr<strong>of</strong>essor Michael Hassell, Dr Richard Law,<br />
Pr<strong>of</strong>essor Ge<strong>of</strong>frey Sagar, Pr<strong>of</strong>essor Bryan Shorrocks<br />
<strong>and</strong>, most especially, Pr<strong>of</strong>essor John Lawton. We<br />
thank Pr<strong>of</strong>essor Ilkka Hanski <strong>and</strong> Dr Chris Thomas for<br />
their comments on much <strong>of</strong> the new material presented<br />
in this third edition.<br />
Population ecology has come a long way since its<br />
inception, <strong>and</strong> the rate <strong>of</strong> progress has never been<br />
faster than at present. Nevertheless, there are few, if<br />
any, populations for which we can claim to fully<br />
comprehend the underlying causes <strong>of</strong> abundance.<br />
Much remains to be understood, <strong>and</strong> a great deal<br />
more remains to be done.<br />
Michael Begon<br />
Martin Mortimer<br />
David J. Thompson
Part 1
This page intentionally left blank
Chapter 1<br />
1.1 Introduction<br />
This book provides an introduction to the study <strong>of</strong><br />
populations <strong>of</strong> animals <strong>and</strong> plants. Individual species<br />
are products <strong>of</strong> organic evolution that, in a multitude<br />
<strong>of</strong> differing assemblages, make up the communities <strong>of</strong><br />
living organisms that are found on Earth. That these<br />
communities display changes in the relative abundance<br />
<strong>of</strong> species is evident both from the fossil record<br />
<strong>and</strong> in the present day. Populations <strong>of</strong> member species<br />
in a community may show a range <strong>of</strong> dynamic<br />
patterns. For instance, over time, populations may<br />
change in size relative to one another; conversely,<br />
they may show apparent constancy in size despite the<br />
fact that births <strong>and</strong> deaths <strong>of</strong> individual organisms<br />
occur continually within them. Furthermore, individuals<br />
within populations may group together in<br />
differing spatial arrangements which may change with<br />
time, even though total population size may remain<br />
constant.<br />
Clearly changes in population size in space <strong>and</strong><br />
time, even in simple communities, have the potential<br />
to be, <strong>and</strong> indeed <strong>of</strong>ten are, very complex <strong>and</strong> pose a<br />
wealth <strong>of</strong> ecological questions. For instance in a<br />
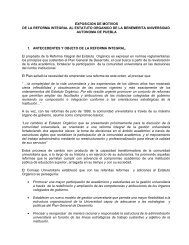
grassl<strong>and</strong> community (Fig. 1.1) we may ask 'Which<br />
processes contributed to a decline in one species<br />
(Festuca ovina) to a quarter <strong>of</strong> its original abundance,<br />
during which time another species appeared (Hieracium<br />
pilosella), only to then decline with the subsequent<br />
increase <strong>of</strong> a third (Thymus dvucei)?' Or in the<br />
case <strong>of</strong> Fig. 1.2, 'Why is there an apparent underlying<br />
regularity in the cyclical abundance <strong>of</strong> the lynx <strong>and</strong><br />
snowshoe hare?' If we are to underst<strong>and</strong> such patterns<br />
<strong>and</strong> be able ultimately to predict changes in them,<br />
then our initial focus must be on the individual species<br />
themselves <strong>and</strong> the manner in which populations<br />
respond to internal <strong>and</strong> external ecological factors.<br />
With this knowledge we may then begin to investigate<br />
questions <strong>of</strong> species-habitat interrelationships <strong>and</strong><br />
Fig. 1.1 Changes in the frequency <strong>of</strong> three species in a<br />
natural grassl<strong>and</strong> community in the UK over 40 years.<br />
(After Davy & Jeffries, 1981.)<br />
interactions among species within <strong>and</strong> between<br />
trophic levels.<br />
This chapter is concerned with describing singlespecies<br />
populations <strong>and</strong> with abstracting the underlying<br />
demographic features that are common to them<br />
all. With the appropriate description, we may then be<br />
able carefully to consider the underlying causes <strong>of</strong> the<br />
dynamics <strong>of</strong> single-species populations.<br />
1.2 Population processes<br />
Although studies <strong>of</strong> animal <strong>and</strong> plant populations<br />
have developed quite separately, these two life forms<br />
have much in common when examined from a<br />
demographic viewpoint. At the simplest level, plants<br />
are born from seeds just as birds are born from eggs;<br />
<strong>and</strong> old animals exhibit signs <strong>of</strong> senility just as old oak<br />
trees bear dead branches. Moreover, if we were to<br />
catalogue the ages <strong>of</strong> every d<strong>and</strong>elion plant <strong>and</strong> every<br />
vole living in a field, we would probably find a range <strong>of</strong><br />
ages in each; <strong>and</strong>, as time passes, individuals would<br />
either die, or survive to reach the next age group; <strong>and</strong><br />
in some age groups, at certain times, individuals
4 PART 1 : SINGLE-SPECIES <strong>POPULATION</strong>S<br />
Fig. 1.2 Changes in abundance <strong>of</strong><br />
the lynx Lynx canadensis <strong>and</strong> the<br />
snowshoe hare Lepus americanus<br />
(after MacLulick, 1% 7) in Canada<br />
over 80 years.<br />
would produce <strong>of</strong>fspring <strong>of</strong> their own. From the<br />
outset, therefore, it would seem sensible to suggest<br />
that, even though life forms <strong>and</strong> stages <strong>of</strong> development<br />
will differ substantially between species <strong>and</strong> across<br />
kingdoms (a point taken up in section 1.6) certain<br />
basic population processes are common to all <strong>of</strong> them.<br />
We can start considering these population processes<br />
by imagining a study <strong>of</strong> the numbers <strong>of</strong> voles inhabiting<br />
a meadow. Let us suppose that the vole numbers<br />
increase. We know that there has either been an influx<br />
<strong>of</strong> voles from adjoining meadows, or young voles have<br />
been born, or both <strong>of</strong> these events have occurred. We<br />
have, therefore, pin-pointed two very basic processes<br />
which affect the size <strong>of</strong> a population: immigration <strong>and</strong><br />
birth. Conversely, if vole numbers decline, then our<br />
explanation would be that voles must have either died,<br />
or simply left the meadow, or both. These processes,<br />
which reduce population numbers, are death <strong>and</strong><br />
emigration.<br />
Of course, there is no reason to suggest that all four<br />
processes are not occurring simultaneously in the<br />
population <strong>and</strong> there is therefore a flux <strong>of</strong> individuals<br />
within it. If the population declines, then the reason is<br />
simply that death <strong>and</strong> emigration together have outweighed<br />
birth <strong>and</strong> imigration, <strong>and</strong> vice versa if the<br />
population increases. We can certainly say that birth,<br />
death, immigration <strong>and</strong> emigration are the four fundamental<br />
demographic parameters in any study <strong>of</strong><br />
population dynamics. Moreover, they can be combined<br />
in a simple algebraic equation describing the<br />
change in numbers in a population between two<br />
points in time.<br />
where N, is the population size (number <strong>of</strong> individuals)<br />
at time t, N, + , is the population size one time period<br />
later, at time t + 1, B is the number <strong>of</strong> new individuals<br />
born between t <strong>and</strong> t + 1, D is the number <strong>of</strong> individuals<br />
which die between t <strong>and</strong> t + l, <strong>and</strong> I <strong>and</strong> E,<br />
respectively, are the numbers <strong>of</strong> immigrants <strong>and</strong><br />
emigrants during the same period <strong>of</strong> tirne. One <strong>of</strong> the<br />
simplest ways <strong>of</strong> envisaging equation 1.1 is as a<br />
graphical plot <strong>of</strong> the population size at time t + l<br />
against the size <strong>of</strong> the population at a previous time t,<br />
where the time interval is one generation. This is<br />
illustrated in Fig. 1.3. If population size remains static<br />
over generations, then the population will be represented<br />
as a stable locus in graphical space on the<br />
diagonal line bisecting the graph. However, if population<br />
size changes over generations then a trajectory <strong>of</strong><br />
loci may occur away from the equilibrium line. We<br />
will use this graphical approach to develop models <strong>of</strong><br />
single species dynamics later after we have considered<br />
the ways in which populations can be described.<br />
If the population is so large that our study cannot<br />
encompass the whole <strong>of</strong> it, then this equation must be<br />
constructed in terms <strong>of</strong> densities rather than absolute<br />
numbers. Thus, samples are taken, <strong>and</strong> N,, for instance,<br />
becomes 'the number <strong>of</strong> plants per square<br />
metre at time t' or 'the number <strong>of</strong> insects per leaf'.
CHAPTER 1: DESCRIBING <strong>POPULATION</strong>S 5<br />
Fig. 1.3 Graphical representation <strong>of</strong> changes in population<br />
size over generations. Each successive population size Nt + ,<br />
is plotted against starting population size Nt . See text.<br />
Nevertheless, equation 1.1 indicates that, at its simplest,<br />
the task <strong>of</strong> the demographer is to measure these<br />
four parameters <strong>and</strong> account for their values-yet the<br />
translation <strong>of</strong> this into practice is rarely straightforward.<br />
Almost all species pass through a number <strong>of</strong><br />
stages in their life cycle. Insects metamorphose from<br />
eggs to larvae to adults, <strong>and</strong> some have a pupal stage<br />
as well; plants pass from seeds to seedlings <strong>and</strong> then to<br />
photosynthesizing adult plants, <strong>and</strong> so on. In all such<br />
cases the different stages must be studied individually.<br />
Also, in reality, the four 'basic' parameters are themselves<br />
<strong>of</strong>ten compounded from several other component<br />
processes. Equation 1.1, therefore cannot be<br />
considered as anything more than a basis upon which<br />
more realistic descriptions can be built.<br />
1.3 The diagrammatic life table<br />
1.3.1 General form<br />
The description we require is one which retains the<br />
generality <strong>of</strong> equation 1.1, but can also reflect the<br />
complexities <strong>of</strong> most actual populations. One such<br />
description is the diagrammatic life table (Sagar &<br />
Fig. 1.4 A diagrammatic life table for an idealized higher<br />
plant. F, number <strong>of</strong> seeds per plant; g, chance <strong>of</strong> a seed<br />
germinating (0 g S 1); e, chance <strong>of</strong> a seedling establishing<br />
itself as an adult (06 e 1); p, chance <strong>of</strong> an adult surviving<br />
(O ap S l).<br />
Mortimer, 1976), which is applied to an idealized<br />
higher plant in Fig. 1.4. The numbers at the start <strong>of</strong><br />
each <strong>of</strong> the stages-seeds, seedlings <strong>and</strong> adults-are<br />
given in the square boxes. Thus, the Nt + , adults alive<br />
at time t + l are derived from two sources. Some are<br />
the survivors <strong>of</strong> the Nt adults alive at time t. Their<br />
probability <strong>of</strong> survival (or, equivalently, the proportion<br />
<strong>of</strong> them that survive) is placed inside a triangle (or<br />
arrow) in Fig. 1.4, <strong>and</strong> denoted by p. So, for instance, if<br />
Nt is 100 <strong>and</strong> p (the survival-rate) is 0.9, then there are<br />
100 X 0.9 or 90 survivors contributing to Nt + , at time<br />
t + l (10 individuals have died; the mortality-rate<br />
(1-p) between <strong>and</strong> t + 1 is clearly 0.1).<br />
The other source <strong>of</strong> the Nt + , adults is 'birth', which<br />
in the present case can be viewed as a multi-stage<br />
process involving seed production, seed germination<br />
<strong>and</strong> the growth <strong>and</strong> survival <strong>of</strong> seedlings. The average<br />
number <strong>of</strong> seeds produced per adult-the average<br />
fecundity <strong>of</strong> the plant population-is noted by F in<br />
Fig. 1.4 <strong>and</strong> placed in a diamond. The total number <strong>of</strong><br />
seeds produced is, therefore Nt X F. The proportion <strong>of</strong><br />
these seeds that actually germinate on average is<br />
denoted by g, which, being essentially a survival-rate,<br />
is placed in an arrow in Fig. 1.4. Multiplying N, X F by<br />
g gives us the number <strong>of</strong> seedlings which germinate<br />
successfully. The final part <strong>of</strong> the process is the
6 PART 1 : SINGLE-SPECIES <strong>POPULATION</strong>S<br />
physiological establishment <strong>of</strong> seedlings as independently<br />
photosynthesizing adults. The probability <strong>of</strong><br />
surviving this very risky phase <strong>of</strong> plant growth is<br />
denoted by e (once again in an arrow), <strong>and</strong> the total<br />
number <strong>of</strong> 'births' is, therefore, N, X F X g X e. The<br />
number in the population at time t + 1 is then the sum<br />
<strong>of</strong> this <strong>and</strong> the number <strong>of</strong> surviving adults, N, X p,<br />
We can now substitute the terms from the life table<br />
into our basic equation <strong>of</strong> population growth (equation<br />
1.1) as follows:<br />
Surviving<br />
&<br />
N,,, =N,-N,(l -p)+N,xFxgxe. (14<br />
v-<br />
Death Birth<br />
There are several points to note about this equation.<br />
The first is that both here <strong>and</strong> in Fig. 1.4 immigration<br />
<strong>and</strong> emigration have, for simplicity, been ignored, <strong>and</strong><br />
our description <strong>of</strong> how a plant population may change<br />
in size is essentially incomplete. The second is that<br />
'death' has been calculated as the product <strong>of</strong> N, <strong>and</strong><br />
the mortality-rate (1-p)-survival<br />
<strong>and</strong> mortality are<br />
opposite sides <strong>of</strong> the same coin. The third point is that<br />
birth is quite clearly a complex product <strong>of</strong> 'birthproper'<br />
<strong>and</strong> subsequent survival. This is frequently the<br />
case: even human 'birth' rates are the product <strong>of</strong> the<br />
rate at which fertilized eggs implant in the womb <strong>and</strong><br />
the rate <strong>of</strong> prenatal survival.<br />
1.3.2 The common fieId grasshopper,<br />
an annual species<br />
In practice, careful <strong>and</strong> meticulous field-work is<br />
necessary to build a diagrammatic life table <strong>of</strong> the type<br />
illustrated in Fig. 1.4. Reliable estimates <strong>of</strong> the transition<br />
probabilities (p, g <strong>and</strong> e in Fig. 1.4) are required,<br />
as well as measurements <strong>of</strong> the fecundity <strong>of</strong> adults.<br />
Such data for the common field grasshopper, Chorthippus<br />
brunneus, are illustrated in Fig. 1.5. These were<br />
obtained by a combination <strong>of</strong> field samples <strong>and</strong><br />
back-up laboratory observations on a population near<br />
Ascot in Berkshire (Richards & Wal<strong>of</strong>f, 1954). The<br />
population was isolated so that imigration <strong>and</strong><br />
emigration could be ignored.<br />
The first point to note about Fig. 1.5 is that no<br />
Fig. 1.5 Diagrammatic life table <strong>of</strong> the field grasshopper<br />
Charthippus brunneus. (Population sizes are per 10 m2; data<br />
from Richards & WaloK 1954.)<br />
adults survive from one year to the next (p = 0). Ch.<br />
brunneus is, therefore, an 'annual' species; each generation<br />
lasts for just 1 year, <strong>and</strong> generations are<br />
discrete, i.e. they do not overlap. It is also clear that<br />
the 'birth' <strong>of</strong> adults is a complex process involving at<br />
least six stages. The first stage is the laying <strong>of</strong> egg-pods<br />
in the soil by adult females. On average, each female<br />
laid 7.3 pods, each containing 11 eggs. F is, therefore,<br />
80.3. These eggs remained dormant over winter, <strong>and</strong><br />
by early sumer only 0.079 <strong>of</strong> them had survived to<br />
hatch into first-instar nymphs. Subsequently, the<br />
transition probabilities between instars were fairly
CHAPTER 1: DESCRIBING <strong>POPULATION</strong>S 7<br />
Fig. 1.6 Diagrammatic life tables for species with discrete<br />
breeding seasons. (a) Generations do not overlap.<br />
(b) Generations overlap. (Birth processes are simplified.)<br />
constant, taking a remorseless toll on the surviving<br />
population; less than a third <strong>of</strong> the first-instar nymphs<br />
survived to be 'born' into the adult population. Despite<br />
their apparently high fecundity, therefore, the adults<br />
<strong>of</strong> 1947 did little more than replace themselves with<br />
newly born adults in the following year.<br />
The Ch. brunneus diagrammatic life table is illustrated<br />
in a simplified form in Fig. 1.6a. This life table is<br />
appropriate for all species which breed at a discrete<br />
period in their life cycle, <strong>and</strong> whose generations do not<br />
overlap. If the time between to <strong>and</strong> t, is 1 year, the life<br />
history is referred to as annual.<br />
1.3.3 Ragwort, a biennial<br />
An annual life history is only one <strong>of</strong> a number <strong>of</strong><br />
possible patterns. If we consider species that live for 2<br />
years rather then 1, reproducing only in the final year,<br />
then we have a life history that involves breeding at<br />
one discrete time in the life cycle, but in which<br />
generations <strong>of</strong> adults may well overlap; this is illustrated<br />
in Fig. 1.6b. If the time periods are years, then<br />
this life cycle is referred to as 'biennial'. During any<br />
one summer, the population contains both young<br />
adults which will not reproduce until the following<br />
year, <strong>and</strong> mature , reproducing adults.<br />
Ragwort, Senecio jacobaea, is a biennial plant with a<br />
life cycle in which seeds germinate principally in the<br />
autumn. Then, during the next year, young plants<br />
form a rosette <strong>of</strong> leaves. In the second year a flowering<br />
stem is formed. A diagrammatic life table for S.<br />
jacobaea is shown in Fig. 1.7, in which the birth<br />
process has been exp<strong>and</strong>ed to include some extra<br />
stages which are specific to plants. The data come<br />
from measurements made on a population living in<br />
s<strong>and</strong> dune environments in the Netherl<strong>and</strong>s (van der<br />
Meijden, 1971). Of the 5040 seeds that are produced,<br />
62% fall on to the ground; the other 38% are dispersed<br />
by the wind to other areas. By the same token there is<br />
quite a high chance that immigrants enter this population.<br />
This necessitates a further modification <strong>of</strong> our<br />
life table, indicated in Fig. 1.7 by the inclusion <strong>of</strong><br />
invading seeds, which may contribute either to the<br />
seed banks or to the incoming seed 'rain'.<br />
Having arrived on the ground, various potential<br />
fates await ragwort seeds. They lie on the surface <strong>of</strong><br />
the s<strong>and</strong> in the 'surface seed bank', where they may<br />
germinate, be eaten or just die. Alternatively, wind or<br />
insects, acting as migratory agents, may transport<br />
them to neighbouring areas; or they may become
8 PART 1: SINGLE-SPECIES <strong>POPULATION</strong>S<br />
Fig. 1.7 Diagrammatic life table <strong>of</strong> the<br />
biennial ragwort Senecio jacobaea.<br />
(Population sizes are per 4 m2: data<br />
from van der Meijden, 1971 .)<br />
buried. The detailed fates <strong>of</strong> ragwort seeds in s<strong>and</strong><br />
dune environments are not fully known, but only<br />
11.4O/o stay in the surface seed bank; <strong>and</strong> <strong>of</strong> the 3124<br />
seeds that rain on to the soil only 40 actually<br />
geminate successfully. However, seedlings can arise<br />
from an additional source: the buried seed bank. We
CHAPTER 1: DESCRIBING <strong>POPULATION</strong>S 9<br />
do not know how many seeds are buried in the s<strong>and</strong><br />
pr<strong>of</strong>ile, but for many plant species, especially weeds,<br />
the numbers <strong>of</strong> buried seeds can be very high (up to c.<br />
50 000 m-2), <strong>and</strong> a proportion <strong>of</strong> each season's seed<br />
crop does become buried. To indicate that this is a<br />
birth route we have added to the 'seedling' <strong>and</strong><br />
'established plant' components a fraction <strong>of</strong> the buried<br />
seed bank, denoted by S. Finally, the transition from<br />
seedlings to young, established, photosynthetically<br />
independent adults in s<strong>and</strong> dune environments is also<br />
an exceedingly risky phase for ragwort: only 1.7% <strong>of</strong><br />
the seedlings actually become established.<br />
The life table in Fig. 1.7, therefore, illustrates the<br />
importance <strong>of</strong> additional seed sources to the 4 m2<br />
area, since from to to t, the original ragwort density <strong>of</strong><br />
1 becomes reduced to 0.69. Thus, to keep the number<br />
<strong>of</strong> young adults at t, up to exactly 1 we might argue<br />
that there are 155 seeds in the buried bank which<br />
germinate (since if 0.69 + 0.002s = 1, then S = 155).<br />
Alternatively, some <strong>of</strong> these 155 might enter the 'birth<br />
process' as immigrants; <strong>and</strong> if we recall that 38% <strong>of</strong><br />
the 5040 seeds were dispersed, we can see that there<br />
are ample numbers to rely upon. To complete this life<br />
table, however, we should note that the chance <strong>of</strong> a<br />
young adult surviving to become a mature one producing<br />
seed is only 0.25. To ensure that the population<br />
size at t, is still 1, therefore, we will have to imagine a<br />
further input <strong>of</strong> seeds into the birth process.<br />
Such data as these emphasize the extreme severity<br />
<strong>of</strong> the s<strong>and</strong> dune habitat to plant life, <strong>and</strong> the<br />
considerable mobility <strong>of</strong> seeds in the life cycle <strong>of</strong><br />
ragwort: individual seeds may travel at least 15 m.<br />
Since s<strong>and</strong> dunes, by their nature, <strong>of</strong>fer shifting <strong>and</strong><br />
temporarily suitable habitats for ragwort, we can infer<br />
that seed movement by dispersal on or above the s<strong>and</strong><br />
is a very necessary feature in the life <strong>of</strong> this plant.<br />
1.3.4 More complex life cycles<br />
Overlapping generations are not confined to biennials.<br />
Consider the population <strong>of</strong> great tits (Parus major) near<br />
Oxford studied by Perrins (1965) <strong>and</strong> illustrated in<br />
Fig. 1.8. Adult birds build their nests <strong>and</strong> lay eggs in<br />
the early summer, but <strong>of</strong> these eggs only a proportion<br />
(0.84 in this case) survive to hatch as nestlings. These<br />
Fig. 1.8 Diagrammatic life table <strong>of</strong> the perennial great tit<br />
Parus major. (Population sizes are per hectare; data from<br />
Perrins, 1965 .)<br />
nestlings are themselves subject to many dangers, <strong>and</strong><br />
by the late summer only 71% <strong>of</strong> them survive to<br />
fledge-leaving the nest <strong>and</strong> fending for themselves. Of<br />
these fledglings, only a small proportion live through<br />
the winter to become breeding adults. However, a<br />
rather larger proportion <strong>of</strong> the previous generation's<br />
adults have also survived. The population <strong>of</strong> breeding<br />
adults, therefore, consists <strong>of</strong> individuals <strong>of</strong> various<br />
ages, from 1 to 5 or more years old. As Fig. 1.8 shows,
10 PART 1 : SINGLE-SPECIES <strong>POPULATION</strong>S<br />
this situation is readily described by a variant <strong>of</strong> our<br />
diagrammatic life table very similar to Fig. 1.4. We are<br />
dealing with a population in which breeding occurs at<br />
discrete time periods, but in which the individuals are<br />
potentially long lived so that many generations overlap.<br />
We have assumed with our great tits, however, that<br />
adults <strong>of</strong> different ages are equivalent <strong>and</strong> may be<br />
treated as equal members <strong>of</strong> a common pool. Yet there<br />
will be many instances in which their demographic<br />
characteristics will be 'age-dependent' or 'agespecific'.<br />
In such cases, a diagrammatic life table <strong>of</strong> the<br />
type shown in Fig. 1.9 may be more appropriate. In<br />
Fig. 1.9 A diagrammatic life table for any species that<br />
reproduces continuously with overlapping genera~ons, a,,<br />
a, - a, represent age groups <strong>of</strong> individuals, a, being the<br />
oldest group. pij is an age-specific probability <strong>of</strong> survival,<br />
where, for example, p,, the probability <strong>of</strong> individuals in a,<br />
at one time surviving to reach a, by the next time period<br />
(06 piid 1). The inset shows a subset <strong>of</strong> the general life<br />
table.<br />
Fig. 1 .g, the population at any one time consists <strong>of</strong><br />
individuals in a range <strong>of</strong> age classes: a, individuals are<br />
in the youngest age-class, a, individuals in the next<br />
oldest, <strong>and</strong> so on. With the passage <strong>of</strong> one unit <strong>of</strong> time<br />
a proportion <strong>of</strong> the individuals in one age group<br />
survive to become individuals in the next oldest age<br />
group. Thus po, is the proportion <strong>of</strong> the a, individuals<br />
surviving to become a, individuals one time unit later,<br />
p,,, is the proportion <strong>of</strong> the a, individuals surviving to<br />
become a, individuals, <strong>and</strong> so on (though in practice<br />
these p-values will, <strong>of</strong> course, vary with the changing<br />
circumstances <strong>of</strong> the population). Figure 1.9 also<br />
shows that each age group has the potential to<br />
contribute to the youngest age-class via the birth<br />
process. For simplicity, birth froxii all age groups has<br />
been fused together; in reality, fecundity, like survival,<br />
would vary from age-class to age-class. Nevertheless,<br />
despite this increased sophistication, inspection <strong>of</strong> the<br />
life table in Fig. 1.9 reveals that it is built up <strong>of</strong> units<br />
which are little more than the diagrammatic life table<br />
with which we are already familiar. One such unit is<br />
illustrated in the inset in Fig. 1.9.<br />
The implication in Fig. 1.9 is that breeding occurs at<br />
discrete pehods, even though generations overlap <strong>and</strong><br />
there are many age-classes each with their own birth<strong>and</strong><br />
survival-rate, In many species, however, birth<br />
(<strong>and</strong> death) occur continuously within a population.<br />
Figure 1.9 is still appropriate in such cases, but time<br />
must be split arbitrarily into intervals, <strong>and</strong> the various<br />
terms take on slightly different meanings. Suppose, for<br />
instance, that we consider the numbers in a population<br />
at monthly intervals. At to, a, is the total number<br />
<strong>of</strong> individuals between 2 <strong>and</strong> 3 months old. One<br />
month later (at t,), p23 <strong>of</strong> these will survive to become<br />
the a, individuals that are between 3 <strong>and</strong> 4 months<br />
old. Thus, even though birth <strong>and</strong> death are occurring<br />
continuously, they are considered 'one month at a<br />
time'.<br />
1.3.5 Age <strong>and</strong> stage: the problems <strong>of</strong> describing<br />
some plant <strong>and</strong> animal popdations<br />
Figure 1.9 illustrates the age-dependent transitions<br />
that may occur in populations with overlapping generations.<br />
As a means <strong>of</strong> describing flux in populations,
CHAPTER 1: DESCRIBING <strong>POPULATION</strong>S 11<br />
this approach is only justifiable if individuals can be<br />
classified meaningfully by age alone. For many plant<br />
species, however, especially those that are perennial,<br />
the fate <strong>of</strong> an individual is not so much dependent on<br />
its absolute age as on its size or stage. <strong>of</strong> growth. In<br />
grasses, for instance, the chance <strong>of</strong> being grazed may<br />
be crucially size-dependent, <strong>and</strong> an individual with a<br />
few tillers may escape the notice <strong>of</strong> a herbivore whilst<br />
a conspicuous one bearing many tillers may not.<br />
Equally important is the fact that the grazed individual,<br />
though reduced in size, may not necessarily die,<br />
but may generate from basal growing points (buds) to<br />
achieve its former size. Age <strong>of</strong> the plant under such<br />
circumstances may have little relevance. Size <strong>of</strong> the<br />
plant is the more important determinant <strong>of</strong> its fate.<br />
Considerations <strong>of</strong> this sort have led a number <strong>of</strong> plant<br />
ecologists, particularly in the Soviet school (Gatsuk<br />
et al., 1980) to reject age per se in favour <strong>of</strong> 'age states'<br />
as a useful criterion for describing individuals (Uranov,<br />
1975; see Silvertown, 1982 for a worked example).<br />
Thus, individuals may be classified on an ontogenetic<br />
or developmental basis <strong>and</strong> categories might include<br />
seed, seedling, juvenile, immature, virginile, reproductive,<br />
subsenile <strong>and</strong> senile states. Such a classification<br />
recognizes that there are broad morphological<br />
changes that occur during the growth <strong>and</strong> development<br />
<strong>of</strong> a plant species but that the duration <strong>of</strong> time<br />
spent in each may differ widely. Mertz <strong>and</strong> Boyce<br />
(1956), for instance, have shown that almost 75% <strong>of</strong><br />
the oak tree 'seedlings' developing after a forest felling<br />
were in fact sprouts attached to roots up to 40 years<br />
old. Presumably this 'seedling' population had remained<br />
suppressed at an early stage or 'age state' due<br />
to factors such as grazing, trampling <strong>and</strong> poor conditions<br />
for growth.<br />
An alternative classification <strong>of</strong> individuals is by size<br />
alone <strong>and</strong> indeed this can be superimposed upon an<br />
age-state classification. Terrestrial plants that can<br />
'reiterate' their growth form (see section 1.6) can not<br />
only regress or advance from one age-state to another,<br />
but within an age-state they may also change in size.<br />
The choice between a strictly size-based <strong>and</strong> an<br />
age-state classification, or indeed a hybrid between<br />
the two, is very much dependent upon the organism<br />
under study.<br />
In studying the population dynamics <strong>of</strong> reef coral<br />
Agaricia agaricites, <strong>of</strong>f the coast <strong>of</strong> Jamaica, Hughes<br />
(1984) classified individual coral colonies on the basis<br />
<strong>of</strong> age-state-'larva' or 'coral colony'-<strong>and</strong> on the size<br />
<strong>of</strong> colony. By repeated photography <strong>of</strong> the reef he was<br />
able to record size changes as well as larval recruitment.<br />
A diagrammatic representation <strong>of</strong> the population<br />
structure is shown in Fig. 1.10. Coral colonies<br />
may remain static in size, they can grow, they can<br />
shrink, <strong>and</strong> they can reproduce sexually by freeswimming<br />
larvae as well as asexually by fission. The<br />
chances <strong>of</strong> their doing so for each size-class are shown<br />
in this figure, for a year when storms were absent <strong>and</strong><br />
conditions ideal for coral growth. This coral species<br />
has a mean annual lateral extension rate <strong>of</strong> less than<br />
2 cm. Thus, a large proportion <strong>of</strong> the population<br />
remained in the same size-class from one season to the<br />
next. Moreover, whilst only a small fraction <strong>of</strong> the<br />
colonies increased in size, a more likely occurrence<br />
was that they should shrink to smaller size-classes, a<br />
fate moreover that was size-dependent. This shrinkage<br />
may represent a series <strong>of</strong> remorseless steps towards<br />
mortality <strong>of</strong> the individual, but equally it may<br />
also reflect fission <strong>of</strong> the colony <strong>and</strong> hence asexual<br />
reproduction. Indeed, in the case <strong>of</strong> size-class 4, it<br />
must do so since the sum <strong>of</strong> the fractional transitions<br />
exceeds unity.<br />
This sort <strong>of</strong> description, based primarily on size<br />
alone, has limitations in so far as it does not readily<br />
distinguish between survival <strong>and</strong> fecundity, especially<br />
when asexual reproduction is involved. Moreover, in<br />
the majority <strong>of</strong> classifications <strong>of</strong> this type, at least one<br />
additional category, as we have already mentioned,<br />
must be included to complete the life cycle: larvae.<br />
Hughes recorded 1.5 larvae mP2 settling as new<br />
recruits during a year in his study. In Agaricia the<br />
probability <strong>of</strong> reproducing sexually by larvae is unknown<br />
(Connell, 1973), but even if size-specific fecundities<br />
were meansurable, they might have little value<br />
in describing the local populations <strong>of</strong> this coral since<br />
larvae tend to be very widely dispersed. Using this<br />
figure for larval recruitment, Hughes was able to<br />
calculate by matrix methods (see Chapter 3) that the<br />
population was almost static in size.<br />
A comparable approach describing a plant species is
12 PART l: SINGLE-SPECIES <strong>POPULATION</strong>S<br />
Fig. 1.10 A size-based diagrammatic life table for the reef<br />
coral Agaricia agaricites growing in calm seas. (Data from<br />
Hughes, 1984.)<br />
the one used by Sarukhan <strong>and</strong> Gadgil (1974) for the<br />
'creeping buttercup', Ranunculus repens in Britain.<br />
This species reproduces sexually by seed <strong>and</strong> by<br />
asexual propagation, though recruitment by these<br />
means occurs at different times during the season.<br />
Seeds germinate in late spring <strong>and</strong> early summer,<br />
whilst in late summer new 'daughter' plants become<br />
established as separate adult plants from shoots borne<br />
at nodes along creeping stolons. If we require a<br />
description <strong>of</strong> these events within a season, <strong>and</strong> hence<br />
a more faithful representation <strong>of</strong> the biological events<br />
that occur, we must recognize that the generalized<br />
life-table diagram is inadequate <strong>and</strong> accept a more<br />
complex flow diagram (Fig. 1.11). In essence this is an<br />
age-state classification in which the flues are precisely<br />
defined chronologically. This approach makes<br />
an additional important distinction, in that asexually<br />
produced 'vegetative' daughters are classified separately<br />
from sexually produced seedlings, at least<br />
during the first year <strong>of</strong> life. For the purposes <strong>of</strong><br />
generality, Sarukhan <strong>and</strong> Gadgil lumped these recruits<br />
together once they attained 1 year <strong>of</strong> age, but there is<br />
no reason why this distinction could not be maintained<br />
if continued resolution was required.
CHAPTER l: DESCRIBING <strong>POPULATION</strong>S 13<br />
Fig. 1.11 The transitions occurring throughout the year in<br />
a buttercup population (Ranunculus repens) as envisaged by<br />
Sarukhan <strong>and</strong> Gadgil(1974).<br />
In describing populations by diagrmmatic means,<br />
then, we have considered a range <strong>of</strong> forms <strong>of</strong> description.<br />
Some have been based on generation-togeneration<br />
changes classifying by age, while others<br />
have been based on size taking for convenience<br />
season-to-season or month-to-month time-steps. In<br />
this latter instance, it is easy to preclude particular<br />
life-cycle transitions (if the biology <strong>of</strong> the species<br />
dem<strong>and</strong>s this) by setting them to zero.<br />
Additionally, we can impose a genetic subclassification<br />
on our life table. Individuals in a population may<br />
be known to be genetically distinct. Conversely, 'individuals'<br />
may actually be asexually produced ramifications<br />
<strong>of</strong> the same genotype. Kays <strong>and</strong> Harper (1974)<br />
recognized this dichotomy <strong>and</strong> introduced the terms<br />
genet <strong>and</strong> ramet to avoid confusion. Thus, individuals<br />
that are produced asexually (e.g. 'daughter' plants <strong>of</strong><br />
buttercups, bulbs, tillers, polyps <strong>of</strong> Obeliu, corals) <strong>and</strong><br />
have the potential for growth independent <strong>of</strong> the<br />
parent are called ramets; <strong>and</strong> a population <strong>of</strong> ramets<br />
with the same ('maternal') parentage constitutes a<br />
clone. A genet, on the other h<strong>and</strong>, is an organism,<br />
however much ramified, which has arisen from a single<br />
zygote-all parts having the same genotype.<br />
1.4 Conventional life tables<br />
1.4.1 The cohort life table<br />
The most reliable method <strong>of</strong> determining age-specific<br />
mortality <strong>and</strong> fecundity for a continuously breeding<br />
population, or simply one in which generations are<br />
overlapping, is to follow the fate <strong>of</strong> a group <strong>of</strong><br />
individuals, all born during the same time interval.<br />
Such a group is called a cohort. The process is<br />
essentially a journey from the top left-h<strong>and</strong> corner <strong>of</strong><br />
Fig. 1.9 to its bottom right-h<strong>and</strong> corner, <strong>and</strong>, in many<br />
respects, it is similar to following the fate <strong>of</strong> an annual
14 PART l : SINGLE-SPECIES <strong>POPULATION</strong>S<br />
species throughout its yearly cycle. The difference in<br />
this case is that each individual has to be recognized<br />
<strong>and</strong> distinguished from those individuals belonging to<br />
other cohorts which are in population at the same<br />
time. The situation is described diagrammatically in<br />
Fig. 1.12 in which individuals are represented by solid<br />
lines, ageing with time, <strong>and</strong> eventually dying (a 'spot'<br />
in Fig. 1.12). The cohort <strong>of</strong> four individuals (born at to)<br />
is observed again at t, (when there are two survivors),<br />
at t, (one survivor), <strong>and</strong> at t, (no survivors).<br />
<strong>Plants</strong> are ideal subjects for such study, since they<br />
are generally sessile <strong>and</strong> can be tagged or mapped,<br />
enabling the fates <strong>of</strong> individuals to be precisely re-<br />
corded <strong>and</strong> their reproductive output measured. Law<br />
(1975), for instance, followed the fate <strong>of</strong> a cohort <strong>of</strong> the<br />
annual meadow grass, Poa annua, from initial establishment<br />
to the ultimate death <strong>of</strong> the last individual.<br />
Recording the number alive at successive time-periods<br />
<strong>and</strong> the number <strong>of</strong> <strong>of</strong>fspring (seeds) produced per<br />
plant, he was able to compile a table <strong>of</strong> data showing<br />
survivorship <strong>and</strong> fecundity (Table 1.1). The first (lefth<strong>and</strong>)<br />
column gives the age at the beginning <strong>of</strong> each<br />
time interval. Thereafter, only the second <strong>and</strong> last<br />
columns (a, <strong>and</strong> B,) actually contain field data. All<br />
other columns are derived from the a, column. We<br />
can see that this (conventional) life table contains<br />
Fig. 1.12 A population portrayed as a series <strong>of</strong> diagonal<br />
lines, each line representing the life 'track' <strong>of</strong> an individual.<br />
As time progresses, each individual ages <strong>and</strong> eventually<br />
dies. Three individuals are born prior to to, four during to,<br />
<strong>and</strong> three during t,. To construct a 'fixed' cohort life table,<br />
a 'searchlight' is directed into the cohort <strong>of</strong> individuals born<br />
during to <strong>and</strong> the subsequent development <strong>of</strong> the cohort is<br />
monitored. Two <strong>of</strong> the four individuals have survived to the<br />
beginning <strong>of</strong> t,; only one <strong>of</strong> these is alive at the beginning <strong>of</strong><br />
t,; <strong>and</strong> none survives to the start <strong>of</strong> t,. To construct a<br />
'static' life table, the 'searchlight' is directed onto the whole<br />
population during a single segment <strong>of</strong> time (t,). The ages <strong>of</strong><br />
the seven individuals alive at some time during t, may be<br />
taken as an indication <strong>of</strong> the age-specific survival-rates if<br />
we assume that the rates <strong>of</strong> birth <strong>and</strong> survival are constant.<br />
(After Skellam, 1972.)
CHAPTER l: DESCRIBING <strong>POPULATION</strong>S 15<br />
Table 1.1 A cohort life table for Poa annua. (Adapted from Law, 1975.)<br />
-- - ..P . . LA.- . L - -- .- . . .- - - - , - .--<br />
Avcrag<br />
Number Stnndrtrdized St<strong>and</strong>ardized numhcr<br />
Age<br />
o'bsen~rtl alive nt~mbr sun"iuing nurnhr dying<br />
<strong>of</strong> smls pcr<br />
(in 3-month at each at #he start or age hcirvmn \ Mortality- loglll a, indivirlual<br />
mods) quarfer year intenpal X <strong>and</strong> v+ l rate [flgll,a,, , age(! v<br />
\ 8, 1, 4 4* OX,,,^, I~RI,, 1, H,<br />
0 R43 1 0 147 0.143 2.926 3.m 0.067 0<br />
1 722 857 232 0.271 2.859 2.933 0.137 300<br />
2 527 625 250 0.40 2.712 2.796 0.222 620<br />
3 316 375 204 0.544 1.500 2.574 0.342 430<br />
4 144 171 107 0.626 2.158 2.232 0.426 210<br />
5 54 64 46.2 0.722 1.732 1.8M 0.556 M)<br />
h 15 17.8 14.24 0.800 1.176 1.250 0.699 30<br />
7 3 3.56 3.56 1.000 0.477 0.551 10<br />
R 0 0 - -<br />
essentially the same information as the diagrammatic<br />
life tables previously described.<br />
The a, column summarizes the raw data collected<br />
in the field by mapping the positions <strong>of</strong> 843 P. annua<br />
plants that arose from naturally sown seeds in a<br />
number <strong>of</strong> metre-square quadrats. From this raw data<br />
'I,' values are calculated, by converting the numbers<br />
observed at the start <strong>of</strong> each time interval to the<br />
equivalent number that would have occurred had the<br />
starting density <strong>of</strong> the cohort been 1000; e.g.<br />
l, = 316 X l0001843 = 375. The value <strong>of</strong> this procedure<br />
is that 1,-values can be compared between<br />
populations, or between species, since they do not<br />
depend on the actual number <strong>of</strong> individuals considered<br />
in each study. In other words an a, value <strong>of</strong> 843<br />
is peculiar to this set <strong>of</strong> observations, whereas all<br />
studies have an I, value <strong>of</strong> 1000.<br />
To consider mortality more explicitly, the st<strong>and</strong>ardized<br />
numbers dying in each time interval (d,) must be<br />
computed, being simply the difference between l, <strong>and</strong><br />
I, + ,; e.g. d, = 857 - 625 = 232. q,-the age-specific<br />
mortality-rate-has also been calculated. This relates<br />
d, to l, in proportional terms, so that, for instance,<br />
q,-the proportion <strong>of</strong> the 6-month-old individuals that<br />
die in the subsequent 3-month period-is 2501625 or<br />
0.4 q, can also be thought <strong>of</strong> as the 'chance <strong>of</strong> death',<br />
<strong>and</strong> is equivalent to (1-p,) where 'p' refers to the<br />
survival-probability considered previously.<br />
The advantage <strong>of</strong> the dx-values is that they can be<br />
summed over a period <strong>of</strong> time: the number dying in<br />
the first 9 months is do + d, + d, (= 625). The disadvantage<br />
is that the individual values give no real idea<br />
<strong>of</strong> the intensity or importance <strong>of</strong> mortality at a<br />
particular time. This is because the d,-values are<br />
larger, the more individuals there are to die. q,-Values,<br />
on the other h<strong>and</strong>, are a good measure <strong>of</strong> the intensity<br />
<strong>of</strong> mortality. Thus, in the present example, it is clear<br />
from the q, column that the mortality-rate rose<br />
consistently with increasing age; this is not clear from<br />
the d, column. The q,-values, however, have the<br />
disadvantage <strong>of</strong> not being liable to summation:<br />
q, + q, + q, does not give us the overall mortality-rate<br />
for the first 9 months. These advantages are combined,<br />
however, in the penultimate column <strong>of</strong><br />
Table 1 .l in which 'k'-values (Haldane, 1949; Varley<br />
& Gradwell, 1970) are listed. k, is defined, simply, as<br />
log,, a, - log,, a, + ,(or, equivalently, log,, a,la, + ,),<br />
<strong>and</strong> is sometimes referred to as 'killing-power'. Like q,<br />
k-values reflect the intensity or rate <strong>of</strong> mortality, <strong>and</strong>,<br />
in the present case, they increase consistently with<br />
age. But, unlike q, summing the k-values is a meaningful<br />
procedure. Thus the killing-power or k-value <strong>of</strong><br />
the first 9 months is 0.067 + 0.137 + 0.222 = 0.426,<br />
which is also the value <strong>of</strong> log,, a,-log,, a,, Note,<br />
furthermore, that the k,-values can be computed from<br />
the 1,-values as well as the a,-values; <strong>and</strong> that, like l,,
16 PART l: SINGLE-SPECIES <strong>POPULATION</strong>S<br />
indicates quite clearly an initial sharp rise in fecundity<br />
reaching a peak at 6 months, followed by a gradual<br />
decline until the death <strong>of</strong> the last individual after 2<br />
years. Figure 1.14 illustrates a single pattern in three<br />
different ways. Figure 1.14a is 'survivorship curve'-<br />
log,, l, plotted against age-while Fig. 1.14b contains<br />
two mortality curves, q, <strong>and</strong> k,, plotted against age.<br />
All show a consistent rise in the rate <strong>of</strong> mortality,<br />
leading to an increasingly rapid decline in survivorship.<br />
Of the three, Fig. l.14a-the survivorship<br />
curve-probably shows this most clearly.<br />
The use <strong>of</strong> logarithms in the survivorship curve<br />
deserves further comment. consider: for instance, the<br />
halving <strong>of</strong> a population over l" unit <strong>of</strong> time, in one case<br />
from 100 to 50 individuals, <strong>and</strong> in another case from<br />
10 to five individuals. In both cases there has been a<br />
reduction by half, i.e. the rate or probability <strong>of</strong> death<br />
per individual (usually referred to as the 'per capita<br />
rate') is the same. Nevertheless. the slo~e <strong>of</strong> an<br />
Fig. 1.13 Age-specific fecundity (B,.) for the annual meadow<br />
arithmetic survivorship curve would be - 50 in the<br />
grass Poa annua. (Data from Law, 1975.)<br />
first case but - 5 in the second. With logarithmic<br />
survivorship curves, however, the slopes in these two,<br />
k, is st<strong>and</strong>ardized <strong>and</strong> is, therefore, appropriate for equivalent cases are identical. In fact, equivalent<br />
comparing quite separate studies. k-values will be <strong>of</strong> advantages are gained by the use <strong>of</strong> k,-values: being<br />
considerable use to us in later chapters.<br />
based on logarithms, they, too, allow recognition <strong>of</strong><br />
The age-specific patterns <strong>of</strong> fecundity <strong>and</strong> mortality cases in which per capita rates <strong>of</strong> mortality are the<br />
have been plotted in Figs 1.13 <strong>and</strong> 1.14. Figure 1.13 same. Moreover, logarithms also indicate when per<br />
Fig. 1.14 (a) Age-specific<br />
survivorship (log,, I,), <strong>and</strong> (b) agespecific<br />
mortality-rates (g,) <strong>and</strong><br />
killing-powers (k,) for the annual<br />
meadow grass Poa annua. (Data<br />
from Law, 1975.)
CHAPTER 1: DESCRIBING <strong>POPULATION</strong>S 17<br />
capita rates <strong>of</strong> increase are identical. 'Log numbers'<br />
should therefore be used in preference to 'numbers'<br />
when numerical change is being plotted.<br />
1.4.2 The static life table<br />
Unfortunately, it is not always possible to monitor the<br />
dynamics <strong>of</strong> a population by constructing a 'fixed<br />
cohort' life table. It is, in fact, rarely possible with<br />
natural populations <strong>of</strong> animals, since the individuals<br />
are <strong>of</strong>ten highly mobile, highly cryptic or both. There<br />
is, however, a rather imperfect alternative, which is<br />
also illustrated diagrammatically in Fig, 1.12. It involves<br />
examining the age-structure <strong>of</strong> the whole population<br />
at one particular time, or, since these things<br />
cannot be done instantaneously, during one short<br />
'segment' <strong>of</strong> time.<br />
As an example, we can consider the results, reported<br />
by Lowe (1969), <strong>of</strong> an extensive study <strong>of</strong> the red<br />
deer (Cewus elaphus) on the small isl<strong>and</strong> <strong>of</strong> Rhum,<br />
Scotl<strong>and</strong>. Each year from 1957 onwards, Lowe <strong>and</strong> his<br />
co-workers examined every one <strong>of</strong> the deer that was<br />
shot under the rigorously controlled conditions <strong>of</strong><br />
this nature reserve. They also made extensive<br />
searches for the carcasses <strong>of</strong> deer that had died from<br />
natural causes. Thus, they had access to a large<br />
proportion <strong>of</strong> the deer that died from 1957 onwards,<br />
Deer can be reliably aged by the examination <strong>of</strong> tooth<br />
replacement, eruption <strong>and</strong> wear, <strong>and</strong> Lowe <strong>and</strong> his<br />
co-workers carried out such examinations on all <strong>of</strong><br />
the dead deer. If, for instance, they examined a<br />
6-year-old deer in 1961, they were able to conclude<br />
that, in 1957, this deer was alive <strong>and</strong> 2 years old.<br />
Thus, by examining carcasses, they were able to<br />
reconstruct the age-stmcture <strong>of</strong> the 1957 population.<br />
(Their results did not represent the total numbers<br />
alive, because some carcasses must have decomposed<br />
before they could be discovered <strong>and</strong> examined.) Of<br />
course, the age-structure <strong>of</strong> the 1957 population<br />
could have been ascertained by shooting <strong>and</strong> examining<br />
large numbers <strong>of</strong> deer in 1957; but, since the<br />
ultimate aim <strong>of</strong> the project was enlightened conservation<br />
<strong>of</strong> the deer, this method would have been<br />
somewhat inappropriate.<br />
Lowe's raw data for red deer hinds are presented in<br />
column two <strong>of</strong> Table 1.2. As expected, there were<br />
many young deer <strong>and</strong> rather fewer old deer, but we can<br />
treat these raw data as the basis for a life table only if<br />
we make a certain set <strong>of</strong> assumptions. We must assume<br />
that the 59 6-year-old deer alive in 1957 were the<br />
survivors <strong>of</strong> 78 5-year-old deer alive in 1956, which<br />
were themselves the survivors <strong>of</strong> 81 4-year-olds in<br />
1955, <strong>and</strong> so on. In other words, we must assume that<br />
the numbers <strong>of</strong> births <strong>and</strong> age-specific survival-rates<br />
had remained the same from year to year, or, equivalently,<br />
that the a, column <strong>of</strong> Table 1.2 is essentially the<br />
same as would have been obtained if we had followed a<br />
single cohort. Having made this assumption, l,, d, <strong>and</strong><br />
q, columns have been constructed. It is clear from<br />
Table 1.2, however, that our assumption is false. The<br />
'cohort' actually increases in size from years 6 to 7 <strong>and</strong><br />
14 to 15, leading to 'negative' deaths <strong>and</strong> meaningless<br />
mortality-rates. The pitfalls <strong>of</strong> constructing such 'static'<br />
life tables are, therefore, amply illustrated.<br />
Nevertheless, such data are by no means valueless.<br />
Lowe's aim was to provide a general idea <strong>of</strong> the<br />
population's age-specific survival-rate (<strong>and</strong> birth-rate)<br />
prior to 1957 (when culling <strong>of</strong> the population began),<br />
<strong>and</strong> then to compare this with the situation after<br />
1957. He was more concerned with general trends<br />
than with the particular changes occurring from one<br />
year to the next. He therefore 'smoothed out' the<br />
variations in population size between the ages <strong>of</strong> 2-8<br />
<strong>and</strong> 10-16, <strong>and</strong> created a steady decline in both <strong>of</strong><br />
these periods. The results <strong>of</strong> this process are shown in<br />
the final five columns <strong>of</strong> Table 1.2, <strong>and</strong> the mortality<br />
schedules are plotted in Fig. 1 .l 5. They do, indeed,<br />
provide the general picture Lowe required: there is a<br />
fairly gentle but increasing decline in survivorship up<br />
to year 8, followed by 2 years <strong>of</strong> very heavy mortality,<br />
<strong>and</strong> then a return to a gentler, though again increasing,<br />
decline.<br />
Moreover, by examining the internal reproductive<br />
organs <strong>of</strong> the hinds, Lowe was also able to derive a<br />
sequence <strong>of</strong> age-specific birth-rates. This is shown in<br />
the sixth column <strong>of</strong> Table 1.2, <strong>and</strong> iIlustrated in<br />
Fig. 1.16. There is, clearly, an initial pre-reproductive<br />
period <strong>of</strong> 2 years, followed by a sudden increase in<br />
birth-rate which is maintained for 3 years. There is<br />
then a period <strong>of</strong> 4 years during which the birth-rate is
18 PART 1: SINGLE-SPECIES <strong>POPULATION</strong>S<br />
Table 1.2 A static life table for red deer. (From Lowe, 1969.)<br />
-. . .. - - --<br />
Smoothed<br />
F<br />
()cam) vy (4 q, H, 1, if, 4, log,, 4 k,<br />
1 129 lflOO 116 0.116 0 lOOa 137 0.137 3.000 0.064<br />
2 114 884 8 0.009 0 863 85 13.097 2.936 0.045<br />
3 113 676 48 0.05i 0.311 778 84 0.108 2.891 0.050<br />
4 R1 625 23 0.037 0.278 694 84 0.121 2.841 0.056<br />
5 78 M15 148 0.245 0.302 610 84 0.137 2.785 0.064<br />
6 59 457 - 47 0.m 526 84 0.159 2.721 0.076<br />
7 6'1 504 78 0.155 0,476 442 85 0.190 2,645 0.092<br />
8 55 426 232 0.545 0.358 357 176 0.502 2.553 0.295<br />
9 25 194 124 0.639 0.447 181 122 0.672 2.258 0.487<br />
10 9 70 8 0.114 0,289 59 8 0.141 1.773 O.Oh3<br />
11 8 h2 R 0.129 0.283 51 9 0.165 1.708 0.085<br />
12 7 54 38 0.704 0.285 42 X 0.198 1,623 0.092<br />
13 2 16 8 0.5110 0.283 34 9 0.247 1.531 0.133<br />
14 1 8 - 23 - 0.282 25 8 0.329 1.398 0.168<br />
15 4 31 15 0.484 0.285 17 8 0.492 1.230 0.276<br />
16 I 16 - - 0.284 9 9 1.m 0.954 -<br />
higher still, followed by a return to the previous level.<br />
It is interesting to note that the period <strong>of</strong> high<br />
birth-rates is immediately followed by a period <strong>of</strong> high<br />
mortality-rates, an apparent 'cost <strong>of</strong> reproduction'.<br />
1.4.3 Resume<br />
Conventiond (as opposed to diagrmatic) life tables<br />
are the medium through which age-specific schedules<br />
Fig. 1.15 (a) Age-specific<br />
survivorship (log,, l,), <strong>and</strong> (b) agespecific<br />
mortality-rates (qx) <strong>and</strong><br />
killing-powers (k,) for the red deer,<br />
Cervus elaphus. (Data from Lowe,<br />
1969.)
CHAPTER 1: DESCRIBING <strong>POPULATION</strong>S 19<br />
<strong>of</strong> death (<strong>and</strong> birth) can be constructed, <strong>and</strong> it is<br />
obvious that the compilation <strong>of</strong> such i~lformation is<br />
vital if the dynamics <strong>of</strong> populations are to be understood.<br />
These life tables can be <strong>of</strong> two quite separate<br />
types (see Fig. 1.12).<br />
The fixed cohort (or 'dynamic', or 'horizontal') life<br />
table is derived by actually following a cohort <strong>of</strong><br />
individuals from birth to extinction. It provides reliable<br />
information on that cohort; but its construction may<br />
be beset by practical difficulties, which in certain cases<br />
will be insuperable.<br />
The static (or 'time-specific', or 'vertical') life table,<br />
conversely, is derived by estimating the age structure<br />
<strong>of</strong> a population at one point in time. It is equivalent to<br />
a fixed cohort life table only when the survival-rates in<br />
the population are constant. Otherwise the static life<br />
table compounds <strong>and</strong> confuses two quite separate<br />
things: the age-specific changes in birth- <strong>and</strong><br />
mortality-rate, <strong>and</strong> the year-to-year variations in these<br />
rates in the past. Nevertheless, it can provide a general<br />
idea <strong>of</strong> age-specific birth- <strong>and</strong> mortality-rates in a<br />
population, which is particularly valuable when a fixed<br />
cohort life table cannot be derived.<br />
It should also be stressed that in either case it is<br />
<strong>of</strong>ten necessary to collect life-table data over a period<br />
<strong>of</strong> time for a number <strong>of</strong> generations. This allows the<br />
natural variability in the rates <strong>of</strong> birth <strong>and</strong> survival to<br />
be monitored <strong>and</strong> assessed.<br />
1.5 Some generalizations<br />
One <strong>of</strong> the reasons for using life tables to monitor these<br />
age-specific rates is that this allows us to discover<br />
patterns <strong>of</strong> birth <strong>and</strong> mortality which are repeated in a<br />
variety <strong>of</strong> species in a variety <strong>of</strong> circumstances. In<br />
turn, this allows us, hopefully, to uncover the common<br />
properties shared by these various populations,<br />
leading ultimately to a deeper underst<strong>and</strong>ing <strong>of</strong> population<br />
dynamics in general. Age-specific mortality-rates<br />
were classified by Pear1 (1928), <strong>and</strong> his classification is<br />
illustrated in Fig. 1.17 in the form <strong>of</strong> survivorship<br />
curves. It is very difficult to generalize about the shape<br />
<strong>of</strong> survivorship curves, not least because they are a<br />
reflection <strong>of</strong> the particular habitat conditions in which<br />
the population was observed, <strong>and</strong> the actual densities<br />
<strong>of</strong> populations. Figure 1.18 illustrates the range <strong>of</strong><br />
curves for a s<strong>and</strong> dune annual plant in natural<br />
populations in similar habitat varying in density <strong>and</strong><br />
Fig. 1.16 Age-specific fecundity for the red deer Cervus<br />
elaphus. (Data from Lowe, 1969.)<br />
Fig. 1.17 Hypothetical st<strong>and</strong>ard survivorship curves, (After<br />
Pearl, 1928.) For further discussion, see text.
20 PART l: SINGLE-SPECIES <strong>POPULATION</strong>S<br />
Fig. 1.18 Survivorship curves in<br />
natural populations <strong>of</strong> Erophila verna<br />
occurring at differing densities<br />
( X 103 m-2) (a) 1-2; (b) 5-10; (c) 15-<br />
10; (d) 35-50; <strong>and</strong> (e) >50. (After<br />
Symonides, 1983 .)<br />
we can see that a spectrum <strong>of</strong> curves may occur.<br />
However, Pearl argued that we can recognize three<br />
broad types. The first-epitomized perhaps, by humans<br />
in the developed world or cosseted animals in a<br />
zoo-describes the situation in which mortality is<br />
concentrated at the end <strong>of</strong> the maximum life span. In<br />
the second, the probability <strong>of</strong> death remains constant<br />
with age, leading to a linear decline in survivorship.<br />
This typically occurs in the buried seed populations <strong>of</strong><br />
plants. In the third type there is extensive early<br />
mortality, but those that remain have a high rate <strong>of</strong><br />
survival subsequently. This is true, for instance, <strong>of</strong><br />
many marine fish which produce millions <strong>of</strong> eggs <strong>of</strong><br />
which very few survive to become adults.<br />
The difficulty with Pearl's generalizations is that as a<br />
cohort ages it may well follow, successively, more than<br />
one type <strong>of</strong> survivorship curve. It is now known, for<br />
instance, that for many grassl<strong>and</strong> plants the survivorship<br />
curve <strong>of</strong> seedlings establishing into adults is type<br />
3, whereas that <strong>of</strong> the adults themselves is type 2.<br />
Generalizations regarding age-specific birth-rates<br />
are, in many ways, more straightforward. The most<br />
basic distinction, perhaps, is between species which<br />
are semelparous, reproducing only once, <strong>and</strong> those<br />
which are iteroparous, reproducing many times. In the<br />
botanical literature, these terns are referred to as<br />
monocarpic <strong>and</strong> polycarpic, respectively. In either case<br />
there is likefy to be a pre-reproductive period, which can,<br />
<strong>of</strong> course, vary in length (cf. Figs 1.16 & 1.19). Agespecific<br />
fecundity may then rise, either to a peak (P,<br />
annua, see Fig. 1.13), or to a plateau (the deer in<br />
Fig. 1.19) or tend to increase with age in trees as size<br />
increases (Fig. 1.20). As Fig. 1.16 shows, however,<br />
many species combine elements <strong>of</strong> the two in a more<br />
complex pattern.<br />
Fig, 1.19 Age-specific fecundity for white-tailed deer<br />
Odocoileus hemionus in Michigan. (Data from Eberhardt,<br />
1960.)
CHAPTER 1: DESCRIBING <strong>POPULATION</strong>S 21<br />
Fig. 1.20 Age-dependent seed production in the tree palm<br />
Astrocaryurn mexicanurn. (After Sarukhan, 1980.)<br />
Finally, certain restricted generalizations can be<br />
made regarding population size itself. It is indisputable<br />
that all populations vary in size: temporal fluctuations<br />
are the universal rule, But at the same time it is<br />
equally true that these fluctuations are usually limited<br />
in amplitude. Populations rarely increase in size so<br />
much that they utterly overrun their environment;<br />
<strong>and</strong> even localized extinctions, though by no means<br />
unknown, are also comparatively rare. Thus, population<br />
size, <strong>and</strong> the processes affecting it, are variablebut<br />
<strong>of</strong> limited variability. One <strong>of</strong> the major aims in the<br />
study <strong>of</strong> population dynamics is to underst<strong>and</strong> these<br />
limitations, <strong>and</strong> this is the topic to which we shall turn<br />
in the next chapter. Before doing so we must first<br />
consider the implications <strong>of</strong> the ways in which some<br />
plants <strong>and</strong> animals grow for our means <strong>of</strong> describing<br />
populations.<br />
1.6 The modular growth <strong>of</strong> organisms<br />
Having concentrated on what different types <strong>of</strong> species<br />
population may have in common, we now turn to one<br />
crucial respect in which they may differ. A major<br />
distinction amongst species <strong>of</strong> both plants <strong>and</strong> animals<br />
lies in the organization <strong>and</strong> differentiation <strong>of</strong> tissues.<br />
This fundamental distinction divides organisms according<br />
to their growth form into those that are<br />
unitary <strong>and</strong> those that are modular (Harper & Bell,<br />
1979; Harper, 1981). Most animals are unitary organisms.<br />
Development from the zygote (the fertilized egg)<br />
through to the adult involves an irreversible process <strong>of</strong><br />
growth <strong>and</strong> tissue differentiation leading to organ<br />
development according to a highly regulated schedule.<br />
Conversely, most plants are modular. Growth <strong>and</strong><br />
differentiation are normally initiated in 'meristems' at<br />
the apices <strong>of</strong> shoots <strong>and</strong> roots (Esau, 1953). Cell<br />
divisions occur in these meristems, <strong>and</strong> they result in<br />
root <strong>and</strong> shoot elongation <strong>and</strong> the laying down <strong>of</strong><br />
further meristems, Growth from meristems in this way<br />
unaccompanied by any further differentiation leads to<br />
a repetitive or reiterative modular structure in the<br />
plant body (see Gottleib, 1984 for a succinct discussion).<br />
Botanically, a 'module' is an axis (essentially a<br />
length <strong>of</strong> tissue) with an 'apical meristem' at its distal<br />
end. The axis is subdivided by nodes at which leaves,<br />
axillary meristems <strong>and</strong> vegetative outgrowths (e.g.<br />
tendrils) may occur. If <strong>and</strong> when the apical meristem<br />
differentiates into a terminal flower, extension growth<br />
<strong>of</strong> the axis ceases.<br />
Modular organisms increase in size by a programme<br />
<strong>of</strong> growth <strong>and</strong> development that is structurally <strong>and</strong><br />
functionally repetitive; unitary organisms by contrast<br />
do not. The distinction, however, is not simply one<br />
between animals <strong>and</strong> plants. In colonial animals such<br />
as corals, hydroids, bryozoans <strong>and</strong> colonial ascidians<br />
similar modular identities can be seen (Rosen, 1979).<br />
We saw in section 1.3.5 that both corals <strong>and</strong> buttercups<br />
increased in size through the addition <strong>of</strong> successive<br />
segments or modular units. Thus, put simply, the<br />
buttercup becomes larger as additional stolons <strong>and</strong><br />
ramets are produced while the coral becomes larger as<br />
polyps grow <strong>and</strong> bud. Each increment in growth can<br />
be measured by the number <strong>of</strong> modules produced in a<br />
period <strong>of</strong> time. This feature has proved invaluable to<br />
plant demographers in the construction <strong>of</strong> static life<br />
tables; since in some species at: least, the age <strong>of</strong> an<br />
individual plant may be deduced from persisting<br />
morphoIogical or anatomical features. The method<br />
has been used in investigating survivorship in the<br />
Mexican tree palm (Astrocaryum mexicanum) <strong>and</strong> also<br />
in examining clonal growth in rhizomatous species.<br />
Polygonatum verticilatum is a herb <strong>of</strong> Sc<strong>and</strong>inavian <strong>and</strong><br />
Danish forests which annually produces an above-
22 PART 1 : SINGLE-SPECIES <strong>POPULATION</strong>S<br />
-<br />
I<br />
number <strong>of</strong> rhizome segments<br />
accumulated<br />
0 number <strong>of</strong> rhizome segments<br />
formed per year<br />
number <strong>of</strong> above ground<br />
shoots per year<br />
Branch<br />
Segment<br />
Scar <strong>of</strong><br />
above ground<br />
Renewal segment<br />
9<br />
+Terminal buds<br />
branch branch segment<br />
buds segment<br />
Fig. 1.21 (a) The morphology <strong>of</strong> the rhizomatous perennial<br />
Polygonaturn verticilatum. (b) Exponential growth <strong>of</strong> rhizome<br />
segments in a clone <strong>of</strong> P. verticilatum. (After Tybjerg &<br />
Vestergaard, 1992.)<br />
ground shoot that dies in the autumn leaving a distinct<br />
below-ground scar on the rhizome. The growth form<br />
enabled Tybjerg <strong>and</strong> Vestergaard (1992) to be able to<br />
age an excavated rhizome system (Fig. 1.21a) retrospectively<br />
over a 20-year period. Careful mapping<br />
indicated that direction <strong>of</strong> growth was centrifugal<br />
from the initial (seedling) starting point <strong>and</strong> the<br />
cumulative number <strong>of</strong> rhizome segments increased<br />
exponentially (Fig. l.2lb). This arose because the<br />
rhizomes bifurcated in a systematic manner with the<br />
number <strong>of</strong> new branches increasing gradually as the<br />
plant aged.<br />
Three important demographic consequences arise<br />
from recognizing the modular construction <strong>of</strong> higher<br />
terrestrial plants <strong>and</strong> colonial animals. The first is that<br />
the addition <strong>of</strong> modules tends to lead to a branched<br />
structural form. Generally, this is because <strong>of</strong> the<br />
placement <strong>of</strong> meristems in plants at acute angles to<br />
the main axis, which continue growth when extension<br />
<strong>of</strong> the parental axis ceases. The exact architecture <strong>of</strong><br />
the organism will depend on: (i) whether modules vary<br />
in form, as in the short <strong>and</strong> long branches <strong>of</strong> trees or<br />
the vegetative <strong>and</strong> generative (i.e. reproductive) polyps<br />
<strong>of</strong> hydroids; (ii) their rate <strong>of</strong> production; <strong>and</strong> (iii) their<br />
position relative to one another. Nevertheless, the<br />
overall form <strong>of</strong> the organism is a colony <strong>of</strong> repeating<br />
modules. The form is important demographically<br />
since size <strong>and</strong> shape will influence the nature <strong>of</strong><br />
interactions amongst static organisms (Horn, 1971).
CHAPTER 1: DESCRIBING <strong>POPULATION</strong>S 23<br />
Developing 'shoot' group<br />
Direction <strong>of</strong> growth<br />
"U l<br />
Direction<br />
<strong>of</strong> growth<br />
\ Meristem Module 'type 2'<br />
Fig. 1.22 A schematic view <strong>of</strong> modular growth in a plant generating either 'type l' or 'type 2' modules. Module 'type<br />
that displays two types <strong>of</strong> module in its constructional 2' is a horizontal stem (rhizome or stolon) bearing a<br />
organization. Natural cloning results from the meristem with the potential to give rise to a 'type 1'<br />
fragmentation <strong>of</strong> either type <strong>of</strong> module. Module 'type 1' is a module, axillary meristems <strong>and</strong> roots. (After Harper & Bell,<br />
'shoot' bearing foliage leaves <strong>and</strong> one meristem capable <strong>of</strong> 1979.)<br />
Fig. 1.23 (a) Bulb division <strong>and</strong> sequential<br />
development <strong>of</strong> daughter ramets in Alfium<br />
tricoccum. (After Nault & Gagnon, 1993.)<br />
(b) Rhizomatous growth in Carex bigeluwii. (After<br />
Jonsdottir & Callaghan, 1988.)
24 PART 1: SINGLE-SPECIES <strong>POPULATION</strong>S<br />
Whether an individual creeping plant, for instance,<br />
presents a compact as opposed to diffuse arrangement<br />
<strong>of</strong> shoots may have important consequences in competitive<br />
interactions with neighbours as will the<br />
branching structure influence interactions amongst<br />
the crowns <strong>of</strong> trees.<br />
Second, removal <strong>of</strong> modules (through damage,<br />
herbivory or predation for instance) may harm an<br />
organism but not kill it. A modular architectural<br />
arrangement <strong>of</strong> relatively autonomous meristems allows<br />
lost parts to be reiterated, The potential for this<br />
very much depends upon the degree <strong>of</strong> permanent<br />
physiological <strong>and</strong> morphological differentiation that<br />
has already occurred. Removal <strong>of</strong> vegetative tillers<br />
from a grass plant will <strong>of</strong>ten lead to the reiteration <strong>of</strong><br />
the tiller module; removal <strong>of</strong> an inflorescence (a<br />
module that has differentiated into a sexually generative<br />
structure) may not-<strong>of</strong>ten because <strong>of</strong> the absence<br />
<strong>of</strong> further growth points. Conversely, in unitary organisms<br />
although tissue regeneration does occur, removal<br />
<strong>of</strong> a whole organ will precipitate death.<br />
A third consequence arises from the fact that<br />
modularity affords the opportunity <strong>of</strong> natural cloning<br />
(Harper, 1985). Natural cloning arises when a genet<br />
fragments <strong>and</strong> the ramets establish into physiologically<br />
independent parts (Fig. 1.22). This is only possible<br />
when rneristems at nodes retain totipotency: the<br />
ability to produce both shoots <strong>and</strong> roots. Fragmentation<br />
may arise through physical agencies (e.g. s<strong>and</strong><br />
movement in the s<strong>and</strong> sedge Carex arenaria), the<br />
trampling <strong>and</strong> grazing <strong>of</strong> herbivores (in rhizomatous<br />
grasses), or it may be genetically determined (as in<br />
Ranunculus repens; Bell & Tomlinson, 1980). The<br />
important demographic point is that whatever the<br />
agency, it may lead to a colony <strong>of</strong> physiologically<br />
independent plants <strong>of</strong> the same genotype which are<br />
potential competitors. The extent to which the ramets<br />
<strong>of</strong> a clone constitute truly independent individuals<br />
when they retain apparent physical connections requires<br />
careful scrutiny. In some cases the true disjunction<br />
<strong>of</strong> individuals is an agelsize-dependent process (as<br />
in Allium tricoccum; Fig. 1.23a), but is more problematic<br />
in perennial grasses (Fig. 1.23b).<br />
These observations on modularity have prompted<br />
the suggestion that the fundamental equation <strong>of</strong><br />
population biology (equation 1.1 above) applies not<br />
only at the level <strong>of</strong> the genet (expressed through the<br />
growth <strong>of</strong> the clone a whole) but also at the (lower)<br />
modular level (Harper, 1977). Harper <strong>and</strong> Be11 (1 979)<br />
argue then that the study <strong>of</strong> the dynamics <strong>of</strong> modules<br />
themselves is an essential component in describing the<br />
population ecology <strong>of</strong> modular organisms <strong>and</strong> can be<br />
applied down to the level <strong>of</strong> individual leaves (Harper,<br />
1989). Demographic approaches to modular dynamics<br />
have employed the same techniques that we have<br />
examined earlier for populations <strong>of</strong> unitary organisms.<br />
Thus, Fig. 1.24 shows a diagrammatic life table for a<br />
population <strong>of</strong> meristems on a Fuchsia plant. As the<br />
plant grows, some meristems develop into shoots<br />
which may be vegetative (branches bearing new<br />
meristems) or generative (branches bearing inflores-<br />
Fig. 1.24 Transitions occurring over a time period amongst<br />
meristems in Royal Velvet, a cultivar <strong>of</strong> Fuchsia.<br />
Measurements were made 75 days after plmting on the<br />
main shoot when plants were growing exponentially. At<br />
this stage <strong>of</strong> growth a constant fraction <strong>of</strong> vegetative<br />
meristerns become vegetative branches which in turn<br />
produce one vegetative <strong>and</strong> one flower meristem. (Data<br />
from Porter, 1983a.)
CHAPTER 1: DESCRIBING <strong>POPULATION</strong>S 25<br />
Fig. 1.25 Flux in tillers in Phleum pratense: (a) the total<br />
number <strong>of</strong> living tillers; (b) survivorship curves <strong>of</strong> successive<br />
monthly cohorts <strong>of</strong> tillers; (c) tiller age structure at<br />
successive monthly periods (each ordinate division is 1Wo).<br />
Data were gathered from 40 plants each grown from seed<br />
in soil in separate 20-cm diameter pots. (From Langer,<br />
1956; after White, 1980.)<br />
cences), some meristems remain dormant, whilst<br />
othes abort. The transitions given in Fig. 1.24 are<br />
those occurring during growth in an unrestricted<br />
environment once plants have started flowering.<br />
Death <strong>of</strong> meristems, whether vegetative or flowering,<br />
is absent <strong>and</strong> only occurs when flowers (the products<br />
<strong>of</strong> generative meristems) senesce.<br />
Flux in modules, however, can be much more<br />
noticeable in other species. Langer (1956) followed the<br />
fate <strong>of</strong> grass tillers on individual timothy plants<br />
(Phleum pratense) over a period <strong>of</strong> 2 years. His data<br />
(Fig. 1.25) illustrate that tiller births <strong>and</strong> deaths are an<br />
intrinsic feature <strong>of</strong> the life <strong>of</strong> an individual plant.<br />
Whilst the size <strong>of</strong> cohorts recruited each month was<br />
seasonally dependent, the pattern <strong>of</strong> mortality in<br />
cohorts was remarkably similar, following a type 1<br />
survivorship curve. This mortality mainly resulted<br />
from the 'monocarpic' nature <strong>of</strong> tillers (the production<br />
<strong>of</strong> an inflorescence on a tiller is followed inevitably by<br />
tiller death) but also occurred amongst non-generative<br />
tillers when recruitment <strong>of</strong> tillers was at its highest in<br />
JuneIJuly. Tillers formed in April <strong>and</strong> May were either<br />
annual (flowering in the following August <strong>and</strong> September)<br />
or biennial, remaining vegetative over winter<br />
<strong>and</strong> flowering the next year. This resulted in the<br />
stepped survivorship curves seen in Fig. 1.25.
26 PART l : SINGLE-SPECIES <strong>POPULATION</strong>S<br />
Fig. 1.26 The interrelationships between states <strong>of</strong> seed<br />
dormancy in a buried seed population. Arrows indicate<br />
direction <strong>of</strong> transition according to definitions <strong>of</strong> dormancy<br />
state (see text for details). (After Sagar & Mortimer, 1976.)<br />
In conclusion, it is clear that in describing a<br />
population we must carefully define the individual.<br />
This in part will depend on the nature <strong>of</strong> the scientific<br />
enquiry, but more <strong>of</strong>ten than not it will be determined<br />
by the growth form <strong>of</strong> the organism.<br />
1.7 Buried seed banks<br />
Although we have referred in passing to the existence<br />
<strong>of</strong> buried seed banks (see section 1.5), it is important to<br />
recognize that populations <strong>of</strong> both terrestrial <strong>and</strong><br />
aquatic plants may differ from animal populations in<br />
this additional respect. In many plant species, a very<br />
large fraction <strong>of</strong> the total population may be present as<br />
dormant individuals within the soil pr<strong>of</strong>ile, such that<br />
the number <strong>of</strong> live plants above ground gives a very<br />
poor reflection <strong>of</strong> the true population size.<br />
Thompson <strong>and</strong> Grime (1979) distinguished between<br />
two classes <strong>of</strong> species possessing buried seed banks:<br />
those with seeds that have limited longevity, specifically<br />
no longer than a year following dispersal <strong>and</strong><br />
<strong>of</strong>ten no longer than the species generation timetransient<br />
banks; <strong>and</strong> those in which a proportion <strong>of</strong><br />
seeds survives in a dormant state for more than one<br />
generation time-persistent banks. Seed survival for<br />
long periods in the soil is controlled by three types <strong>of</strong><br />
dormancy mechanism (Harper, 1977). Enforced dormancy<br />
arises where there is the absence <strong>of</strong> at least one<br />
exogenous factor. Thus insufficient water availability<br />
or burial at depth away from light prohibits germination<br />
which occurs on removal <strong>of</strong> the limiting factor(s).<br />
Conversely, innate dormancy is an endogenous physiological<br />
or morphological condition possessed by a seed<br />
at the time <strong>of</strong> dispersal from the mother plant <strong>and</strong><br />
which is broken by a subsequent appropriate cue-for<br />
instance passage through the gut <strong>of</strong> an animal or<br />
experience <strong>of</strong> a temperature shift. Finally induced<br />
dormancy is a responsive form <strong>of</strong> dormancy that arises<br />
as a consequence <strong>of</strong> an environmental stimulus.<br />
Release from this form <strong>of</strong> dormancy arises on receipt<br />
<strong>of</strong> a further stimulus which may well be <strong>of</strong> a seasonal<br />
nature (Roberts, 1972). Thus dormancy induced by<br />
low soil temperatures in autumn that herald winter<br />
may be broken by elevated temperatures in spring.<br />
The dormancy structure <strong>of</strong> a buried seed population<br />
may be classified in this tripartite manner as illus-<br />
Fig. 1.27 Seasonal changes in<br />
induced seed dormancy in two<br />
annuals; (a) Arabidopsis thaliana, <strong>and</strong><br />
(b) Ambrosia artemisifolia. Buried<br />
seeds were retrieved each month<br />
<strong>and</strong> germinated at their respective<br />
optimum temperature. (After Baskin<br />
& Baskin, 1980, 1983.)
CHAPTER l: DESCRIBING <strong>POPULATION</strong>S 27<br />
Year<br />
Fig. 1.28 The decrease in the number <strong>of</strong> viable dormant<br />
seeds (a four species mixture) buried in soil, disturbed at<br />
diiering frequencies throughout the year. Note numbers<br />
are presented on a logarithmic scale. 0, undisturbed soil;<br />
0, soil cultivated twice a year; 0, soil cultivated four times<br />
a year; H, soil cultivated under a cropping rotation. (After<br />
Roberts & Dawkins, 1967.)<br />
trated in Fig. 1.26 <strong>and</strong> it is possible with the appropriate<br />
techniques to estimate the proportion in each<br />
category (Baskin & Baskin, 1980). Repeated sampling<br />
has shown that annual cycles in dormancy status<br />
occur in viable seed populations (Fig. 1.27) <strong>and</strong> if there<br />
is loss by gemination <strong>and</strong> no recruitment <strong>of</strong> newly<br />
dispersed seed, then the seed bank declines. Meticulous<br />
studies have shown that the rate <strong>of</strong> this loss tends<br />
to be constant (Fig. 1.28) for a particular habitat when<br />
viewed on an annual basis although losses may be<br />
concentrated at particular seasons <strong>of</strong> the year. In some<br />
temperate plants the longevity <strong>of</strong> buried seed may be<br />
considerable-in poppies for instance in excess <strong>of</strong> 80<br />
years. In contrast, in many tropical species it is <strong>of</strong>ten<br />
restricted to 15-20 months (Garwood, 1989).
Chapter 2<br />
2.1 The nature <strong>of</strong> intraspecific<br />
competition<br />
In order to examine further the way in which the<br />
properties <strong>of</strong> individuals determine population dynamics,<br />
we will have to consider a proposition which<br />
we have not mentioned explicitly so far, but which is<br />
generally taken for granted: that each individual<br />
within a population affects, <strong>and</strong> is affected by, other<br />
individuals within the population. Consider, for instance,<br />
a thriving population <strong>of</strong> grasshoppers (all <strong>of</strong> the<br />
same species) in a field <strong>of</strong> grass. Adult males attract<br />
<strong>and</strong> court adult females by 'stridulating': they rub the<br />
insides <strong>of</strong> their hind legs against the outsides <strong>of</strong> their<br />
hardened forewings to produce a species-specific<br />
'song'. If a male manages to attract, court <strong>and</strong><br />
inseminate a female, he will have made some contribution<br />
to the next generation; <strong>and</strong> the more females<br />
he manages to inseminate, the greater this contribution<br />
will be. The most successful or fittest males within<br />
a population are those which make the greatest<br />
contribution. A solitary male amongst many females<br />
in the population might eventually inseminate every<br />
one <strong>of</strong> them. But if there are several males in the<br />
population, then they will be competing with one<br />
another for the females' attentions, <strong>and</strong> each will<br />
inseminate fewer females than he would have done<br />
had he been alone. The more males there are, the<br />
more intense this intraspecific competition will be;<br />
<strong>and</strong> the general effect will be to reduce the males'<br />
contributions to the next generation.<br />
Subsequently, the inseminated grasshoppers will<br />
have eggs to lay. For this they require bare soil, which<br />
may, in a grassy field, be quite rare. More to the point,<br />
they require bare soil not already occupied by another<br />
female. They can increase their contribution to the<br />
next generation by increasing the number <strong>of</strong> eggs they<br />
lay. But the more competing females there are, the<br />
longer it will take each one to find an appropriate site,<br />
<strong>and</strong> the fewer eggs she will lay per unit <strong>of</strong> time.<br />
Moreover, along with this increased expenditure <strong>of</strong><br />
time will go an increased expenditure <strong>of</strong> energy. This<br />
will lead to a decrease in the energy available for egg<br />
development, <strong>and</strong> also a decrease in general viability,<br />
leading to a possible shortening <strong>of</strong> total life span.<br />
These, in their turn, will lead to a decrease in the<br />
number <strong>of</strong> eggs laid; <strong>and</strong> the more competing females<br />
there are, the greater this decrease will be.<br />
Of course, in order to live, grasshoppers (male <strong>and</strong><br />
female) must consume food (grass) to provide themselves<br />
with energy, but they must also expend energy<br />
in the process <strong>of</strong> finding <strong>and</strong> consuming the food. Each<br />
grasshopper will frequently find itself at some spot<br />
where there had previously been a palatable blade <strong>of</strong><br />
grass-before that is, some other grasshopper ate it.<br />
Whenever this happens the first grasshopper must<br />
move on; it must expend more energy than it would<br />
otherwise have done before it takes in food. Once<br />
again, this increased energy expenditure will lead on<br />
the one h<strong>and</strong> through increased mortality <strong>and</strong> on the<br />
other h<strong>and</strong> through decreased rates <strong>of</strong> development,<br />
to a decreased contribution to the next generation. So<br />
the more competitors there are, the more 'moving on'<br />
each grasshopper will have to do, <strong>and</strong> the greater the<br />
decrease in contribution will be.<br />
Considering the same hypothetical ecosystem, we<br />
can turn now to the grass itself. (We will assume, for<br />
simplicity, that it is all <strong>of</strong> one species, although in<br />
practice this is very unlikely to be so.) The contribution<br />
<strong>of</strong> an individual grass plant to the next generation<br />
will be dependent on the number <strong>of</strong> its progeny which<br />
eventually develop into reproductive adults themselves.<br />
An isolated seedling in fertile soil will have a<br />
very good chance <strong>of</strong> developing to reproductive maturity,<br />
<strong>and</strong> will also be likely to reproduce vegetatively,<br />
consisting (as a result) <strong>of</strong> multiple copies <strong>of</strong> the<br />
simplest plant form. However, a seedling which is<br />
closely surrounded by neighbours (shading it with
CHAPTER 2: INTRASPECIFIC COMPETITION 29<br />
their leaves <strong>and</strong> depleting its soil with their roots) will<br />
be very unlikely to survive at all, <strong>and</strong> will almost<br />
certainly be small <strong>and</strong> simple. The more competing<br />
individuals there are, the more likely it is that seedlings<br />
will find themselves in the latter, rather than the<br />
former, situation. Increases in density will, therefore,<br />
lead to decreases in the contributions <strong>of</strong> individuals to<br />
the next generation.<br />
2.2 Three characteristics <strong>of</strong><br />
intraspecif ic competition<br />
Certain common features <strong>of</strong> intraspecific competition<br />
have obviously emerged. The first <strong>of</strong> these is that the<br />
ultimate effect <strong>of</strong> competition is a decreased contribution<br />
<strong>of</strong> individuals to the next (or, in fact, to all future)<br />
generations; a decrease, that is, from the potential<br />
contribution that the individual would have made had<br />
there been no competitors.<br />
In some cases-stridulating males competing for<br />
females, for instance-the connection between competition<br />
<strong>and</strong> contributions to future generations is<br />
obvious <strong>and</strong> direct. With grass seedlings competing for<br />
growth resources, however, or with grasshoppers<br />
competing for food, the connection is slightly less<br />
direct, since competition leads to a decrease in survivorship<br />
<strong>and</strong>/or fecundity. Nevertheless, in terms <strong>of</strong><br />
ultimate effects, male grasshoppers competing for<br />
females, seedlings competing for light <strong>and</strong> grasshoppers<br />
competing for food are all essentially equivalent.<br />
Intraspecific competition acts more or less directly on<br />
either survivorship or fecundity, or on both, but in all<br />
cases it decreases contributions to future generations.<br />
From a practical point <strong>of</strong> view, however, this is not<br />
quite enough. Competition must not only be likely; it<br />
must also manifest itself in measurable decreases in<br />
survivorship, fecundity or some other, less direct<br />
characteristic. Only then have we the right to conclude<br />
that it is occurring.<br />
The second common feature <strong>of</strong> intraspecific competition<br />
is that the resource for which the individuals are<br />
competing must be in limited supply. Oxygen, for<br />
instance, although absolutely essential, is not something<br />
for which grasshoppers or grass plants need<br />
compete. Nor necessarily is space, food or any <strong>of</strong> the<br />
other resources we have discussed so far. They are<br />
only competed for if they are in limited supply.<br />
The third feature <strong>of</strong> intraspecific competition is<br />
reciprocity. In other words the competing individuals<br />
within a population are all essentially equivalent (in<br />
contrast to the situation <strong>of</strong> a predator eating its prey, in<br />
which the predator is inherently the inflictor <strong>of</strong> the<br />
adverse effect <strong>and</strong> the prey inherently the receiver). Of<br />
course, in any particular case intraspecific competition<br />
may be relatively one-sided: the strong early seedling<br />
shading the stunted late one; the 'resident' egg-laying<br />
grasshopper causing the later arrival to move on.<br />
However, despite this, because the earlyllate or<br />
residentlnon-resident roles might easily be reversed,<br />
the competing individuals are inherently equivalent.<br />
2.3 Density-dependence:<br />
a fourth characteristic<br />
The fourth <strong>and</strong> final feature <strong>of</strong> intraspecific competition<br />
is that the effect <strong>of</strong> competition on any individual<br />
(i.e. the probability <strong>of</strong> an individual being adversely<br />
affected) is greater, the greater the number <strong>of</strong> competitors<br />
there are. The effects <strong>of</strong> intraspecific competition<br />
are, therefore, said to be density-dependent. Not<br />
surprisingly, they can be contrasted with densityindependent<br />
effects, yet the point <strong>of</strong> contrast is very<br />
<strong>of</strong>ten confused. This can be avoided by reference to<br />
Fig. 2.1 (after Solomon, 1969). In Fig. 2.la the number<br />
<strong>of</strong> deaths is dependent on density (<strong>and</strong>, indeed,<br />
increases with density) in each <strong>of</strong> the four lines, but <strong>of</strong><br />
these four, only three show density-dependent effects.<br />
In the fourth, the proportion <strong>of</strong> the population dying (or<br />
the probability <strong>of</strong> an individual dying) remains constant,<br />
even though the number dying increases with<br />
density: the rate <strong>of</strong> mortality is density-independent.<br />
Figure 2.lb, which portrays precisely the same situation<br />
as Fig. 2.la, makes this abundantly clear. Of<br />
course, in reality, the points leading to the densityindependent<br />
plots will not all lie exactly on the straight<br />
lines. They may, in fact, be very widely spread on<br />
either side <strong>of</strong> them. However, this would not alter their<br />
essential feature: with density-independent mortality,<br />
there is no tendency for the mortality-rate to increase<br />
with increasing density. The analogous situation for
30 PART l : SINGLE-SPECIES <strong>POPULATION</strong>S<br />
Fig. 2.1 Density-dependent <strong>and</strong> density-independent death<br />
(a) <strong>and</strong> (b), <strong>and</strong> birth (c) <strong>and</strong> (d). The vertical axes in (a) <strong>and</strong><br />
(c) are numbers; those in (b) <strong>and</strong> (d) are rates. (After<br />
Solomon, 1969.)<br />
fecundity is illustrated in Figs 2.lc <strong>and</strong> 2.ld.<br />
Intraspecific competition <strong>and</strong> density-dependence<br />
are obviously bound closely together; whenever there<br />
is intraspecific competition, its effects-whether on<br />
survival, fecundity or a combination <strong>of</strong> the two-is<br />
density-dependent. However, not all densitydependent<br />
effects are the result <strong>of</strong> intraspecific competition.<br />
Chapter 4 on interspecific competition, <strong>and</strong><br />
Chapter 5 on predation, parasitism <strong>and</strong> herbivory will<br />
make this quite clear. Nevertheless, all densitydependent<br />
effects do share a tendency to regulate<br />
population size.<br />
We have already suggested (in Chapter 1) that such<br />
regulation is extremely widespread, <strong>and</strong> the subject<br />
will be examined in greater depth in Chapter 6; but<br />
three pertinent comments can be made now. First,<br />
'regulation' refers to the ability to decrease the size <strong>of</strong><br />
populations which are above a particular level, but to<br />
allow an increase in the size <strong>of</strong> populations below that<br />
level. This particular population level will, therefore,<br />
be a point <strong>of</strong> equilibrium. Populations below it increase,<br />
populations above it decrease, <strong>and</strong> populations<br />
actually on it neither increase nor decrease: popula-
CHAPTER 2: INTRASPECIFIC COMPETITION 31<br />
Fig. 2.2 Population regulation with (a) density-independent<br />
birth <strong>and</strong> density-dependent death, (b) density-dependent<br />
birth <strong>and</strong> density-independent death, <strong>and</strong> (c) densitydependent<br />
birth <strong>and</strong> density-dependent death. Population<br />
size increases when birth-rate exceeds death-rate below the<br />
carrying capacity, K; <strong>and</strong> decreases when death-rate exceeds<br />
birth-rate above K. K is, therefore, a stable equilibrium.<br />
tion size is subject to negative feedback (Fig. 2.2). In<br />
the case <strong>of</strong> the effects <strong>of</strong> intraspecific competition, this<br />
equilibrium level is <strong>of</strong>ten called the 'carrying-capacity'<br />
<strong>of</strong> the population. In reality, however, no single<br />
carrying-capacity can ever characterize a natural<br />
population: most aspects <strong>of</strong> its environment are far too<br />
variable, <strong>and</strong> its own behaviour is never wholly<br />
predictable. For this reason 'regulation' may, more<br />
reasonably, be taken as the ability to act on a very<br />
wide range <strong>of</strong> starting densities, <strong>and</strong> bring them to a<br />
much narrower range <strong>of</strong> final densities.<br />
Second, the word 'tendency' is used advisedly. If a<br />
density-dependent effect is not operative at all densities,<br />
or is not operative under all environmental<br />
conditions, is weak, or happens after a time delay,<br />
then the effect-although density-dependent-may<br />
not actually regulate population size. Similarly, if there<br />
are several density-dependent factors acting on a<br />
population, then each factor alone may be incapable<br />
<strong>of</strong> regulating the population, even though each tends<br />
to do so.<br />
Third, all density-dependent effects are the result <strong>of</strong><br />
a density-dependent factor acting through a densitydependent<br />
process. Until now only one densitydependent<br />
process has been considered (intraspecific<br />
competition), invoked by various density-dependent<br />
factors: food, space <strong>and</strong> so on. It should be remembered,<br />
however, that the effects <strong>of</strong> intraspecific competition<br />
can easily be discussed without specifying the<br />
factor involved; <strong>and</strong> these effects-on either mortality<br />
or fecundity-can even be measured. Yet if, ultimately,<br />
we are to underst<strong>and</strong> the dynamics <strong>of</strong> a<br />
population, we must identify the density-dependent<br />
factor itself.<br />
2.4 Scramble <strong>and</strong> contest<br />
The density-dependent effects <strong>of</strong> intraspecific competition<br />
are <strong>of</strong> central importance in the dynamics <strong>of</strong><br />
natural populations, but so far they have only been<br />
outlined. We have still to describe the precise effects<br />
that intraspecific competition can have on the quantity<br />
<strong>and</strong> quality <strong>of</strong> individuals within a population. Of<br />
course, competitive interactions do not all conform to<br />
precisely the same pattern. On the contrary, there is a<br />
whole spectrum <strong>of</strong> interactions, varying in their underlying<br />
biological causes, <strong>and</strong> in their effects on the<br />
quantity <strong>and</strong> quality <strong>of</strong> individuals; but in order to<br />
appreciate this variety, it will be useful to have certain<br />
st<strong>and</strong>ards against which actual examples can be<br />
matched. The most appropriate st<strong>and</strong>ards are the<br />
extreme forms <strong>of</strong> competition described by Nicholson<br />
(1954b): 'scramble' <strong>and</strong> 'contest'.<br />
The essential features <strong>of</strong> scramble <strong>and</strong> contest are<br />
illustrated in Figs 2.3 <strong>and</strong> 2.4 respectively (adapted<br />
from Varley et al., 1975). It is particularly important to<br />
note that Figs 2.3b <strong>and</strong> 2.4b make use <strong>of</strong> the 'k-values'
32 PART l : SINGLE-SPECIES <strong>POPULATION</strong>S<br />
Fig. 2.3 Scramble competition. Mortality relationships (a) in<br />
terms <strong>of</strong> numbers surviving <strong>and</strong> percentage mortality, <strong>and</strong><br />
(b) in terms <strong>of</strong> k plotted against the logarithm <strong>of</strong> density.<br />
described in Chapter l. In both cases there is no<br />
competition at all at low densities: all individuals have<br />
as much resources as they need, <strong>and</strong> all individuals<br />
need <strong>and</strong> get the same amount (010 mortality = 0; A = B;<br />
k =log,, BIA = 0). Above a threshold density <strong>of</strong> T<br />
individuals, however, the situation changes. In scramble<br />
competition (Fig. 2.3), all the individuals still get an<br />
equal share, but this is now less than they need, <strong>and</strong><br />
as a consequence they all die. The slope, b, <strong>of</strong> Fig. 2.3 b<br />
therefore changes suddenly from zero to infinity as the<br />
threshold, T, is passed. Conversely, in contest competition<br />
(Fig. 2.4) the individuals fall into two classes<br />
when the threshold is exceeded. T individuals still get<br />
an equal <strong>and</strong> adequate share <strong>of</strong> the resource, <strong>and</strong><br />
survive; all other individuals get no resource at all,<br />
<strong>and</strong> therefore die. There are always just T survivors in<br />
contest, irrespective <strong>of</strong> the initial density, because<br />
mortality compensates exactly for the excess number<br />
<strong>of</strong> individuals. In Fig. 2.4b the slope changes at the<br />
threshold from zero to 1; this b-value <strong>of</strong> 1 is indicative <strong>of</strong><br />
the exact compensation <strong>of</strong> contest competition.<br />
Scramble <strong>and</strong> contest can also be seen in terms <strong>of</strong><br />
fecundity. Below the threshold there is no competition,<br />
<strong>and</strong> all individuals produce the maximum number<br />
<strong>of</strong> <strong>of</strong>fspring. Above the threshold, scramble leads<br />
to the production <strong>of</strong> no <strong>of</strong>fspring whatsoever; while<br />
contest leads to T individuals producing the maximum<br />
number <strong>of</strong> <strong>of</strong>fspring <strong>and</strong> the rest producing none at<br />
all.<br />
Our 'st<strong>and</strong>ards' <strong>of</strong> competition have now been<br />
defined. In terms <strong>of</strong> the quantity <strong>of</strong> individuals,<br />
neither scramble nor contest are effective below some<br />
threshold; but above this threshold scramble reduces<br />
numbers to zero, while contest maintains a numerical<br />
constancy. In terms <strong>of</strong> quality, both scramble <strong>and</strong><br />
contest allow only two classes <strong>of</strong> individual: those<br />
getting all they require <strong>and</strong> therefore surviving (or<br />
producing the maximum numbers <strong>of</strong> <strong>of</strong>fspring), <strong>and</strong><br />
those getting less than they need <strong>and</strong> therefore dying<br />
(or producing no <strong>of</strong>fspring at all). The difference is that<br />
in scramble all individuals move suddenly from the<br />
first class to the second at threshold; while in contest<br />
there are still T individuals in the first class, even when<br />
threshold is exceeded.
CHAPTER 2: INTRASPECIFIC COMPETITION 33<br />
Fig. 2.4 Contest competition. Mortality relationships (a) in<br />
terms <strong>of</strong> numbers surviving <strong>and</strong> percentage mortality, <strong>and</strong><br />
(b) in terms <strong>of</strong> k plotted against the logarithm <strong>of</strong> density.<br />
2.5 Actual effects <strong>of</strong> intraspecific<br />
competition<br />
2.51 Palmblad's data<br />
Having described these hypothetical extremes, it is<br />
appropriate to examine some actual examples. Studies<br />
<strong>of</strong> plants indicate the inadequacies <strong>of</strong> 'scramble' <strong>and</strong><br />
'contest' particularly clearly.<br />
Palmblad (1968) undertook an experimental study<br />
on the effects <strong>of</strong> intraspecific competition on several<br />
species <strong>of</strong> weed. Some <strong>of</strong> his results are summarized in<br />
Table 2.1 <strong>and</strong> Fig. 2.5. They refer to two annual<br />
species, CapseIla bursa-pastoris (Shepherd's purse) <strong>and</strong><br />
Conyza canadensis (Canadian fleabane), <strong>and</strong> the perennial,<br />
Plantago major (plantain). Palmblad's procedure<br />
was simply to sow seeds <strong>of</strong> each species under<br />
controlled conditions at a range <strong>of</strong> densities (1, 5, 100<br />
<strong>and</strong> 200 seeds per pot), <strong>and</strong> then keep a careful record<br />
<strong>of</strong> their subsequent progress. As Table 2.1 shows, he<br />
was able to compute the percentage <strong>of</strong> seeds that<br />
actually germinated <strong>and</strong> produced seedlings ('germination'<br />
in Table 2.1), the percentage that subsequently<br />
died before setting their own seed at the end <strong>of</strong> the<br />
summer, <strong>and</strong> the percentage that remained alive but<br />
failed to reproduce ('vegetative' in Table 2.1). The<br />
number <strong>of</strong> seeds produced by each individual was<br />
then counted, <strong>and</strong> the 'mean number <strong>of</strong> seeds per<br />
reproducing individual' <strong>and</strong> the 'total number <strong>of</strong> seeds<br />
per pot' computed. Finally, the total dry weight <strong>of</strong><br />
plants, both reproductive <strong>and</strong> vegetative, was measured<br />
for each pot.<br />
The results are also summarized in Fig. 2.5, where<br />
the k-values <strong>of</strong> the various processes are plotted<br />
against the log,, <strong>of</strong> the sowing density (as they were in<br />
Figs 2*3b <strong>and</strong> 2.4b)* kgermination? kmortatity <strong>and</strong> kvegetative<br />
are all self-explanatory; kJ,,,,,,, refers to the reduction<br />
in the number <strong>of</strong> seeds produced per individual, log,,<br />
(maximum seedslactual seeds); while k,,,,, refers to the<br />
reduction in the total number <strong>of</strong> seeds produced, but<br />
is also the sum <strong>of</strong> all the other k-values.<br />
The first point to note is that, almost without<br />
exception, the 15 plots in Fig. 2.5 show k increasing<br />
with density. The density-dependent nature <strong>of</strong> the<br />
various responses <strong>of</strong> these plants to intraspecific<br />
competition is, therefore, immediately confirmed. It is
34 PART 1: SINGLE-SPECIES <strong>POPULATION</strong>S
CHAPTER 2: INTRASPECIFIC COMPETITION 35<br />
Fig. 2.5 The varied effects <strong>of</strong> intraspecific competition:<br />
experiments on populations <strong>of</strong> three species <strong>of</strong> weed. (Data<br />
from Palmblad, 1968.) For further discussion see text.<br />
also apparent, however, that the sudden threshold,<br />
characteristic <strong>of</strong> scramble <strong>and</strong> contest, is generally<br />
lacking in these real examples. Instead, as density<br />
increases, the slopes tend to increase gradually. This,<br />
not surprisingly, is characteristic <strong>of</strong> many real<br />
examples: as density increases, so the intensity <strong>of</strong><br />
competition increases. One reason for this is that,<br />
because the plants were not spaced with total regularity,<br />
different plants experienced different degrees <strong>of</strong><br />
crowding. Another is that the plants themselves were<br />
inherently (i.e. genetically) different. Other reasons<br />
will soon become apparent.<br />
In all three species, intraspecific competition exerted<br />
its density-dependent effects on the proportions<br />
germinating, surviving <strong>and</strong> remaining vegetative, <strong>and</strong><br />
in each case the plants fell, as a result, into one <strong>of</strong> two<br />
categories: those that 'did', <strong>and</strong> those that 'did not'.<br />
With reproduction, however, the situation was far
36 PART 1: SINGLE-SPECIES POPULATTONS<br />
more complex, the density-dependent effects <strong>of</strong> intraspecific<br />
competition were no less obvious, but the<br />
response was very far from being all-or-none. Instead,<br />
the mean number <strong>of</strong> seeds produced per individual<br />
varied continuously throughout an almost 200-fold<br />
range in Plantago major, <strong>and</strong> an approximately 100-<br />
fold range in Capsella bursa-pastoris <strong>and</strong> Conyza canadensis.<br />
This plasticity <strong>of</strong> response-admittedly exemplified<br />
by seed production in plants-is common throughout<br />
both the plant <strong>and</strong> animal kingdoms. Intraspecific<br />
competition leads not only to quantitative changes in<br />
the numbers surviving in populations, but also to<br />
qualitative changes in those survivors; <strong>and</strong> these progressive<br />
decreases in quality as density increases contribute<br />
significantly to the increasing intensity <strong>of</strong><br />
competition.<br />
In Palmblad's experiments these qualitative changes<br />
were not confined to average seed production. Despite<br />
the considerable variation in the density <strong>of</strong> surviving<br />
plants, the total dry weight for each species, after an<br />
initial rise, remained remarkably constant with increasing<br />
density. In other words, at higher densities<br />
individualplants were smaller. There was 'compensation'<br />
so that the final 'yield' remained largely unchanged.<br />
Of course, the qualitative changes in dry weight <strong>and</strong><br />
seed production are closely connected: smaller plants<br />
produce fewer seed. This, as TabIe 2.1 shows, leads to<br />
a comparative constancy in the total number <strong>of</strong> seeds<br />
produced. Thus, the regulatory tendencies <strong>of</strong> intraspecific<br />
competition are amply illustrated; despite a<br />
200-fold range <strong>of</strong> sowing densities, the range <strong>of</strong> seed<br />
output is only 1.4 in Capsella bursa-pastoris, 2.9 in<br />
Plantago major <strong>and</strong> 1.7 in Conyza canadensis. That such<br />
regulation does indeed occur is illustrated in another<br />
way in Fig. 2.5. Remember that in contest competition<br />
there was an absolute constancy <strong>of</strong> output illustrated<br />
by a slope (b) <strong>of</strong> 1. In Fig. 2.5 the slopes <strong>of</strong> the three<br />
graphs for k,,,,,, taken over the whole range, are also<br />
close to 1, indicating the near-constancy <strong>of</strong> output<br />
already noted. The resemblance to contest, however,<br />
is only superficial. In contest, constancy is achieved by<br />
a constant number <strong>of</strong> survivors all producing the same<br />
number <strong>of</strong> <strong>of</strong>fspring. In Palmblad's experiments, as in<br />
real examples generally, the near-constancy <strong>of</strong> output<br />
was achieved by a variable number <strong>of</strong> survivors<br />
producing a variable number <strong>of</strong> <strong>of</strong>fspring.<br />
Looking at these graphs more closely, we see that at<br />
lower sowing densities-below 50 in Capsella, <strong>and</strong><br />
below 5 in Conyza <strong>and</strong> Plantago-the slopes <strong>of</strong> the k,,,,,<br />
graphs are, in fact, less than 1. This indicates undercompensation<br />
(i.e. less than the exact compensation <strong>of</strong><br />
b = l); although there is a reduction in individual<br />
output, this is not enough to compensate for the<br />
increasing density, <strong>and</strong> the total output increases<br />
(Table 2.1). Conversely, at higher densities (with the<br />
exception <strong>of</strong> Conyza between 100 <strong>and</strong> 200), there is<br />
overcompensation; the reduction in individual output<br />
more than compensates for the increased density, <strong>and</strong><br />
total output decreases. This is indicated by a slope<br />
greater than 1. In each species, therefore, the yield <strong>of</strong><br />
seed reaches a peak towards the middle <strong>of</strong> the density<br />
range. Its precise position is indicated by the point on<br />
the graph where the slope equals 1 exactly. Thus, not<br />
only do the graphs in Fig. 2.5 show the degree <strong>of</strong><br />
compensation resulting from competition, they also<br />
indicate the sowing density that would maximize the<br />
final yield <strong>of</strong> seed. For commercially valuable crops,<br />
such graphs may be <strong>of</strong> considerable imp<strong>of</strong>tance.<br />
Finally, it is apparent from Fig. 2.5 that the relative<br />
importance <strong>of</strong> gemination, mortality <strong>and</strong> so on in<br />
regulating output is different in the three species. This<br />
is made particularly clear by the fact that k,,,,, (the<br />
total effect) is the sum <strong>of</strong> all the other k-values. In<br />
Capsella bursa-pastoris the effects <strong>of</strong> competition are<br />
almost entirely on the growth, <strong>and</strong> therefore the seed<br />
production, <strong>of</strong> surviving individuals. In Conyza canadensis<br />
seed production is also <strong>of</strong> primary importance,<br />
but a substantial proportion <strong>of</strong> the totaI effect is the<br />
result <strong>of</strong> reduced rates <strong>of</strong> germination. Conversely, in<br />
Plantago major the tendency to remain vegetative <strong>and</strong><br />
(to a lesser extent) mortality play an important role;<br />
this is no doubt associated with the perennial habit.<br />
Thus, although the end-results are similar in the three<br />
species, the ways in which they are achieved are<br />
rather different.<br />
In summary, then, we have learnt a great deal that<br />
is <strong>of</strong> general relevance from this limited example.<br />
Typically, intraspecific competition affects not only the<br />
quantity <strong>of</strong> survivors, but their quality as well, which
CHAPTER 2: INTRASPECIFIC COMPETITION 37<br />
becomes more <strong>and</strong> more affected as density increases.<br />
This, combined with the variability <strong>of</strong> both environment<br />
<strong>and</strong> individuals, means that there is usually no<br />
sudden threshold for competition in nature. Rather, it<br />
increases gradually over an extended range. Palmblad's<br />
experiment also reiterates that the ultimate<br />
effect <strong>of</strong> intraspecific competition, acting through<br />
survival <strong>and</strong> fecundity, is on the contributions to<br />
future generations; that individuals are affected reciprocally;<br />
that intraspecific competition tends to regulate<br />
populations; <strong>and</strong> that the effects can be measured<br />
without the unequivocal identification <strong>of</strong> the resource<br />
in limited supply.<br />
2.5.2 Competition in plants:<br />
a deeper look<br />
Palmblad's experiments also illustrate two important<br />
interlinked events that can occur when plant populations<br />
are grown in resource-limited environments.<br />
The first is that the size <strong>of</strong> individuals (as measured for<br />
instance by individual biomass or seed production) is<br />
reduced; the other is that ultimately mortality may<br />
ensue. These events occur along a spectrum <strong>of</strong> competitive<br />
effects on the growth <strong>of</strong> individual plants. The<br />
extremities are the death <strong>of</strong> the individual (growth <strong>and</strong><br />
maintenance ceased) <strong>and</strong> unconstrained growth<br />
(growth rate = maximum for that environment). The<br />
'in between' is a reduced growth rate (less than<br />
maximum) which is reflected at some point in time<br />
(harvest <strong>of</strong> the plant) in a reduced plant size.<br />
Evidence for the density-dependent effects <strong>of</strong> competition<br />
can be examined at various levels: at the level<br />
<strong>of</strong> the population itself, amongst individuals within the<br />
population <strong>and</strong> within individual plants. We will<br />
follow this progression, which is, perhaps not surprisingly,<br />
the way our scientific underst<strong>and</strong>ing has historically<br />
developed. Finally, we attempt to integrate our<br />
underst<strong>and</strong>ing <strong>of</strong> the whole process.<br />
Figure 2.6 shows the two general forms <strong>of</strong> 'yielddensity'<br />
relationship that have emerged from the<br />
wealth <strong>of</strong> studies conducted by agronomists <strong>and</strong><br />
ecologists. The figures relate population density before<br />
the action <strong>of</strong> competition-<strong>of</strong>ten the number <strong>of</strong> plants<br />
sown as seed or planted-to population density held)<br />
after the action <strong>of</strong> competition, always on a constant<br />
area basis. This yield may be measured in a variety <strong>of</strong><br />
ways either as a direct fitness component (e.g. seed<br />
produced) or less directly as biomass, either <strong>of</strong> the total<br />
plant or some <strong>of</strong> its constituent parts. The form <strong>of</strong><br />
response is either : (i) asymptotic (Fig. 2.6a) where yield<br />
per unit area levels <strong>of</strong>f with increasing density (i.e.<br />
perfect compensation; constant final yield); or (ii)<br />
parabolic (Fig. 2.6b), where a maximum yield is<br />
reached at an intermediate density before falling at<br />
high densities (i.e. overcompensation). From these<br />
examples, we can see (as we might expect) that the<br />
influence <strong>of</strong> adding more resources for growth (by<br />
fertilizer) increases the, size <strong>of</strong> the population, measured<br />
as the height <strong>of</strong> the asymptote or peak <strong>of</strong> the<br />
parabola.<br />
The asymptotic constant yield response, which<br />
develops progressively, can best be explained by<br />
looking at the changes in the population with time <strong>and</strong><br />
the performance <strong>of</strong> individuals. Soybeans grown over<br />
a 1000-fold density range show particularly well<br />
(Fig. 2.7a). At sowing (day 0), yield per unit area <strong>and</strong><br />
density are directly proportional to one another: the<br />
yield is the weight <strong>of</strong> the seed sown! With time this<br />
linear proportionality disappears, as plants grow to<br />
sizes at which they interfere with one another, the<br />
interference occurring first at the highest density. The<br />
yield curves therefore display a successively pronounced<br />
shoulder as the linear proportionality disappears,<br />
but this in its turn is replaced (after 119 days)<br />
by a horizontal yield curve when final yield is independent<br />
<strong>of</strong> original population size. Compensation by<br />
individuals on this sort <strong>of</strong> scale &ere 10 <strong>and</strong> 1000<br />
plants m-2 yielding the same biomass after 119 days)<br />
is a direct reflection <strong>of</strong> the enormous plasticity that<br />
species with modular growth possess. Such plasticity<br />
has been shown to occur in a wide range <strong>of</strong> species<br />
including pine trees, grasses <strong>and</strong> herbs. Re-examining<br />
the same data, but from the viewpoint <strong>of</strong> an average<br />
individual soybean plant, shows us that compensation<br />
through adjustment <strong>of</strong> the performance <strong>of</strong> individuals<br />
is indeed occurring. From being initially independent<br />
<strong>of</strong> density (at day O), the average weight <strong>of</strong> a plant<br />
becomes increasingly related to it (Fig. 2.7b). <strong>Plants</strong> at<br />
low density (10 mP2) achieved a final mean weight <strong>of</strong>
38 PART l : SINGLE-SPECIES <strong>POPULATION</strong>S<br />
Fig. 2.6 Illustrative yield-density<br />
relationships in plants. (a) Bromus<br />
uniloides at three nitrogen fertilizer<br />
levels. (From Donald, 195 1 .) @) Zea<br />
mugs at three fertilizer levels. (Data<br />
<strong>of</strong> Langer et al., 1956; from Willey &<br />
Heath, 1969.) See text for<br />
explanation.<br />
nearly 70 g whereas those in popuIations <strong>of</strong> 50<br />
were onIy 14 g. Moreover, it is important to realize<br />
that these adjustments occurred in the absence <strong>of</strong><br />
mortality. Yield density esperirnents in both agriculture<br />
<strong>and</strong> forestry have frequently reaffinned that in<br />
many situations (species <strong>and</strong> environments) mean<br />
yield per plant is inversely proportional to density or<br />
that total yield per unit area is independent <strong>of</strong> density.<br />
This observation has been described as the 'law <strong>of</strong><br />
constant final yield' (Kira et al., 1953).<br />
How then can we explain situations in which the<br />
law <strong>of</strong> constant final yield is not obeyed (e.g. Fig. 2.6b),<br />
<strong>and</strong> yield at high densities declines from an intermediate<br />
optimum? This question cannot be fully<br />
answered for all cases, but two cogent possible explanations<br />
are: (i) plant mortality does occur during the<br />
course <strong>of</strong> competition, but the surviving plants are<br />
unable to exploit fully resources freed by the death <strong>of</strong><br />
other members <strong>of</strong> the population; <strong>and</strong> (ii) species<br />
respond difleuentiallg according to their developmental<br />
stage. To appreciate these expIanations we must first<br />
give further consideration to two features <strong>of</strong> plant<br />
growth.<br />
The first is that the production <strong>of</strong> flowers <strong>and</strong> hence<br />
seeds requires the differentiation <strong>of</strong> floral meristems.<br />
These may arise from the permanent conversion <strong>of</strong><br />
vegetative meristems, or they may be borne laterally<br />
on an axis that retains a vegetative meristem at its tip.<br />
This difference leads to a dichotomy in growth form.<br />
Species may show indeterminate growth, bearing flowers<br />
at nodes laterally to growing axes <strong>and</strong> thus<br />
retaining the potential for indefinite vegetative extension.<br />
In contrast, species may show determinate<br />
growth, where the conversion <strong>of</strong> vegetative meristems<br />
into floral structures prohibits further vegetative development.<br />
Conversion may be triggered by changes
CHAPTER 2: INTRASPECIFIC COMPETITION 39<br />
Fig. 2.7 Yield-density relationships in soybean Glycine max:<br />
the progressive changes with time (a) on a unit area basis,<br />
<strong>and</strong> (b) per plant. (From Shinozaki & Kira, 1956; after<br />
Harper, 1977.)<br />
in day length <strong>and</strong>/or temperature (vernalization), or<br />
may be genetically fixed.<br />
The second feature that we must consider is how<br />
yield is formed. In the case <strong>of</strong> seed, it requires the<br />
production <strong>of</strong> a range <strong>of</strong> plant parts, i.e. the components<br />
<strong>of</strong> yield (e.g. stems, flower-bearing branches, flowers,<br />
pods <strong>and</strong> seeds). All components may respond to<br />
density but as successive components are produced<br />
we might expect the type <strong>of</strong> density response to<br />
change.<br />
Populations <strong>of</strong> cultivated sunflowers (Helianthus annus)<br />
provide us with an illustration <strong>of</strong> one type <strong>of</strong><br />
yield-density response (Fig. 2.8a) in which there is<br />
overcompensation. In this sunflower, plants usually<br />
bear a single large capitulum (flower head). This<br />
develops from the terminal meristem when the plant<br />
is young, before the influence <strong>of</strong> competition has<br />
become marked. Thus, the response to densityinduced<br />
resource limitation cannot be a reduction in<br />
capitulum number. Instead it is etiolation <strong>of</strong> the plant,<br />
<strong>and</strong> reduction both in the proportion <strong>of</strong> flowers within<br />
the capitulum that set mature achenes (seeds) <strong>and</strong> the<br />
size <strong>of</strong> those achenes. In the field bean (Vicia faba) on<br />
the other h<strong>and</strong> (Fig. 2.8b) responses to density are<br />
seen at all developmental stages in the production <strong>of</strong><br />
seeds. Part <strong>of</strong> the response is a reduction in the<br />
number <strong>of</strong> stems per plant <strong>and</strong> flowers per stem, <strong>and</strong><br />
part is the abscission <strong>of</strong> flowers <strong>and</strong> pods. The overall<br />
outcome <strong>of</strong> this plasticity is near constancy in seed<br />
population size per unit area. One further contrast<br />
may be drawn from this example. In Helianthus,<br />
individual seed weight declined markedly with plant<br />
density, whereas in Vicia it remained constant. The<br />
former response, however, is the exception to the<br />
generally observed phenomenon <strong>of</strong> homeostasis in<br />
seed size in response to density. (Wild progenitors <strong>of</strong><br />
Helianthus absorb density stress by reducing the
40 PART l : SINGLE-SPECIES <strong>POPULATION</strong>S<br />
Fig. 2.8 Yield-density responses in (a) cultivated sunflowers<br />
(data replotted from Clements et al., 1929). <strong>and</strong> (b) field<br />
bean (data from Hodgson & Blackman, 1956).<br />
numbers <strong>of</strong> branches <strong>and</strong> capitula, preserving constancy<br />
<strong>of</strong> seed weight; Bradshaw, 1965.)<br />
Sunflowers <strong>and</strong> field beans provide us with clear<br />
illustrations <strong>of</strong> some <strong>of</strong> the responses <strong>of</strong> determinate<br />
<strong>and</strong> indeterminate growth forms to intraspecific competition<br />
but we should not assume that yield responses<br />
can be inferred from knowledge <strong>of</strong> the growth form <strong>of</strong><br />
the plant. Final seed yield is the product <strong>of</strong> a number<br />
<strong>of</strong> yield components each <strong>of</strong> which may respond to<br />
density in a specific way. Figure 2.9 illustrates these<br />
yields within a species (field bean) in which determinate<br />
<strong>and</strong> indeterminate growth forms have been<br />
selected (Pilbeam et al., 1991). In the determinate form<br />
all yield components (stemslplant, nodeslstem, pods1<br />
node, seedslpod) tended to decline systematically with<br />
increasing density, whereas in the indeterminate form<br />
yield component responses were noticeably more<br />
varied.<br />
Many annual grasses, as exemplified by wheat<br />
(Triticum aestivum), exhibit a density response that is <strong>of</strong><br />
a combined form. Seed production in wheat is the<br />
product <strong>of</strong> the number <strong>of</strong> fertile tillers per plant <strong>and</strong><br />
the number <strong>of</strong> grains (seeds) per ear: a fertile tiller<br />
bears only one ear which may vary in size <strong>and</strong> thus in<br />
floret <strong>and</strong> seed number. Prior to flowering <strong>and</strong> ear<br />
formation, density stress is reflected in reduced vegetative<br />
biomass <strong>and</strong> plant parts, but afterwards it is<br />
reflected in the size <strong>of</strong> the ears. This is shown<br />
(Fig. 2.10) by a field experiment <strong>of</strong> Puckridge <strong>and</strong><br />
Donald (1967) who grew wheat over a 1000-fold<br />
density range <strong>and</strong> followed the course <strong>of</strong> grain yield<br />
development. After 14 weeks growth, plants had<br />
received stimuli for flowering. At this time the number<br />
<strong>of</strong> tillers per plant was strongly density-dependent
CHAPTER 2: INTRASPECIFIC COMPETITION 41<br />
Fig. 2.9 Seed yield <strong>and</strong> yield<br />
component responses to density in<br />
determinate <strong>and</strong> indeterminate<br />
growth forms <strong>of</strong> Vicia faba. (Data<br />
from Pilbeam et al., 1991 .)<br />
(line A in Fig. 2.10). During ear formation (1 7 weeks)<br />
<strong>and</strong> subsequently through to maturity (26 weeks) the<br />
number <strong>of</strong> tillers changed little <strong>and</strong> the number <strong>of</strong><br />
fertile tillers was a constant fraction <strong>of</strong> the total.<br />
However, the effects <strong>of</strong> density were reflected in<br />
changes in ear weight (Fig. 2.10, lines D <strong>and</strong> E). These<br />
two phases in density adjustment, therefore, resulted<br />
in a constant individual seed weight at harvest <strong>and</strong> in<br />
an asymptotic yield response per unit area up to 100<br />
plants m-2. Conversely, the depression <strong>of</strong> yield at the<br />
highest sowing density in this experiment was a<br />
consequence <strong>of</strong> density-induced mortality (note the<br />
end-points <strong>of</strong> lines C, E <strong>and</strong> G are displaced to the left).<br />
This mortality occurred during flowering, <strong>and</strong> clearly<br />
if it had been greater a more pronounced parabolic<br />
yield curve would have occurred.<br />
Whilst intraspecific competition may act to reduce<br />
plant size <strong>and</strong> reproductive output in relation to the<br />
developmental schedule <strong>of</strong> a plant, it is very commonly<br />
observed that the number <strong>of</strong> seeds produced by<br />
a plant bears an exponential relationship to its size<br />
whether measured by mass or indirectly in the case <strong>of</strong><br />
herbs by stem diameter (Fig. 2.11). (This relationship<br />
does, however, break down where plants show an<br />
age-dependent fecundity schedule as in the case <strong>of</strong> the<br />
trees .)
42 PART 1 : SINGLE-SPECIES <strong>POPULATION</strong>S<br />
Fig. 2.10 Yield-density relationships in Tviticum aestivum.<br />
(Data from Puckridge & Donald, 1967.) A, tiller number per<br />
plant after 14 weeks; B, tiller number per plant after 17<br />
weeks; C, number <strong>of</strong> fertile tillers per plant after 26 weeks;<br />
D, individual ear weight after 17 weeks; E, individual ear<br />
weight after 26 weeks: F, total grain yield at 26 weeks;<br />
G, individual grain weight after 26 weeks.<br />
2.5.3 Individual variability<br />
Characterizing plant populations by an average response<br />
as we have done up to now masks the<br />
mechanism by which compensation actually occurs.<br />
We must now consider the fates <strong>of</strong> individuals within<br />
the population.<br />
Obeid et al. (1967) sowed Linum usitatissimum (flax)<br />
at three densities <strong>and</strong> harvested at three stages <strong>of</strong><br />
development, recording the weight <strong>of</strong> each plant<br />
individually. Figure 2.12 makes it quite clear that the<br />
frequency distribution <strong>of</strong> weights is skewed towards<br />
the left <strong>and</strong> that the skewing is increased by the<br />
passage <strong>of</strong> time <strong>and</strong> by an increase in density. The<br />
resulting populations display a few large individuals<br />
<strong>and</strong> a great many small ones. Similar distribution<br />
patterns have been observed in the growth <strong>of</strong> singlespecies<br />
populations <strong>of</strong>'crop plants, mixed tree plantations<br />
<strong>and</strong> in animals (Begon, 1984).<br />
There are two partially interrelated causes <strong>of</strong> skewness<br />
in the size distributions <strong>of</strong> populations in the<br />
absence <strong>of</strong> the death <strong>of</strong> plants. Even in plant populations<br />
sown at the same time, individuals will germinate<br />
at slightly different times, perhaps due to<br />
variation in the 'local' environment for germination or<br />
because <strong>of</strong> differences in seed size. These subtle<br />
differences in time <strong>of</strong> birth <strong>and</strong> size at birth will then<br />
become exaggerated as the growth <strong>of</strong> individuals<br />
proceeds. In addition, however, competition may<br />
further exaggerate skewness. Larger individuals which<br />
will <strong>of</strong>ten be those that emerge first will be comparatively<br />
unaffected by interference from smaller (<strong>and</strong><br />
later) neighbours. As a consequence they will grow<br />
quickly. Conversely, small plants <strong>and</strong> late emergers<br />
not only have to compete with a number <strong>of</strong> other,<br />
generally larger individuals, but have to do so on<br />
unequal terms. Intraspecific competition accentuates<br />
initial differences in size: large (early) individuals are<br />
least affected by competition <strong>and</strong> grow larger still;<br />
small (late) individuds are most &ected, <strong>and</strong> lag<br />
further <strong>and</strong> further behind. Competition, then,. serves<br />
to exaggerate size differences that initially may be<br />
determined by environmental chance or variation in<br />
initial starting capital: seed size.<br />
The inevitable consequence <strong>of</strong> this process is the<br />
development <strong>of</strong> a population in which size differences<br />
will be exaggerated <strong>and</strong> a left-h<strong>and</strong>ed skew will<br />
develop. A 'hierarchy <strong>of</strong> exploitation' will result in a<br />
few dominant individuals with high growth rate <strong>and</strong><br />
disproportionate share <strong>of</strong> resources whilst 'the most<br />
common type <strong>of</strong> plant in experimental (<strong>and</strong> natural)<br />
plant populations is the suppressed weakling' (Harper,<br />
1977). Experimental support for this view comes from<br />
the work <strong>of</strong> Ford (1975) on sitka spruce (Picea sitchensis)<br />
(Fig. 2.13). The greatest relative growth rate occurred<br />
in trees with the largest girth size, these trees<br />
being in the minority.<br />
Finally we can consider the influence <strong>of</strong> limiting<br />
resources at the level <strong>of</strong> the modular growth <strong>of</strong> an
CHAPTER 2: INTRASPECIFIC COMPETITION 43<br />
Fig. 2.11 The relationship between fecundity <strong>and</strong> size in<br />
seed plants. Lines show the relationship, on logarithmic<br />
scales, between observed sizes <strong>of</strong> individual plants <strong>and</strong><br />
seeds produced per plant. In (a) size is expressed as basaI<br />
stem diameter for herbs (1-9) <strong>and</strong> a shrub (10) <strong>and</strong> as<br />
diameter at breast height for trees (11-13). In (b) size is<br />
measured as above-ground biomass for perennial (1-3) <strong>and</strong><br />
annual (4-8) species. (After Watkinson & White, 1985.)<br />
organism. Porter (1983b) grew single Fuchsia plants in<br />
three different soil volumes <strong>and</strong> examined the accumulation<br />
<strong>of</strong> modules with time. His results (Fig. 2.14)<br />
show that whilst growth was initially rapid in all<br />
volumes, the onset <strong>of</strong> a stationary plant size-the<br />
plateau phase in the curves-was determined by the<br />
amount <strong>of</strong> soil available. Limiting the resources avail-<br />
able influences the size <strong>of</strong> the module population <strong>and</strong><br />
hence hdividual plant size. If this limitation arises<br />
through individuals interfering with resource gathering<br />
by one another (intraspecific competition) then<br />
differential reductions in relative growth rate amongst<br />
plants will occur <strong>and</strong> be reflected in the absolute size<br />
distribution <strong>of</strong> the population.<br />
2.5.4 Self-thinning in plants<br />
Certain aspects <strong>of</strong> these results on Linum are frequently<br />
repeated: the effects <strong>of</strong> intraspecific competition<br />
on a growing plant population <strong>of</strong>ten become<br />
accentuated with the passage <strong>of</strong> time. These effects<br />
most commonly concern plant density (which de-
44 PART 1: SINGLE-SPECIES <strong>POPULATION</strong>S<br />
Fig. 2.12 Frequency distributions <strong>of</strong> plant weights in<br />
populations <strong>of</strong> flax, Linum usitatissimum, sown at three<br />
densities. (Data from Obeid et al., 1967; after Harper,<br />
1977.)
CHAPTER 2: INTRASPECIFIC COMPETITION 45<br />
Fig. 2.13 Relative growth rates<br />
(RGR) <strong>and</strong> frequency distributions <strong>of</strong><br />
size (12 equal intervals <strong>of</strong> girth<br />
classes) in Picea sitchensis, 29 years<br />
after planting at three different<br />
densities. (From Ford, 1975.)<br />
creases with time), <strong>and</strong> mean plant weight (which<br />
increases with time); these two parameters appear to<br />
be closely related. 'Self-thinning' refers to the dynamics<br />
<strong>of</strong> density-dependent mortality that occurs progressively<br />
in cohorts as individuals grow in size. It has<br />
been studied most <strong>of</strong>ten in plant populations in<br />
monocultures. The process is well illustrated in an<br />
experiment by Kays <strong>and</strong> Harper (1974) in which they<br />
sowed a series .<strong>of</strong> populations <strong>of</strong> Lolium perenne,<br />
perennial ryegrass, at densities ranging from 330 to<br />
10000 seeds m-2, <strong>and</strong> harvested their populations at<br />
subsequent occasions over a period <strong>of</strong> 180 days.<br />
Growth in this species occurs through the accumulation<br />
<strong>of</strong> ramets (shoots or tillers) on the genet (established<br />
plant). Throughout the experiment (Fig. 2.15a)<br />
there was continual death <strong>of</strong> genets. Initially, this was<br />
most marked at the highest sowing density but latterly<br />
it assumed a rate independent <strong>of</strong> sowing density.<br />
During the early part <strong>of</strong> the experiment the number <strong>of</strong><br />
ramets per unit area increased but then declined to<br />
give a similar number per m2 after 125 days regardless<br />
<strong>of</strong> initial genet starting density. This constancy<br />
was repeated after 180 days but at a lower density.<br />
Compensatory processes within the population result- Fig- 2-14 The production <strong>of</strong> modular units by ~uchsia<br />
(cultivar Royal Velvet), in different soil volumes. The solid<br />
ing in this constancy <strong>of</strong> tiller number derive from<br />
line shows the total number <strong>of</strong> modules assuming<br />
<strong>of</strong> genets <strong>and</strong> rates <strong>of</strong> unrestricted exDonential rate. <strong>Plants</strong> received<br />
birth <strong>and</strong> death <strong>of</strong> tillers on them (Fig. 2.15a). Plotting abundant water but no additional nutrients. (From Porter,<br />
the average genet size (mean above-ground plant 1983b.)
46 PART 1: SINGLE-SPECIES <strong>POPULATION</strong>S<br />
Fig. 2.15 Intraspecific competition affects tillers more than<br />
genets. (a) Changes in tiller <strong>and</strong> genet density in<br />
populations <strong>of</strong> ryegrass, Lolium perenne, sown at a range <strong>of</strong><br />
densities. (b) The change in genet density <strong>and</strong> mean genet<br />
weight over the course <strong>of</strong> five harvests (H,-H,) for the same<br />
ryegrass populations. Arrows indicate progression <strong>of</strong> time<br />
<strong>and</strong> dashed lies link populations harvested at the same<br />
time. (Data from Kays & Harper, 1974; after Harper, 1977.)<br />
biomass) against the density <strong>of</strong> surviving genets<br />
(Fig. 2.15b) we can examine the process <strong>of</strong> plastic<br />
response intertwined with mortality. The essence <strong>of</strong><br />
studying self-thinning is to examine not a range <strong>of</strong><br />
initial densities all at one time, but the time course <strong>of</strong> a<br />
single initial density as the individuals grow in size.<br />
The time courses show that the 'average' genet in a<br />
population grows, i.e. increases in biomass (points<br />
move upwards in the graph) at a rate diminishing with<br />
density (dotted lines curve down), until at a critical<br />
size, depending on genet density, further biomass<br />
increases can only be achieved with a concomitant<br />
loss <strong>of</strong> genets (points in the diagram shift to the left).<br />
Eventually the time courses appear to progress along a<br />
line with a gradient <strong>of</strong> - 1.5.<br />
We have introduced two quite separate descriptions<br />
<strong>of</strong> the manner in which plant populations respond to<br />
density: (i) yield-density or competition-density (as<br />
they were originally termed by Kira et al., 1953) effects<br />
where mortality within the population does not occur;<br />
<strong>and</strong> (ii) the relationship between plant size <strong>and</strong> population<br />
density as self-thinning occurs.<br />
In Fig. 2.7b at each harvest time, the reciprocal<br />
relationship between mean plant biomass (W) <strong>and</strong> the<br />
density <strong>of</strong> plants (N) can be modelled as follows.<br />
W = wm(l + a ~ ) ~ (2.1)<br />
where W, can be interpreted as the yield <strong>of</strong> a plant<br />
isolated from competing neighbours <strong>and</strong> a <strong>and</strong> b are<br />
parameters that describe the competition effect. b has<br />
been variously interpreted as the rate at which the<br />
effects <strong>of</strong> competition change with density (V<strong>and</strong>ermeer,<br />
1989). or the efficiency <strong>of</strong> resource utilization<br />
(Watkinson, 1984). These interpretations are, at best,<br />
attempts to associate biological meaning to the parameter<br />
b in an empirical model <strong>and</strong> we will return to<br />
their return to their functional interpretation in<br />
Chapter 3. When b = 1, there is exact weight-density
CHAPTER 2: INTRASPECIFIC COMPETITION 47<br />
compensation <strong>and</strong> a plot <strong>of</strong> log mean weight against<br />
log density has a slope <strong>of</strong> - 1. Values <strong>of</strong> all three<br />
parameters (W,, a <strong>and</strong> b) will increase during the<br />
course <strong>of</strong> plant growth <strong>and</strong> the change in a <strong>and</strong> b will<br />
be more rapid when the total availability <strong>of</strong> resources<br />
is least. Figure 2.16 shows competition-density effects<br />
in Vulpia fasiculata populations grown at three fertilizer<br />
levels; note that values <strong>of</strong> b change more quickly when<br />
plants are grown at low fertilizer levels.<br />
The relationship between average plant size <strong>and</strong> the<br />
number <strong>of</strong> survivors in a self-thinning population can<br />
be described by<br />
log (W) = log c - k log N (2.3)<br />
Fig. 2.16 The influence <strong>of</strong> density <strong>and</strong> low (a), medium (Q)<br />
or high (0) nutrient regime on the shoot dry weight per<br />
plant <strong>of</strong> Vulpia fasiculata at three successive harvests. Note<br />
how the lines become steeper as mean plant size increases.<br />
(From Watkinson, 1984.)<br />
where W <strong>and</strong> N are as defined above. However, it is<br />
crucial to emphasize that this description is only<br />
appropriate when the population is undergoing densitydependent<br />
mortality. Originally, Yoda et al. (1963)<br />
proposed that the exponent k had a fixed value <strong>of</strong><br />
- 1.5 <strong>and</strong> the relationship was described as the<br />
self-thinning rule or the ' - 312 power law'. The<br />
implication <strong>of</strong> this rule is that the self-thinning line<br />
represents a boundary condition that is common to all<br />
plant species. This implication <strong>and</strong> the interpretation<br />
aftd biological significance <strong>of</strong> k <strong>and</strong> c has been a matter<br />
<strong>of</strong> strong debate (see Westoby, 1984; Lonsdale, 1990).<br />
There are two major str<strong>and</strong>s <strong>of</strong> evidence that support<br />
the view that there is an inverse relationship between<br />
mean plant weight <strong>and</strong> density with a slope <strong>of</strong><br />
approximately - 312. The first is that the relationship<br />
exists for a great many species widely differing in<br />
overall size <strong>and</strong> form (Fig. 2.17).<br />
The second is based around the explanation <strong>of</strong> the<br />
value <strong>of</strong> 312 on physical grounds. The biomass <strong>of</strong> a<br />
plant will be proportional to its volume <strong>and</strong> in turn the<br />
volume occupied will be proportional to the spatial<br />
area in which the plant is growing. This area is<br />
inversely related to density. Biomass will therefore be<br />
inversely related to density according to a function<br />
determined by the volume to area ratio. As volume is<br />
a cubic <strong>and</strong> area is a squared dimension the power<br />
will be 312. Thus as individuals grow in a self-thinning<br />
population their 'areas' increase by a power <strong>of</strong> 2, their<br />
densities decrease by a power <strong>of</strong> 112 but their mean<br />
biomass increases by a power <strong>of</strong> 3. Burrows (1991)<br />
provides a detailed geometric explanation <strong>of</strong> the - 312<br />
thinning rule based on considerations <strong>of</strong> canopy<br />
volume.<br />
From a number <strong>of</strong> studies it has been found that the<br />
values <strong>of</strong> k fall in the range between 1.3 <strong>and</strong> 1.8 on<br />
log-log plots <strong>of</strong> mean plant biomass against density <strong>of</strong><br />
survivors (White, 1980). The universality <strong>of</strong> the - 312<br />
thinning rule, therefore, has been questioned by a<br />
number <strong>of</strong> workers on the grounds that some species<br />
significantly deviate from the 312 relationship (Zeide,<br />
1987; Weller, 1990) <strong>and</strong> that the line represents a<br />
boundary rather than a course along which selfthinning<br />
populations will progress (White, 1985). In a<br />
careful review, Lonsdale (1990) concluded that there<br />
were too many examples in which a slope <strong>of</strong> 312 was
48 PART 1: SINGLE-SPECIES <strong>POPULATION</strong>S<br />
Fig. 2.17 The relationship between average plant weight<br />
<strong>and</strong> surviving plant density in self-thinning populations <strong>of</strong><br />
trees <strong>and</strong> herbs. Each line represents a different species in a<br />
total <strong>of</strong> 30. (After White, 1980.)<br />
Watkinson (1982) grew Lolium perenne at densities at<br />
which self-thinning occurred <strong>and</strong> observed the trajectories<br />
<strong>of</strong> populations at both fdl <strong>and</strong> low (17%) light.<br />
At low light, the maximum yield attainable was<br />
reduced <strong>and</strong> interestingly populations self-thinned<br />
with a trajectory <strong>of</strong> - 1. In contrast, under high light a<br />
slope <strong>of</strong> - 3/2 was observed. It thus seems possible<br />
that self-thinning may occur at two different rates but<br />
no plant population yet has been observed to make the<br />
switch.<br />
The ' - 312 law' remains a matter <strong>of</strong> debate amongst<br />
plant ecologists <strong>and</strong> development <strong>of</strong> our underst<strong>and</strong>ing<br />
will probably only come with a deeper knowledge<br />
<strong>of</strong> the mechanisms <strong>of</strong> competition <strong>and</strong> greater attention<br />
to variation in the performance <strong>of</strong> individuals.<br />
(Charles-Edwards, 1984; Firbank & Watkinson, 1985;<br />
<strong>and</strong> Hara, 1988 provide launch points for the interested<br />
reader.)<br />
In summary, we have seen how work on intraspecific<br />
competition in plants has established that the<br />
responses <strong>of</strong> actual populations are far more complex<br />
than was envisaged for 'scramble' <strong>and</strong> 'contest'. There<br />
is little uniformity <strong>of</strong> response from plant to plant, <strong>and</strong><br />
the quality, as well as the quantity, <strong>of</strong> surviving<br />
individuals is affected. As a consequence, there is no<br />
sudden threshold <strong>of</strong> response. <strong>Plants</strong> show these<br />
features particularly clearly; it is appropriate, now, to<br />
examine some zoological examples.<br />
not found to justify the claims <strong>of</strong> universality for the<br />
rule. It has been shown (Osawa & Sugita, 1989) that<br />
plant mortality <strong>of</strong>ten occurs in the approach to the<br />
self-thinning line (see data points H, <strong>and</strong> H, in<br />
Fig. 2.15b) <strong>and</strong> it may well be that this phenomenon<br />
can explain measurement <strong>of</strong> slopes <strong>of</strong> steeper than<br />
- 3/2. Finally, we must note that a slope <strong>of</strong> - 3/2<br />
indicates that the increase in mean biomass <strong>of</strong> a plant<br />
in a self-thinning population is faster than the reduction<br />
in density due to mortality. However, yield cannot<br />
indefinitely increase, since in every environment there<br />
will be a maximum total yield that a species may<br />
achieve. In this situation we might expect the thinning<br />
line to have a slope <strong>of</strong> - 1 indicating that the total<br />
yield per unit area remains constant. Lonsdale <strong>and</strong><br />
2.5 .5 Competition in Patella cochlear<br />
Branch (1975) studied the effects <strong>of</strong> intraspecific<br />
competition on the limpet Patella cochlear, making<br />
observations on natural populations in South Africa<br />
varying in density from 125 to 1225 m-2. This species<br />
feeds mainly on the alga, Lithothamnion, which grows<br />
not only on the limpets' rocky substrate, but also on<br />
the limpet shells themselves. Thus, the total amount <strong>of</strong><br />
food (based on the total surface area) remains approximately<br />
constant. As density rises, however, the juvenile<br />
limpets increasingly live <strong>and</strong> feed on the shells <strong>of</strong><br />
adults, so that competition for space is largely eliminated.<br />
But there is ever more intense competition for<br />
food. Some <strong>of</strong> Branch's results are illustrated in<br />
Fig. 2.18.
CHAPTER 2: INTRASPECIFIC COMPETITION 49<br />
Fig. 2.18 Intraspecific competition in a limpet. (a) Maximum<br />
length (0) <strong>and</strong> biomass ( X ) <strong>of</strong> the limpet, Patella cochlear, in<br />
relation to density. (b) Size distributions <strong>of</strong> the limpets at<br />
three densities. (c) The effect <strong>of</strong> intraspecific competition on<br />
the limpets' gametic output. (Data from Branch, 1975.)<br />
Figure 2.18a shows that as density increases, there<br />
is a compensatory reduction in limpet size, leading to<br />
a stabilization <strong>of</strong> the total biomass at around 125 g<br />
mP2 for all densities in excess <strong>of</strong> around 450 m-2. The<br />
regulatory properties <strong>of</strong> intraspecific competition <strong>and</strong><br />
the plasticity <strong>of</strong> individual response are both readily<br />
apparent. It is clear from Fig. 2.18b, however, that<br />
consideration <strong>of</strong> only the mean or the maximum size<br />
<strong>of</strong> limpets would be very misleading; the size distribution<br />
undoubtedly alters as density increases. The<br />
reason appears to be that at low densities there is little<br />
juvenile mortality, most individuals reach the adult<br />
stage, <strong>and</strong> (large) adults come to dominate the population.<br />
As density <strong>and</strong> intraspecific competition increase,<br />
however, there is increased juvenile mortality<br />
<strong>and</strong> decreased rates <strong>of</strong> growth, so that at high densi-<br />
ties there are comparatively few (large) adults. Once<br />
again, the effect <strong>of</strong> intense intraspecific competition is<br />
a population dominated (numerically) by suppressed<br />
weaklings.<br />
Branch had previously established that larger animals<br />
produce proprtionally more gametes. Thus, the<br />
changing size distribution <strong>of</strong> the population, despite<br />
the stabilization <strong>of</strong> biomass, would be expected to lead<br />
to a reduced gametic output as density increased. This<br />
is confirmed in Fig. 2.18c, where once again the use <strong>of</strong><br />
k-values has proved instructive. At low densities<br />
(where there is little evidence <strong>of</strong> a sudden threshold)<br />
the reduction in size does not compensate for the<br />
increase in density (b < l), <strong>and</strong> the total gametic<br />
output increases. However, at high densities there is<br />
increasing overcompensation (b > l), <strong>and</strong> the total<br />
gametic output decreases at an accelerating rate. Once<br />
again, there is a moderate density (around 430 mP2),<br />
at which b = l <strong>and</strong> the gametic output is at its<br />
maximum. The ultimate, regulatory effects <strong>of</strong> intraspecific<br />
competition are acting on the contributions<br />
<strong>of</strong> limpets to future generations.
50 PART l : SINGLE-SPECIES <strong>POPULATION</strong>S<br />
2.5.6 Competition in the fmit fly<br />
As a second zoological example, we will consider the<br />
experimental work <strong>of</strong> Bakker (1961) on competition<br />
between larvae <strong>of</strong> the fruit fly, Drosophila melanogaster.<br />
Bakker reared newly hatched larvae at a range <strong>of</strong><br />
densities. Some <strong>of</strong> his results are illustrated in<br />
Fig. 2.19. As far as larval mortality is concerned,<br />
intraspecific competition appears to approach pure<br />
scramble. There is a sudden threshold at a density <strong>of</strong><br />
around 2 larvae mg-l yeast, <strong>and</strong> mortality thereafter<br />
very quickly reaches 100%. But the simplicity <strong>of</strong> this<br />
situation-<strong>and</strong> its similarity to pure scramble-is very<br />
largely an illusion. Up to the threshold density, competition<br />
has little or no effect on larval mortality; but<br />
the growth-rate <strong>of</strong> the larvae is very much affected, as<br />
is their final weight at pupation. Moreover, it is well<br />
known that in D. melanogaster small larvae lead to<br />
small pupae, which lead to small adults; <strong>and</strong> that<br />
these small adults, if female, produce comparatively<br />
Fig. 2.19 The effects <strong>of</strong> intraspecific competition for food in<br />
the fruitfly Drosophila melanogaster. For adult weight loss, a<br />
variable number <strong>of</strong> larvae competed for a constant amount<br />
<strong>of</strong> food. For larval mortality, a constant number <strong>of</strong> larvae<br />
were given a variable amount <strong>of</strong> food. (Data from Bakker,<br />
1961; after Varley et al., 1975.)<br />
few eggs. As Fig. 2.19 shows, with increasing larval<br />
density there is a decrease in the size <strong>of</strong> adults<br />
produced; this will lead to a decrease in the number <strong>of</strong><br />
eggs contributed to the next generation. Hence, even<br />
below the threshold for the larval mortality, intraspecific<br />
competition is exerting a density-dependent regulatory<br />
effect on the D. melanogaster~larvae. But it is<br />
the quality, not the quantity, <strong>of</strong> larvae which is<br />
affected, <strong>and</strong>, ultimately, their contribution to the next<br />
generation which is reduced. Above the mortality<br />
threshold, the larvae are so reduced in size that they<br />
are not even large enough to pupate; when this<br />
happens they eventually die.<br />
Clearly, in animals as in plants, intraspecific competition<br />
is very much more complicated than scramble<br />
or contest. Moreover, the complications-lack <strong>of</strong> a<br />
sudden threshold, individual variability <strong>and</strong> so onare<br />
very largely the same in both major kingdoms.<br />
2.6 Negative competition<br />
Finally, we need to consider an interaction which is<br />
beyond the spectrum <strong>of</strong> intraspecific competition dealt<br />
with so far. It is an example <strong>of</strong> a situation in which<br />
fecundity increases (or mortality decreases) with rising<br />
density. Birkhead (1977) studied breeding success in<br />
the common guillemot (Uria aalge) on Skomer Isl<strong>and</strong>,<br />
South Wales. The birds breed there in several subcolonies<br />
<strong>of</strong> differing density. Female guillemots lay just<br />
one egg, <strong>and</strong> a pair <strong>of</strong> birds can be considered<br />
successful if they rear their chick until fledging. By<br />
visiting the various sub-colonies at least once a day<br />
throughout the breeding season, Birkhead was able to<br />
make careful observations on the losses <strong>of</strong> eggs <strong>and</strong><br />
chicks, <strong>and</strong> could compute the percentage <strong>of</strong> pairs<br />
breeding successfully. His results are shown in<br />
Fig. 2.20. It is quite clear that as density increases,<br />
breeding success, <strong>and</strong> thus fecundity, also increases.<br />
This is a case <strong>of</strong> inverse density-dependence. Competition<br />
is actually negative, <strong>and</strong> might more properly be<br />
called cooperation. Indeed, cooperation does appear to<br />
be the explanation for these results. Great blackbacked<br />
<strong>and</strong> herring gulls are both important predators<br />
<strong>of</strong> the eggs <strong>and</strong> chicks <strong>of</strong> guillemots on Skomer, <strong>and</strong><br />
denser groups are less susceptible to predation,
CHAPTER 2: INTRASPECIFIC COMPETITION 51<br />
Fig. 2.21 The 'AIIee effect' (Allee, 1931). Density-dependent<br />
birth at moderate <strong>and</strong> high densities leads to a stable<br />
carrying-capacity, K, but the change to inversely densitydependent<br />
birth at IOW densities leads to an unstable<br />
equilibrium, U, below which the population will decline to<br />
extinction (see also Fig. 2.2).<br />
Fig. 2.20 Cooperation: the effect <strong>of</strong> density on breeding<br />
success in subpopulations <strong>of</strong> the common guiIlemot Uria<br />
aalge on Skomer. (Data from Birkhead, 1977.)<br />
because a number <strong>of</strong> guillemots are able (together) to<br />
deter gulls by lunging at them. Thus, our spectrum <strong>of</strong><br />
competition (<strong>and</strong> density-dependence) must for completeness,<br />
be extended to 'cooperation' <strong>and</strong> inverse<br />
density-dependence. Not surprisingly, just as there is a<br />
regulatory tendency associated with densitydependence,<br />
there is a destabilizing tendency associated<br />
with inverse density-dependence. This is<br />
illustrated diagrammatically for the guillemots on the<br />
left-h<strong>and</strong> side <strong>of</strong> Fig. 2.21, in which birth-rate rises<br />
with density while death-rate remains constant. Small<br />
populations get smaller still (because death-rate exceeds<br />
birth-rate), while larger populations increase in<br />
size (because birth-rate exceeds death-rate). However,<br />
it is likely that these destabilizing tendencies will<br />
disappear <strong>and</strong> then be reversed as population size<br />
increases <strong>and</strong> the canrying-capacity is approached.<br />
The situation over all densities, therefore, is likely to<br />
be as illustrated in the whole <strong>of</strong> Fig. 2.21, <strong>and</strong> is<br />
known as the 'Allee effect' (Allee, 1931). The regulatory<br />
density-dependent effects to the right <strong>of</strong> the figure<br />
are easy to image. The destabilizing inversely densitydependent<br />
effects to the left <strong>of</strong> the figure could result<br />
from cooperation (as with the guillemots), or from<br />
certain other problems associated with low density<br />
(mate-finding, for instance). We shall consider the<br />
Allee effect again in section 5.13.3.
Chapter 3<br />
3. l Introduction<br />
It would be easy to follow one example <strong>of</strong> intraspecific<br />
competition with another; each would, in some way,<br />
be different from the rest. However, science progresses<br />
by not merely accumulating facts but by discovering<br />
patterns. We must, therefore, try to pin-point those<br />
features <strong>of</strong> the organism <strong>and</strong> its environment which<br />
are common to many, or even all, <strong>of</strong> the special cases.<br />
We can then concentrate on these essential features in<br />
our attempts to underst<strong>and</strong> the dynamics <strong>of</strong> populations<br />
in general. We may even be able to discover how<br />
best to control the distribution <strong>and</strong> abundance <strong>of</strong><br />
organisms, or how to predict the responses <strong>of</strong><br />
populations to proposed or envisaged alterations in<br />
their environment. But in order to do this-or even to<br />
make a start in doing this-we require a general<br />
conceptual framework on which each special case can<br />
be fitted. We require a system that embodies everythiig<br />
that the special cases have in common, but<br />
which, by manipulation <strong>of</strong> its parts, can be made to<br />
mirror each <strong>of</strong> the special cases in turn. In short, we<br />
require a model.<br />
As Levins (1968) has suggested, our perfect model<br />
would be maximally general, maximally realistic,<br />
maximally precise <strong>and</strong> maximally simple. However, in<br />
practice, an increase in one <strong>of</strong> these characteristics<br />
leads to decreases in the others. Each model is,<br />
therefore, an imperfect compromise, <strong>and</strong> it is in this<br />
light that models <strong>of</strong> population dynamics should be<br />
seen. Mostly they sacrifice precision <strong>and</strong> a certain<br />
amount <strong>of</strong> realism, so as to retain a high degree <strong>of</strong><br />
generality <strong>and</strong> simplicity. They are usually in the form<br />
<strong>of</strong> an equation or equations illustrated by graphs, but<br />
may, occasionally, be in the form <strong>of</strong> graphs without<br />
accompanying equations.<br />
To be useful, <strong>and</strong> therefore successful, our model <strong>of</strong><br />
single-species population dynamics should be:<br />
1 a satisfactory description <strong>of</strong> the diverse systems <strong>of</strong><br />
the natural <strong>and</strong> experimental worlds;<br />
2 an aid to enlightenment on aspects <strong>of</strong> population<br />
dynamics which had previously been unclear; <strong>and</strong><br />
3 a system which can be easily incorporated into<br />
more complex models <strong>of</strong> interspecific interactions.<br />
We will begin by imagining a population with<br />
discrete generations, i.e. one in which breeding occurs<br />
in particular seasons only. Having developed a model<br />
for this situation, we can return to populations with<br />
continuous breeding to develop an analogous mode1 in<br />
a similar fashion.<br />
3.2 Populations breeding<br />
at discrete intervals<br />
3.2.1 The basic equations<br />
Suppose that each individuals in one generation gives<br />
rise to two individuals in the next. If we begin with 10<br />
individuals in the first generation, then the series <strong>of</strong><br />
population sizes in succeeding generations will obviously<br />
be: 20, 40, 80, 160 <strong>and</strong> so on. This factor by<br />
which population size is multiplied each generation is<br />
commonly called the reproductive-rate, <strong>and</strong> we can<br />
denote it by R, i.e. in the above example R = 2.<br />
Note immediately that we are assuming that a single<br />
figure can characterize reproduction for a whole (presumably.<br />
heterogeneous) population on all occasions.<br />
Note also, that since 'reproduction' is equivalent to<br />
'birth minus death', we have avoided dealing with<br />
birth <strong>and</strong> death separately. R is, therefore, a 'net rate<br />
<strong>of</strong> increase' or 'net reproductive-rate'.<br />
We can denote the initial population size (10 in our<br />
example) by No, meaning the population size when no<br />
time has elapsed. Similarly when one generation has<br />
elapsed the population size is N,, when two generations<br />
have elapsed it is N, <strong>and</strong>, generally, when t<br />
generations have elapsed the population size is Nt.<br />
Thus:
CHAPTER 3: MODELS OF SINGLE-SPECIES <strong>POPULATION</strong>S 53<br />
No = 10,<br />
N1 = 20,<br />
that is:<br />
Nl=NoxR<br />
<strong>and</strong>, for instance:<br />
N,=N~XR=N~XR~RXR=N,R~=~~.<br />
In general terms:<br />
N, + , = N, R (a difference equation)<br />
<strong>and</strong><br />
N, = No Rt<br />
It is plain to see, however, that these equations lead<br />
to populations which continue to increase in size<br />
indefinitely. The next, obvious step, therefore, is to<br />
make the net reproductive-rate subject to intraspecific<br />
competition. To do this we will incorporate intraspecific<br />
competition into the difference equation.<br />
Consider Fig. 3.1. the justification for point A is as<br />
follows: when the population size (N,) is very, very<br />
small (virtually zero), there is little or no competition<br />
in the population, <strong>and</strong> the net reproductive-rate (R)<br />
does not require modification. It is still true, therefore,<br />
that N, + , = N,R, or, rearranging the equation:<br />
As population size increases, however, there is more<br />
<strong>and</strong> more competition, <strong>and</strong> the actual net reproductive-rate<br />
is increasingly modified by it. There must<br />
presumably come a point at which competition is so<br />
great, <strong>and</strong> net reproductive-rate so modified, that the<br />
population can do no better than replace itself each<br />
generation. In other words, N, + , is merely the same as<br />
N, (no greater), <strong>and</strong> N, IN, + , equals 1. The population<br />
size at which this occurs, as we have already seen, is the<br />
caving-capacity <strong>of</strong> the population, denoted by K. This<br />
is the justification for point B in Fig. 3 .l.<br />
It is clear, then, that as population size increases<br />
from point A to point B the value <strong>of</strong> N, IN, + , must also<br />
rise. But it is for simplicity's sake, <strong>and</strong> only for<br />
simplicity's sake, that we assume this rise follows the<br />
straight line in Fig. 3.1. This is because all straight<br />
lines are <strong>of</strong> the simple form: y = (slope) X + (intercept).<br />
The value for the 'intercept' is clearly 11R. That for the<br />
'slope', considering the portion between points A <strong>and</strong><br />
B, is (1- 1lR)K. The equation <strong>of</strong> our straight line is,<br />
therefore:<br />
which, by simple rearrangement, gives:<br />
It is probably simpler to replace (R - 1)lK by a <strong>and</strong><br />
remember:<br />
The new reproductive-rate (repacing the unrealistically<br />
constant R) is, therefore:<br />
Fig. 3.1 The inverse <strong>of</strong> generation increase (NJN, + ,) rising<br />
with density (N,). For further discussion, see text.
54 PART 1: SINGLE-SPECIES <strong>POPULATION</strong>S<br />
We can now examine the properties <strong>of</strong> this equation<br />
<strong>and</strong> the net reproductive-rate within it, to see if it is<br />
satisfactory; <strong>and</strong> in some respects it certainly is.<br />
Figure 3.2 shows a population increasing in size from<br />
very low numbers under the influence <strong>of</strong> equation 3.3.<br />
In the first place, when numbers are very low, the<br />
population increases in the same, 'exponential' fashion<br />
as a population unaffected by competition (equation<br />
3.1). In other words, when:<br />
N, approaches 0,<br />
1 + UN, approaches 1,<br />
<strong>and</strong><br />
R approaches R.<br />
1 + aNt<br />
During this initial phase, therefore, the rate at which<br />
the population increases in size is dependent only on<br />
the size <strong>of</strong> the population <strong>and</strong> the potential net<br />
reproductive-rate (R) <strong>of</strong> the individuals within it.<br />
The larger N, becomes, however, (<strong>and</strong> thus the more<br />
competition there is) the larger 1 + UN, becomes, <strong>and</strong><br />
the smaller the actual net reproductive-rate<br />
[R/(l + UN,)] becomes. This situation, in which the net<br />
reproductive-rate is under density-dependent control,<br />
is responsible for the 'S-shaped' or sigmoidal nature <strong>of</strong><br />
the curve shown in Fig. 3.2. It is important to note,<br />
however, that while such a sigmoidal increase is de-<br />
sirable, in as much as its shows our population gradually<br />
approaching the carrying-capacity (K) first<br />
mentioned in Chapter 2, equation 3.3 is only one <strong>of</strong><br />
many that would lead to such a pattern. We chose<br />
equation 3.3 because <strong>of</strong> its simplicity.<br />
At the top <strong>of</strong> the curve, N, approaches K, so that:<br />
Thus,<br />
<strong>and</strong><br />
Nt=K=Nt+l =Nt+z=Nt+3, etc.<br />
If, however, the population is perturbed such that Nt<br />
exceeds K, then:<br />
(R - 1)Nt<br />
l+- K<br />
> R.<br />
<strong>and</strong><br />
W+,
CHAPTER 3: MODELS OF SINGLE-SPECIES <strong>POPULATION</strong>S 55<br />
that the %-value' <strong>of</strong> any population process is given<br />
by:<br />
k = loglo (no, produced) - log,, (no. sumi~ng).<br />
In the case <strong>of</strong> our equation, therefore:<br />
the k versus log,& graph) varying from zero to<br />
infinity.<br />
One such general model (<strong>and</strong> there are others), was<br />
originally proposed by Hassell (1975). It is a simple<br />
modification <strong>of</strong> equation 3.3 :<br />
We also know, from Chapter 2, that the type <strong>of</strong><br />
intraspecific competition can be determined from a<br />
graph <strong>of</strong> k against loglON,. Figure 3.3 shows a series <strong>of</strong><br />
such plots for a variety <strong>of</strong> values for a <strong>and</strong> NO. In each<br />
case the slope <strong>of</strong> the graph approaches 1. In other<br />
words, in each case the density-dependence begins by<br />
undercompensating, <strong>and</strong> approaches exact compensation<br />
at higher values <strong>of</strong> N,. Our model, therefore, lacks<br />
the generality we would wish it to have. But such<br />
generality is easily incorporated, All we require is a<br />
model that can give us, potentially, b-values (slopes <strong>of</strong><br />
As Fig. 3.4 indicates, plots <strong>of</strong> k against logloNt will<br />
now approach b rather than 1, irrespective <strong>of</strong> the<br />
values <strong>of</strong> a <strong>and</strong> No. This equation can, therefore,<br />
describe populations reacting in a whole range <strong>of</strong> ways<br />
to the effects <strong>of</strong> competition, <strong>and</strong> b is the parameter<br />
which measures this degree <strong>of</strong> under- or overcompensation.<br />
This whole range is only apparent at higher<br />
aensities (competition gradually increasing in intensity<br />
as N, increases); but when we remember the actual<br />
examples considered in Chapter 2, this seems if anything,<br />
a positive advantage <strong>of</strong> the model. Note, however,<br />
that we have still not specified whether it is<br />
births or deaths or both which are being affected: to do<br />
this would require an even more complex model.<br />
Fig. 3.3 The intraspecific competition inherent in<br />
Fig, 3.4 The range <strong>of</strong> intraspecific competition which can<br />
equation 3.3. The final slope (<strong>of</strong> k against logloN,) is unity be expressed by equation 3.4. At higher densities, the slope<br />
(exact compensation), irrespective <strong>of</strong> the starting density No, <strong>of</strong> k against log,,N, reaches the value <strong>of</strong> the constant b in<br />
or the constant a ( = (R- 1)lK). the equation, irrespective <strong>of</strong> No <strong>and</strong> a.
56 PART l : SINGLE-SPECIES <strong>POPULATION</strong>S<br />
Nevertheless, provided we remember that we are<br />
dealing with a net rate <strong>of</strong> increase, equation 3.4 can<br />
be a useful, simple model.<br />
3.2.3 Models for annual plants<br />
The same model can also be applied to annual plants<br />
with discrete generations. A convenient starting point<br />
is the law <strong>of</strong> constant final yield (see Fig. 2.6), the<br />
underlying relationship between biomass <strong>and</strong> density<br />
being an inverse one (see Fig. 2.7). Early workers<br />
expressed this in a variety <strong>of</strong> mathematical models (see<br />
Willey & Heath, 1969 for a review) but we will<br />
concentrate on one recent development. Watkinson<br />
(1980) used a generalized expression that can describe<br />
both asymptotic <strong>and</strong> parabolic yield responses to<br />
density <strong>and</strong> also allows a biological interpretation <strong>of</strong><br />
the constants involved. It expresses average plant size<br />
in the populations, E, as both a function <strong>of</strong> plant size<br />
in the absence <strong>of</strong> competition wm <strong>and</strong> population<br />
density, N, after the action <strong>of</strong> competition (i.e. at<br />
harvest);<br />
Fig. 3.5 The two general yield-density responses in plant<br />
In this, there is clearly more than a passing similar- populations expressed on a unit area basis (a) <strong>and</strong> on an<br />
ity to equation 3.4. The term (1 + UN) here acts in a individual plant basis (b), according to equation 3.5. The<br />
number identical to that in eauation 3.4. while b dotted line indicates a constant proportional relationship<br />
allows the incorporation <strong>of</strong> a<br />
between yield <strong>and</strong> sowing density. (1) Exact com~ensation.<br />
<strong>of</strong> com~ensato~<br />
b = 1; (2) overcompensation, b = 1.5. In both cases,<br />
responses; wm 9 like NR in equation 3.4 is 'what is<br />
= 100 <strong>and</strong> a = 0.1. (b) the Values <strong>of</strong> the terms in<br />
achieved' in the absence <strong>of</strong> competition.<br />
equation 3.5 are indicated for the two yield responses. (The<br />
To appreciate the features <strong>of</strong> this model we will value <strong>of</strong> 1.5 in curve (2) has no particular significance to<br />
explore the hypothetical data presented in Fig. 3Sa, the power term <strong>of</strong> the self-thinning line.) Plant mortality is<br />
which shows the two general forms <strong>of</strong> the yield absent.<br />
response curve that we have already discussed (the<br />
range <strong>of</strong> units on the axes <strong>of</strong> the graph are arbitrary).<br />
Figure 3.5b shows the corresponding data for mean both depart appreciably from the density-independent<br />
individual plant size (measured perhaps as biomass) line <strong>of</strong> constant proportionality (dotted) at N = 10 <strong>and</strong><br />
plotted against density. Note initially that the maxi- this in fact is the reciprocal <strong>of</strong> a in equation 3.5. We<br />
mum competition-free plant size (W,) is 100 units <strong>of</strong> can see from Fig. 3.5b that it is at this density that<br />
biomass. Generally speaking, the pattern <strong>of</strong> divergence individual plant size begins to be depressed. The<br />
<strong>of</strong> the two types <strong>of</strong> response is determined by the reciprocal <strong>of</strong> this density (i.e. a) is then broadly an<br />
values <strong>of</strong> the two parameters a <strong>and</strong> b in equation 3.5. estimate <strong>of</strong> the space required for one isolated plant to<br />
For convenience, however, the value <strong>of</strong> a ( = 0.1) is grow to maximum size. In this arbitrary case, it is<br />
common to both curves. In Fig. 3.5, curves 1 <strong>and</strong> 2 clearly 0.1 units <strong>of</strong> area. This area has been called the
CHAPTER 3: MODELS OF SINGLE-SPECIES <strong>POPULATION</strong>S 57<br />
'ecological neighbourhood area' (Antonovics & Levin,<br />
1980; Watkinson, 1981).<br />
Where exact compensation for density is occurring<br />
at high density-curve 1 in Fig. 3.5a-plant biomass is<br />
directly inversely proportional to density. The slope <strong>of</strong><br />
the line is - 1 (Fig. 3.5b), i.e. b = l. Overcompensation,<br />
reflected by values <strong>of</strong> b > l, results in an enhanced<br />
proportional reduction <strong>of</strong> plant size with density (the<br />
slope <strong>of</strong> the line in Fig. 3.5b is steeper) <strong>and</strong> yield per<br />
unit area is depressed at high density below a maximum<br />
occurring at an intermediate one.<br />
The model's most conspicuous <strong>and</strong> valuable features<br />
are that it has the generality to describe the<br />
whole range <strong>of</strong> yield-density responses in the absence<br />
<strong>of</strong> mortality (via the constants a <strong>and</strong> b) <strong>and</strong> that the<br />
parameters in the model are biologically interpretable.<br />
Equation 3.5, however, does not incorporate mortality<br />
<strong>of</strong> plants. A number <strong>of</strong> studies have shown that<br />
the relationship between density before <strong>and</strong> after the<br />
action <strong>of</strong> density-dependent mortality follows the<br />
graphical form shown in Fig. 3.6. The mathematical<br />
description <strong>of</strong> this is another variant <strong>of</strong> equations 3.3<br />
<strong>and</strong> 3.4:<br />
Where Ni is the number <strong>of</strong> plants sown, N is the<br />
number surviving <strong>and</strong> llm is the maximum popula-<br />
Fig. 3.6 Population sizes before (N,) <strong>and</strong> after (N) densitydependent<br />
mortality. The curve follows the equation<br />
N = Ni(l + mN,)-l.<br />
tion size that can (asymptotically) be reached. We can<br />
now combine equations 3.5 <strong>and</strong> 3.6 to give a model<br />
describing the relationship between i? <strong>and</strong> N where<br />
there are effects both on mortality <strong>and</strong> growth.<br />
In equation 3.5<br />
but N is the number <strong>of</strong> plants at harvest which is given<br />
by equation 3.6. Hence, by substitution,<br />
Furthermore, to calculate yield per unit area at harvest<br />
we merely have to multiply i?, (the average plant<br />
weight) by N (the density at harvest). We can now<br />
examine graphically the behaviour <strong>of</strong> this model in<br />
Fig. 3.7, which shows the yield <strong>of</strong> a population <strong>of</strong><br />
plants after density-dependent regulation, in relation<br />
to starting population size. In this simulation, as before,<br />
each plant when grown under isolated conditions<br />
requires 0.1 units <strong>of</strong> area (a) to achieve a maximum<br />
size <strong>of</strong> 100 biomass units (W,). Where there is exact<br />
compensation at high densities (b = l), the effect <strong>of</strong><br />
decreasing the maximum population size attainable<br />
(llm) is to lower yield. If, however, there is overcompensation<br />
(b > 1) the shape <strong>of</strong> the yield-density curve<br />
depends on the intensity <strong>of</strong> density-dependent mortality<br />
(governed through m) in relation to the ecological<br />
neighbourhood area (a). Overt overcompensation is<br />
greatest when the potential maximum population size<br />
(llm) is highest. Hence, the model has the generality to<br />
encompass the range <strong>of</strong> density responses which we<br />
know to occur. Furthermore, it incorporates the basic<br />
mechanisms <strong>of</strong> plasticity <strong>and</strong> mortality that are part <strong>of</strong><br />
the response. We must bear in mind though that it is<br />
only a static description <strong>of</strong> an essentially dynamic<br />
process occurring within plant populations.<br />
Up to now we have been concerned only with the<br />
relationship between plant size after the action <strong>of</strong><br />
competition <strong>and</strong> initial population density (i.e. at<br />
sowing), but it is a relatively easy step to extend our<br />
model to one that describes changes from generation<br />
to generation. To do this we need to know the<br />
relationship between plant biomass at harvest, G, <strong>and</strong><br />
the number <strong>of</strong> seeds prbduced per plant, S. Often this<br />
may be described by
In<br />
58 PART l : SINGLE-SPECIES <strong>POPULATION</strong>S<br />
Fig. 3.7 The relationship between<br />
initial population size Ni <strong>and</strong> yield<br />
per unit area as determined by<br />
equations 3.6 <strong>and</strong> 3.7. Constants in<br />
the model are a = 0.1, W, = 10,<br />
b = l .0 (solid line), b = 1.5 (dotted<br />
lines). Values <strong>of</strong> m as indicated.<br />
Where q <strong>and</strong> p are constants describing the exact form<br />
<strong>of</strong> the relationship. We may therefore express seed<br />
number per plant at harvest as a function <strong>of</strong> seeds<br />
sown in an identical way to equation 3.7:<br />
S = h(l + aNi(l + m~~)-l)-~<br />
where h is the number <strong>of</strong> seeds produced by a plant in<br />
isolated (non-competitive) conditions. Multiplying<br />
both sides <strong>of</strong> the equation by the number <strong>of</strong> surviving<br />
plants gives us the seed yield per unit area, <strong>and</strong> hence<br />
we have a population model relating the number <strong>of</strong><br />
seeds sown to those harvested. Thus<br />
equation 3.4 <strong>and</strong> will <strong>of</strong> course display the properties<br />
already discussed.<br />
3.3 Continuous breeding -<br />
We can now return to populations which breed continuously.<br />
For our - purposes, - the essential difference<br />
between these <strong>and</strong> ones with discrete generations is<br />
that population size itself changes continuously rather<br />
than in discrete 'jumps'. This is illustrated in Fig. 3.8.<br />
Since Ni <strong>and</strong> SN are the population sizes in successive<br />
generations, we may replace them by Nt <strong>and</strong> N, + ,,<br />
remembering that we are dealing with populations <strong>of</strong><br />
seeds. Upon rearrangement our model becomes<br />
On inspection, this too is very similar to equation 3.4,<br />
differing only in so far as it includes an additional term<br />
Fig. 3.8 Three populations growing exponentially at the<br />
for densit~-de~endent SJ,. mmt the absence same rate. A has long, discrete generations; B has short,<br />
<strong>of</strong> mortality (m = 01, this model contracts to discrete generations: C breeds continuously.
CHAPTER 3: MODELS OF SINGLE-SPECIES <strong>POPULATION</strong>S 59<br />
Curves A <strong>and</strong> B are both <strong>of</strong> the form ZV, , + = Nt R, <strong>and</strong><br />
represent populations increasing (exponentially) at<br />
essentidy the same rate. ('Rate' in this case means 'the<br />
amount by which population size (Nt) increases per<br />
unit time (t)'.) The difference between them is that<br />
generation time is much shorter in curve B than curve<br />
A. The same process has been extended in curve C until<br />
the straight line segments are so small (infinitesimally<br />
small) that the graph is a continuous curve. Nevertheless,<br />
the rate at which the population increases has<br />
remained essentially the same. Curve C describes a<br />
situation in which, during each <strong>and</strong> every exceedingly<br />
small time interval, there is the possibility, at least, <strong>of</strong><br />
birth <strong>and</strong> death. In other words, breeding <strong>and</strong> dying are<br />
continuous. Thus, the initial equation we require in<br />
order to build our general model <strong>of</strong> a continuously<br />
breeding population must retain the essential properties<br />
<strong>of</strong> N, = NORt, but must describe a continuous curve.<br />
Diferentiation is a mathematical process which is<br />
specifically designed to deal with changes occurring<br />
during infinitesimally small intervals <strong>of</strong> time (or <strong>of</strong> any<br />
other measurement on the x-axis). Those familiar with<br />
differential calculus will clearly see (<strong>and</strong> those unfamiliar<br />
with it need merely accept) that differentiating<br />
N, = h Rt by t we get:<br />
the size <strong>of</strong> the population <strong>and</strong> the reproductive-rate <strong>of</strong><br />
individuals.<br />
We can proceed now in Fig. 3.9 exactly as we did in<br />
Fig. 3.1. The rate <strong>of</strong> increase per individual is unaffected<br />
by competition when N approaches zero, <strong>and</strong> is,<br />
therefore, given by r (point A). When N reaches K, the<br />
carrying-capacity, the rate <strong>of</strong> increase per individual is<br />
0 (point B). As before, we assume that the line<br />
between A <strong>and</strong> l3 is straight, <strong>and</strong> thus:<br />
<strong>and</strong><br />
This is the so-called Iogistic equation. Its characteristics<br />
are essentially the same as those <strong>of</strong> the difference<br />
equation 3.3 described previously. Minor dissimilarities,<br />
associated with the change from the difference to<br />
the differential form, will be discussed later; <strong>and</strong>, <strong>of</strong><br />
course, it describes a continuous sigmoidal curve,<br />
<strong>and</strong><br />
This is the equation we require, dN/dt is the slope <strong>of</strong> the<br />
curve, defining the rate at which population size<br />
increases with time. log, R is usually replaced by r, 'the<br />
intrinsic rate <strong>of</strong> natural increase' or 'instantaneous<br />
rate <strong>of</strong> increase', but the change from R to r is simply<br />
a change <strong>of</strong> currency: the commodity dealt with<br />
remains the same (essentially 'birth minus death').<br />
The diferential equation dNldt = rN, just like the difference<br />
equation N, +, = N,R, describes a situation <strong>of</strong><br />
exponential population increase dependent only on<br />
Fig. 3.9 The rate <strong>of</strong> increase per individual dNdt 1/N<br />
falling with density (N). For further discussion, see text.
60 PART 1 : SINGLE-SPECIES <strong>POPULATION</strong>S<br />
rather than a series <strong>of</strong> straight lines. Note once again,<br />
moreover, that there are many other equations which<br />
would lead to sigmoidal increase; the justification <strong>of</strong><br />
the logistic is the simplicity <strong>of</strong> its derivation. Note, too,<br />
that the logistic equation is based on exact compensation,<br />
in just the same way as its discrete generation<br />
analogue. In the case <strong>of</strong> the logistic, however, it is by<br />
no means easy to incorporate a factor, such as b,<br />
which will generalize the model to cover all types <strong>of</strong><br />
competition. Our equation for a continuously breeding<br />
population must, therefore, remain comparatively<br />
imperfect.<br />
Drawing these arguments together then, we are left<br />
with two equations: equation 3.4 as an apparently<br />
satisfactory general model for discrete-generation increase<br />
<strong>and</strong> equation 3.8 as a somewhat less satisfactory<br />
model for the behaviour <strong>of</strong> a continuously<br />
breeding population.<br />
3.4 The utility <strong>of</strong> the equations<br />
3.4.1 Causes <strong>of</strong> population fluctuations<br />
We can now proceed to examine the models' utility.<br />
The extent to which they can be incorporated into more<br />
complex models <strong>of</strong> interspecific interactions will become<br />
apparent in Chapters 4 <strong>and</strong> 5. We shall begin<br />
here by determining whether our models can indeed<br />
throw important new light on aspects <strong>of</strong> population<br />
dynamics. To do so we shall examine the question <strong>of</strong><br />
fluctuations in the sizes <strong>of</strong> natural, single-species population~.<br />
That some degree <strong>of</strong> fluctuation in size is shown<br />
by all natural populations hardly needs stressing.<br />
The causes <strong>of</strong> these fluctuations can be divided into<br />
two groups; extrinsic <strong>and</strong> intrinsic factors. Amongst<br />
the extrinsic factors we include the effects <strong>of</strong> other<br />
species on a population, <strong>and</strong> the effects <strong>of</strong> changes in<br />
environmental conditions. These are topics which will<br />
be discussed in later chapters. For now, we will<br />
concern ourselves with intrinsic factors. Our approach<br />
will be to examine our models to see which values <strong>of</strong><br />
the various parameters, <strong>and</strong> which minor alterations<br />
to the models themselves, lead to population fluctuations;<br />
<strong>and</strong> to see what type <strong>of</strong> fluctuation they lead to.<br />
The method by which our discrete-generation equa-<br />
tion may be examined has been set out <strong>and</strong> discussed<br />
by May (1975). It is a method which uses fairly<br />
sophisticated mathematical techniques, but we can<br />
ignore these <strong>and</strong> concentrate on May's results. These<br />
are summarized in Fig. 3.10. Remember that<br />
Fig. 3.10a refers to equation 3.4. It describes the way<br />
in which populations fluctuate (Fig. 3.10b) with different<br />
values <strong>of</strong> R <strong>and</strong> b inserted. (The value <strong>of</strong> a, i.e.<br />
(R - 1)/K, determines the level about which populations<br />
fluctuate, but not the manner in which they do<br />
so.) As Fig. 3.10a shows, low values <strong>of</strong> b <strong>and</strong>lor R lead<br />
to populations which approach their equilibrium size<br />
without fluctuating at all. Increases in b <strong>and</strong>lor R,<br />
however, lead firstly to damped oscillations gradually<br />
approaching the equilibrium; <strong>and</strong> then to 'stable limit<br />
cycles' in which the population fluctuates around the<br />
equilibrium level, revisiting the same two, or four, or<br />
even more points time <strong>and</strong> time again. Finally, with<br />
large values <strong>of</strong> b <strong>and</strong> R, we have a population<br />
fluctuating in a wholly irregular <strong>and</strong> chaotic fashion.<br />
The biological significance <strong>of</strong> this becomes apparent<br />
when we remember that our equation was designed to<br />
model a population which regulated itself in a densitydependent<br />
fashion. We can see, however, that if a<br />
population has even a moderate net reproductive-rate<br />
(<strong>and</strong> an individual leaving 100( = R) <strong>of</strong>fspring in the<br />
next generation in a competition-free environment is<br />
not unreasonable), <strong>and</strong> if it has a density-dependent<br />
reaction which even moderately overcompensates,<br />
then far from being stable, it may fluctuate in numbers<br />
without any extrinsic factor acting. Thus, our model<br />
system has taught us that we need not look beyond the<br />
intrinsic dynamics <strong>of</strong> a species in order to underst<strong>and</strong><br />
the fluctuations in numbers <strong>of</strong> its natural populations.<br />
It is worthwhile stressing this. Our intuition would<br />
probably tell us that the ability <strong>of</strong> a population to<br />
regulate its numbers in a density-dependent way<br />
should lend stability to its dynamics. Yet our model<br />
shows us that if this regulation involves a moderate or<br />
large degree <strong>of</strong> overcompensation, <strong>and</strong> at least a<br />
moderate reproductive-rate, then the population's<br />
numbers may fluctuate considerably because <strong>of</strong> those<br />
very 'regulatory' processes. As May, himself, concludes:<br />
'. . .even if the natural world was 100010 predictable,<br />
the dynamics <strong>of</strong> populations with "density-
CHAPTER 3: MODELS OF SINGLE-SPECIES <strong>POPULATION</strong>S 61<br />
Fig. 3.10 The effect <strong>of</strong> intraspecific competition on<br />
population dynamics. (a) The range <strong>of</strong> population<br />
fluctuations (themselves shown in (b)) generated by<br />
equation 3.4 with various combinations <strong>of</strong> b <strong>and</strong> R inserted.<br />
For further discussion, see text. (After May, 1975.)<br />
dependent'' regulation could nonetheless in some<br />
circumstances be indistinguishable from chaos' (see<br />
also section 6.12).<br />
In examining this general model, the special, exactcompensation<br />
case (b = l) has itself been covered.<br />
Irrespective <strong>of</strong> R, the population will reach K without<br />
overshooting; <strong>and</strong> with R-values greater than about<br />
10 this will take little more than a single generation.<br />
(The analogous differential equation-the logisticbehaves<br />
very similarly to this: always approaching K<br />
with exponential damping.) This special case can be<br />
modified, however, to incorporate an additional feature.<br />
We have assumed until now that populations<br />
respond instantaneously to changes in their own density.<br />
Suppose, on the contrary, that the reproductiverate<br />
is determined by the amount <strong>of</strong> resource available<br />
to the population, but that the amount <strong>of</strong> resource is<br />
determined by the density <strong>of</strong> the previous generation.<br />
This will mean that the reproductive-rate is dependent<br />
on the density <strong>of</strong> the previous generation. Thus, since:<br />
N, + , = N, X reproductive-rate<br />
In other words, there is a time-lag in the population's<br />
response to its own density, caused by a time-lag<br />
in the response <strong>of</strong> its resource. The amount <strong>of</strong> grass in<br />
a field in spring being determined by the level <strong>of</strong><br />
grazing the previous year is a simple but reasonable<br />
example <strong>of</strong> this, the behaviour <strong>of</strong> this modified equation,<br />
as shown by computer simulations, is as follows:<br />
R < approx. 1.3 : exponential damping<br />
R approx. 1.3 : damped oscillations.<br />
In comparison, the original equation, without a timelag,<br />
led to exponential damping for all values <strong>of</strong> R. The<br />
time-lag has provoked the fluctuations. Once again,<br />
therefore, examination <strong>of</strong> our model has taught us<br />
which intrinsic features <strong>of</strong> a species' dynamics can<br />
lead to fluctuations in its population density.<br />
In fact, there are other types <strong>of</strong> time-lag <strong>and</strong> they all<br />
tend to provoke fluctuations in density. Consider again<br />
the difference between a population with discrete<br />
generations <strong>and</strong> one with continuous breeding. In<br />
both cases, the population responds throughout each
62 PART 1: SINGLE-SPECIES <strong>POPULATION</strong>S<br />
'time interval' to the density at the start <strong>of</strong> that time<br />
interval. With continuous breeding the time intervals<br />
are infinitesimally small, <strong>and</strong> the response <strong>of</strong> the<br />
population is, therefore, continually changing; conversely<br />
with discrete generations the population is still<br />
responding at the end <strong>of</strong> a time interval to the density<br />
at its start. In the meantime, <strong>of</strong> course, this density has<br />
altered: there is a time-lag. Thus, the difference<br />
equation model is more liable to lead to fluctuations<br />
than the differential logistic, <strong>and</strong> it is the time-lag<br />
which accounts for the difference. Moreover, some<br />
organisms may respond to density at one point in their<br />
life cycle, <strong>and</strong> actually reproduce some time later; this<br />
'developmental time' between response <strong>and</strong> reproduction<br />
is also a time-lag. In all cases, the population is<br />
responding to a situation that has already changed,<br />
<strong>and</strong> an increased level <strong>of</strong> fluctuation is the likely<br />
result.<br />
There are two important conclusions to be drawn<br />
from this discussion. The first is that time-lags, high<br />
reproductive-rates <strong>and</strong> highly overcompensating<br />
densiQ-dependence (either alone or in combination)<br />
are capable <strong>of</strong> provoking all types <strong>of</strong> fluctuation in<br />
population density, without invoking any extrinsic<br />
cause. The second conclusion is that this is clear to us<br />
only because we have studied the behaviour <strong>of</strong> our<br />
model systems.<br />
3.4.2 The equations as descriptions<br />
Finally, we must examine the ability <strong>of</strong> our models to<br />
describe the behaviour <strong>of</strong> natural <strong>and</strong> experimental<br />
systems, There are two aspects <strong>of</strong> this. The first is<br />
concerned with the way in which single-species popu-<br />
Iations increase or fluctuate in size; the second with<br />
the precise way in which intraspecific competition<br />
affects the various facets <strong>of</strong> fecundity <strong>and</strong> survival.<br />
A number <strong>of</strong> examples <strong>of</strong> population increase <strong>and</strong><br />
fluctuation are illustrated in Fig. 3. l l. Figure 3.11a<br />
describes the continuous increase <strong>of</strong> a population <strong>of</strong><br />
yeast cells under laboratory conditions (Pearl, 1927):<br />
the resemblance to the logistic curve is quite striking.<br />
Figure 3.11 b, conversely, describes the year-by-year<br />
change in the size <strong>of</strong> the sheep population <strong>of</strong> Tasmania<br />
(Davidson, 1938). There is no obvious detailed resem-<br />
blance between this <strong>and</strong> the pattern predicted by any<br />
<strong>of</strong> our models. Nevertheless, the initial rise in numbers,<br />
decelerating as it approaches a plateau (albeit a<br />
fluctuating one), is reminiscent <strong>of</strong> the pattern generated<br />
by our difference equation model with b close to<br />
1. If, furthermore, we take into account the fluctuations<br />
in environmental conditions, the interactions <strong>of</strong><br />
the sheep with other species, <strong>and</strong> the undoubted<br />
imperfections <strong>of</strong> the sampling method, then the resemblance<br />
between Fig. 3.11b <strong>and</strong> our model begins<br />
to look more significant. This is the nub <strong>of</strong> our<br />
problem in deciding how satisfactory our models are.<br />
On the one h<strong>and</strong>, the field data, unlike some data<br />
collected under controlled conditions, do not follow<br />
our models' behaviour exactly. On the other h<strong>and</strong>,<br />
there is nothing in the field data to make us reject our<br />
models. We could claim, in fact, that our models<br />
represent a very satisfactory description <strong>of</strong> the population<br />
dynamics <strong>of</strong> sheep in Tasmania, but that the<br />
complexities <strong>of</strong> the real world tend to blur some <strong>of</strong> the<br />
edges. Similar conclusions could be drawn from<br />
Fig. 3.11~-e, although in each case the model concerned<br />
might be slightly different; perhaps a diierent<br />
value for a <strong>and</strong> b, or the addition <strong>of</strong> some sort <strong>of</strong><br />
time-lag. Figure 3 .l lc, for example, would be quite<br />
adequately described by our diierence equation with<br />
R = 20 <strong>and</strong> b = 2; the pattern in Fig. 3.11d could be<br />
accounted for, simply, by environmental fluctuations;<br />
<strong>and</strong> the fluctuations in numbers <strong>of</strong> Daphnia<br />
(Fig. 3.11e) do appear, quite genuinely, to be caused<br />
by a time-lag.<br />
The most reasonable conclusion seems to be this.<br />
Our models seem to be satisfactory, in as much as they<br />
are capable <strong>of</strong> describing the observed patterns <strong>of</strong><br />
increase <strong>and</strong> fluctuation as long as environmental<br />
fluctuations, interspecific interactions <strong>and</strong> the imperfections<br />
<strong>of</strong> sampling are taken into account. Conversely,<br />
the discrepancies between our models <strong>and</strong><br />
our data could be due, quite simply, to the essential<br />
inadequacies <strong>of</strong> our models, particularly the unrealistic<br />
simplifying assumptions they make. To examine<br />
their utility more critically, we must consider their<br />
ability to describe the effects <strong>of</strong> intraspecific competition<br />
on fecundity <strong>and</strong> survival. It should also be<br />
stressed, however, that a true test <strong>of</strong> a model's ability
CHAPTER 3: MODELS OF SINGLE-SPECIES <strong>POPULATION</strong>S 63<br />
Fig. 3.11 Observed population fluctuations. (a) Yeast cells.<br />
(After PearI, 1927.) (b) Tasmanian sheep. (After Davidson,<br />
1938.) (c) The stored-product beetle Callosobmchus<br />
macuiatus. (After Utida, 1967.) (d) The great tit Parus major<br />
in Holl<strong>and</strong>. (After Kluyver, 195 1 .) (e) The water flea<br />
Daphnia magna. (After Pratt, 1943 .)<br />
to describe population behaviour should not consist<br />
only <strong>of</strong> a comparison <strong>of</strong> numbers; it should also<br />
consider the underlying biological similarities: the<br />
respective R-values for instance, or the existence-in<br />
both model <strong>and</strong> fact-<strong>of</strong> a time-lag.<br />
In considering the ability <strong>of</strong> our models to describe<br />
the effects <strong>of</strong> intraspecific competition, we must confine<br />
ourselves to the discrete-generation equation. The<br />
logistic model, restricted as it is to perfect cornpensation,<br />
cannot be expected to describe a range <strong>of</strong><br />
situations; its utility lies in its simplicity <strong>and</strong> the ease<br />
with which it can be understood. The capabilities <strong>of</strong><br />
our difference equation can be critically assessed,<br />
because, for any set <strong>of</strong> data the most appropriate<br />
values for a <strong>and</strong> b-those giving the 'best fit' to the<br />
data-can be estimated using a statistical technique
64 PART 1: SINGLE-SPECIES <strong>POPULATION</strong>S<br />
Fig, 3.12 Data from competition experiments <strong>and</strong> their<br />
description based on equation 3.4. (a) Beetles:<br />
CaIlosobruchus chinensis (a) a = 0.00013, b = 0.9 (Fujii, 1968);<br />
C. maculatus ( X ) a = 0.0006, b = 2.2 (Utida, 1967); C.<br />
maculatus (0) a = 0.0001, b = 2.7 (Fujii, 1967). (After<br />
Hassell et al., 1976.) (b) Shepherd's purse, Capsella bursapastoris:<br />
a = 0.377, b = 1.085 (Palmblad, 1968). (c) the<br />
blowfly Lucilia cuprina (Nicholson, 1954b): the moth Plodia<br />
interpunctella (Snyman, 1949). (After Hassell, 1975.)<br />
(following Hassell, 1975 <strong>and</strong> Hassell et al., 1976). The<br />
curve produced by the model can then be compared<br />
with the original data points. This has been done for<br />
several examples (including two from Chapter 2), <strong>and</strong><br />
the results are shown as plots <strong>of</strong> k-values against log,,<br />
density in Fig. 3.12 (experimental data) <strong>and</strong> Fig. 3 .l3<br />
(field data). As originally noted by Hassell (1975), there<br />
is a tendency, particularly under laboratory conditions,<br />
for the model to be very satisfactory at high <strong>and</strong><br />
low densities, but incapable <strong>of</strong> describing the sudden<br />
transition from a shallow to a steep slope. This may<br />
be a result <strong>of</strong> the data reflecting two superimposed<br />
density-dependent processes (one weak <strong>and</strong> one<br />
strong), while the model treats them as a single process<br />
(Stubbs, 1977). Nevertheless, the model's performance<br />
overall is impressive: whether the plot is more or less<br />
straight or curved, its fit to the data is very satisfactory.<br />
A final example <strong>of</strong> the utility <strong>of</strong> the difference<br />
equation model is shown in Fig. 3.14. The data come<br />
from a pot experiment in which Agrostemma githago,<br />
corncockle, was sown over a wide range <strong>of</strong> densities.<br />
We can see that there were two components <strong>of</strong><br />
density-dependent regulation: plant momlity <strong>and</strong><br />
plasticity. Self-thinning was noticeable above sowing<br />
densities <strong>of</strong> 1000 seeds m-2 (Fig. 3.14a), whilst the<br />
number <strong>of</strong> seeds borne per flowering plant declined<br />
with density over the entire range (Fig. 3 .l4b).<br />
Fitting the models (equations 3.5 <strong>and</strong> 3.6) described<br />
above to these data by statistical means, we can see<br />
that they do indeed give a very close fit to the observed<br />
results. It appears (again) that our basic difference<br />
equation model is very satisfactory in describing<br />
reality. Since, however, we can interpret the constants<br />
in the models in biologic$ terms we can make further<br />
statements about the Agrostemma population. The<br />
data suggest that the maximum population size that<br />
can be supported (if the experiment is repeated again<br />
under identical conditions) is 10 869 seed-bearing<br />
plants m-2 ( = m-' = U(9.2 X lW5), <strong>and</strong> that the maximum<br />
seed yield <strong>of</strong> an isolated plant, h, is 3685 seeds.<br />
Also, to grow to maximum size, a plant required<br />
325 cm2 (a = 0.0325) <strong>of</strong> space. The value <strong>of</strong> b (1.15) in<br />
equation 3.6 was significantly greater than unity,<br />
indicating overcompensation at high density. This is<br />
evident when the components <strong>of</strong> seed yield are<br />
examined (Fig. 3.14~). The effects <strong>of</strong> density did not<br />
fall equally on all parts <strong>of</strong> the plant. Most density stress<br />
was absorbed by the number <strong>of</strong> capsules per plant<br />
which declined at a constant rate with density as did<br />
seed weight. The number <strong>of</strong> seeds per capsule,
CHAPTER 3: MODELS OF SINGLE-SPECIES <strong>POPULATION</strong>S 65<br />
Fig. 3.13 Field data on intraspecific competition <strong>and</strong> their<br />
description based on equation 3 <strong>and</strong> 4. (a) The limpet<br />
Patella cochlear: a = 4.13 X 10⁻⁵, b = 51.49 (Branch, 1975).<br />
(b) The Colorado beetle Leptinotarsa decemlineata:<br />
a = 3.97 X 10⁻⁶, b = 30.95 (Harcourt, 1971). (c) Larch tortrix<br />
Zeiraphera diniana: a = 1.8 X lO-', b = 0.11 (Auer, 1968).<br />
(After Hassell, 1975.)<br />
however, fell sharply at high density reflecting the<br />
overcompensatory density response. The difference<br />
equation model, despite its simplicity, does indeed<br />
appear to encapsulate the essential characteristics <strong>of</strong><br />
the behaviour <strong>of</strong> single-species populations.<br />
3.4.3 'Cobwebbing'-a more general approach<br />
Whilst the behaviour <strong>of</strong> populations described by<br />
models such as equation 3.4 can be examined mathematically,<br />
there will <strong>of</strong> course be situations where we<br />
cannot find appropriate functions relating N, + , to N,<br />
<strong>and</strong> even when we can, they may not be tractable<br />
analytically. In such cases, however, we can examine<br />
the behaviour <strong>of</strong> the population by geometric iteration,<br />
bearing in mind that this method will have its limitations<br />
(see below). In the simplest case for discrete<br />
generations, the approach involves plotting the size <strong>of</strong><br />
the population after a generation <strong>of</strong> growth against its<br />
former (or starting) size. In section 1.2 we introduced<br />
this idea <strong>of</strong> examining the dynamics <strong>of</strong> a population<br />
graphically by plotting its size over successive generations,<br />
each generation against the next (see Fig. 1.3).<br />
One <strong>of</strong> the earliest uses <strong>of</strong> this approach was in<br />
fisheries research in the 1950s in investigations <strong>of</strong><br />
sustainable fishing <strong>of</strong> natural stocks.<br />
If the procedure is carried out to encompass a<br />
number <strong>of</strong> generations, then we might envisage a<br />
curve <strong>of</strong> the form illustrated in Fig. 3.15. The curve<br />
has been termed a recruitment or reproduction curve.<br />
To investigate the behaviour <strong>of</strong> the population we<br />
examine the changes in population size by comparing<br />
the reproduction curve with a one to one reference<br />
line (N, + , = N,), plotting the data on log scales. Any<br />
population lying on this reference line will be at<br />
equilibrium.<br />
Four theoretical recruitment curves are illustrated<br />
in Fig. 3.15 <strong>and</strong> we can predict the size <strong>of</strong> the population<br />
over succeeding generations by iteration using<br />
a method known as cobwebbing the reproduction<br />
curve (Hoppensteadt, 1982). In the first (Fig. 3 .l 5a) the<br />
recruitment curve parallels the reference line <strong>and</strong> for<br />
a chosen starting size (N,) we may evaluate N, + , on<br />
the reproduction curve <strong>and</strong> reflect this value back to<br />
the horizontal axis through the one to one line. Inspection<br />
<strong>of</strong> Fig. 3.15a shows that the population exhibits<br />
exponential growth increasing in size by a factor <strong>of</strong><br />
10 each generation.<br />
When growth-rate is density-dependent, reproduction<br />
curves will not parallel the reference line but will<br />
intersect it at a locus which by definition is an<br />
equilibrium population size N,. Of particular interest,<br />
however, is the slope <strong>of</strong> the reproduction curve at the
66 PART 1 : SINGLE-SPECIES <strong>POPULATION</strong>S<br />
Fig. 3.14 Density-dependent regulation in Agrostemma<br />
githago: (a) survival to reproduction; (b) seed production;<br />
(c) yield components. (From Watkinson, 1981 .)<br />
approach to the point <strong>of</strong> intersection. Where this slope<br />
is in the range <strong>of</strong> zero to + 1 (indicating either<br />
undercompensating density-dependence (slope > 0) or<br />
exactly compensating density-dependence (slope = 0))<br />
we can see that population shows a monotonic approach<br />
to the equilibrium point. Where the population<br />
approaches the equilibrium point from below, the<br />
incremental gain diminishes with each generation,<br />
<strong>and</strong> when it approaches from above, the incremental<br />
decline diminishes with each generation (Fig. 3.15 b).<br />
Population perturbations away from this density in<br />
either direction will result in a smooth return to it.<br />
Reproduction curves, however, may exhibit a<br />
'hump' such that population growth rate is maximal<br />
at some intermediate density between N, <strong>and</strong> very low<br />
densities. This is indicative <strong>of</strong> overcompensating<br />
density-dependence. Two theoretical examples are<br />
shown in Fig. 3 .l 5c <strong>and</strong> 3 .l 5d, <strong>and</strong> by cobwebbing we<br />
can illustrate two further forms <strong>of</strong> behaviour. Where<br />
the slope <strong>of</strong> the reproduction curve is negative but less<br />
than - 1 in the region <strong>of</strong> N, (mildly overcompensating),<br />
damped oscillations towards a stable equilibrium<br />
population size will occur (Fig. 3.154. If, however, the<br />
slope is greater than - 1 (more strongly overcompen-<br />
sating), then as Fig. 3.15d indicates population sizes<br />
may fluctuate around N, <strong>and</strong> in a chaotic manner-a<br />
pattern we have already observed in the circumstances<br />
for the specific case <strong>of</strong> equation 3.4, <strong>and</strong> to<br />
which we will return in section 6.12.<br />
Figure 3.16 provides selected reproduction curves<br />
that have been observed in natural or laboratory<br />
populations <strong>and</strong> we will return to use them in<br />
explaining mechanisms <strong>of</strong> population regulation, particularly<br />
in plants. Before we leave this topic, we must<br />
voice a cautionary word <strong>of</strong> warning. Whilst intuitive<br />
<strong>and</strong> simple, graphical analysis by cobwebbing is limited<br />
since it will not necessarily expose the full range <strong>of</strong><br />
dynamical behaviour that a population may exhibit<br />
(see Yodzis, 1989). For example, in particular circumstances,<br />
the outcome will depend on the population<br />
size chosen to start the exploration.<br />
3.5 Incorporation <strong>of</strong> age-specif ic<br />
fecundity <strong>and</strong> mortality<br />
We have seen from the life-table data for annual<br />
meadow grass <strong>and</strong> red deer (Chapter 2) that mortality<br />
<strong>and</strong> fecundity are <strong>of</strong>ten age-specific. The models we<br />
have developed so far, however, do not include these<br />
important features, <strong>and</strong> to this extent they are deficient.<br />
It may seem a formidable task to attempt to<br />
model a population <strong>of</strong> overlapping generations in
CHAPTER 3: MODELS OF SINGLE-SPECIES <strong>POPULATION</strong>S 67<br />
Fig. 3.15 Theoretical recruitment (or reproduction) curves.<br />
In each case (a-d) the size <strong>of</strong> the population after a<br />
generation <strong>of</strong> growth is plotted against initial size. Dotted<br />
lines illustrate the process <strong>of</strong> cobwebbing. (a) Exponential<br />
growth; (b) monotonic approach to equilbrium N,;<br />
(c) damped oscillations towards equilibrium; (d) chaotic<br />
behaviour (see text for details).<br />
these terms, but by the application <strong>of</strong> appropriate<br />
mathematical techniques it can be achieved fairly<br />
easily,<br />
The best starting point is the diagrammatic life table<br />
for overlapping generations (see Fig. 1 .g), exp<strong>and</strong>ed<br />
into a more complete form (Fig. 3.17). Here we sup-
68 PART l: SINGLE-SPECIES <strong>POPULATION</strong>S<br />
Fig. 3.17 The diagrammatic life table for a population with<br />
overlapping generations: a, numbers in diierent age<br />
groups; B, age-specific fecundities; p, age-specific<br />
survivorships.<br />
pose that a population can be conveniently divided<br />
into four age groups: a,, a,, a, <strong>and</strong> a,; a, representing<br />
the youngest adults <strong>and</strong> a, the oldest. In a single time<br />
step, t, to t,, individuals from group a,, a, <strong>and</strong> a,, pass<br />
to the next respective age group; each age group<br />
contributes new individuals to a, (through birth); <strong>and</strong><br />
the individuals in a, die. This clearly rests on the<br />
assumption that the population consists <strong>of</strong> discrete age<br />
groupings <strong>and</strong> has discrete survivorship <strong>and</strong> birth<br />
statistics, in contrast to the reality <strong>of</strong> a continuously<br />
ageing population.<br />
We can write a series <strong>of</strong> algebraic equations to<br />
express the changes that are occurring in Fig. 3.17.<br />
These are:<br />
Fig. 3.16 Representative reproduction curves for (a) Vulpia<br />
fasiculata (Watkinson & Harper, 1978); (b) Senecio vulgaris<br />
(Watson, 1987); (c) Caflosobruchus maculatus (Utida, 1967)-<br />
population fluctuations <strong>of</strong> these data are shown in<br />
Fig. 3.11~.
CHAPTER 3: MODELS OF SINGLE-SPECIES <strong>POPULATION</strong>S 69<br />
where the numbers in the age group are subscripted t,<br />
or t, to identify the time period to which they refer.<br />
There are four equations because there are four age<br />
groups, <strong>and</strong> they specifically state how the numbers in<br />
age groups are determined over the time-step t, to t,.<br />
Suppose that our population at t, consists <strong>of</strong> 2000<br />
individuals distributed among the age groups as<br />
follows:<br />
Suppose, further, that the age-specific birth- <strong>and</strong><br />
survival-rates are as foIlows:<br />
Then, for instance, no <strong>of</strong>fspring are born to adults<br />
aged a,, whilst adults in age group a, are the most<br />
fecund. Also, only 10%~ <strong>of</strong> the individuals aged a,<br />
survive the next time-step <strong>and</strong> become incorporated<br />
into a,, whereas none <strong>of</strong> the individuals in a, survive<br />
(p = 0).The numbers at time t, will be:<br />
3.5.1 The matrix model<br />
The equations 3.10-3.13 are called 'linear recurrence<br />
equations', but it is clear that in this form our model is<br />
rather cumbersome, consisting as it does <strong>of</strong> as many<br />
equations as there are age groups. One way <strong>of</strong><br />
expressing our model in a much more compact form is<br />
by the use <strong>of</strong> matrix algebra. In essence, matrix<br />
algebra is a tool designed to manipulate <strong>and</strong> store<br />
large sets <strong>of</strong> data. We will certainly not need to cover<br />
all aspects <strong>of</strong> matrix algebra to underst<strong>and</strong> how our<br />
model is constructed in matrix terms, but it is vital<br />
that the basic concepts are clearly understood.<br />
A matrix is simply a group, or table, or array <strong>of</strong><br />
numbers. For instance, the numbers for B <strong>and</strong> p<br />
envisaged above could be set out as the matrix:<br />
:;a]<br />
10 0.0<br />
<strong>and</strong> we signify that it is a matrix by surrounding the<br />
numbers by square brackets. Conventionally, matrices<br />
are symbolized by a letter in bold face, say X.<br />
The number <strong>of</strong> rows <strong>and</strong> columns that comprise a<br />
matrix may vary, <strong>and</strong> we may have matrices consisting<br />
<strong>of</strong> only a single column. We can, in fact, write the<br />
initial age structure <strong>of</strong> our previous population in this<br />
way:<br />
During this time-step our population has increased by<br />
765 individuals <strong>and</strong> our age distribution has changed:<br />
from a, = 1750 to 2500<br />
a, = 100 175<br />
a,= 100 60<br />
a,= 50 30<br />
It is important to realize that equations state that<br />
individuals reproduce before they die. Taking age group<br />
a,, for instance, the figure 100 was used in<br />
equation 3.10 to compute the number <strong>of</strong> births<br />
(100 X 15 = l5OO), but then used in equation 3 .l 3 to<br />
compute the number <strong>of</strong> a, survivors into age group a,<br />
(100 X 0.3 = 30).<br />
<strong>and</strong> symbolize it as tlA. Our age distribution at t,, tZA,<br />
can obviously then be mitten as<br />
The two matrices ,lA <strong>and</strong> are technically called<br />
column vectors, indicating that our matrices are in fact<br />
just one column <strong>of</strong> figures.<br />
We have seen how our population changes from ,lA
70 PART 1: SINGLE-SPECIES <strong>POPULATION</strong>S<br />
to through the medium <strong>of</strong> the recurrence equations.<br />
Now, to complete our matrix model, we have to<br />
construct a suitable matrix to enable tlA to become t2A<br />
by mutiplication. The construction <strong>of</strong> this matrix is<br />
determined by the rules <strong>of</strong> matrix multiplication, as<br />
we shall learn below, <strong>and</strong> in consequence it appears<br />
as:<br />
groups, it is:<br />
which may, alternatively, be vvritten:<br />
Note that matrix T is square, <strong>and</strong> that we have entered<br />
into it all our age-specific survival <strong>and</strong> birth statistics<br />
in particular positions, writing all the other numbers<br />
(or matrix elements as they are called) as zero.<br />
The multiplication <strong>of</strong> our initial, age-distributed<br />
population occurs according to the rules <strong>of</strong> matrix<br />
algebra, as follows. Take, in turn, each row <strong>of</strong> elements<br />
in T. Each individual element in the row is multiplied<br />
with the corresponding element in the first with<br />
the first, the second with the second, <strong>and</strong> so on. These<br />
pairwise multiplications are then summed, <strong>and</strong> the<br />
sum entered as the appropriate element in a new<br />
column vector. Thus, the first row <strong>of</strong> the square<br />
matrix leads to the first element <strong>of</strong> the new column<br />
vector. the second leads to the second, <strong>and</strong> so on. This<br />
may be illustrated as:<br />
5 15 10-<br />
0 0<br />
0<br />
0 0.3 0<br />
T X ,lA = t2A.<br />
T is called the transition matrix, which, when postmultiplied<br />
by the vector <strong>of</strong> ages at t,, gives the age<br />
distribution at t,. (In matrix algebra, in contrast to<br />
conventional algebra, T X A is diierent from A X T (cf.<br />
X X b = b X X), <strong>and</strong> we distinguish between the two by<br />
referring to post- <strong>and</strong> pre-multiplication.)<br />
By now it must be clear that our matrix model<br />
allows us to condense the complexities <strong>of</strong> age-specific<br />
schedules into a simply written but explicit form. It<br />
might also seem that to use the model requires<br />
endlessly repeated multiplications <strong>and</strong> additions. This<br />
disadvantage has been removed, however, by the<br />
widespread use <strong>of</strong> computers, which are ideally suited<br />
(not to say designed) to perform such iterative procedures<br />
at speed. Our model is, therefore, <strong>of</strong> great value.<br />
The specific rules arid procedures <strong>of</strong> matrix algebra<br />
are numerous. We have only dealt here with those<br />
which are necessary in this particular context. If<br />
further explanations are needed, reference may be<br />
made to one <strong>of</strong> the several books on matrix algebra for<br />
biologists (e.g. Searle, 1966).<br />
We can observe now that the positions <strong>of</strong> the zeros in<br />
the matrix T are critical, because they reduce terns in<br />
each row <strong>of</strong> the multiplication to zero, giving rise in t2A<br />
to the age structure that we have already seen.<br />
This matrix model was first introduced to population<br />
biology by P.H. Leslie in 1945 <strong>and</strong> is <strong>of</strong>ten known<br />
as the Leslie matrix model. In general form, for n age<br />
3.5.2 Using the model<br />
If we now wish to compute the changing size <strong>of</strong> our<br />
population, on the assumption that the birth <strong>and</strong><br />
mortality statistics are constant from one time to the<br />
next, we can write:<br />
T X tlA = t2A; T X t2A = t3A; T X t3A = tqA'<br />
<strong>and</strong> so on. This is a process <strong>of</strong> iterative premultiplication<br />
<strong>of</strong> the successive age groups by the
CHAPTER 3: MODELS OF SINGLE-SPECIES <strong>POPULATION</strong>S 71<br />
transition matrix, giving:<br />
<strong>and</strong><br />
T X<br />
Over these three time-steps the age distribution is<br />
changing <strong>and</strong> the population is increasing in size; the<br />
numbers <strong>of</strong> individuals in all age-groups are oscillating.<br />
If we were to continue the iteration, however,<br />
these oscillations would disappear (Fig. 3.1 8), <strong>and</strong><br />
after 17 <strong>and</strong> 18 multiplications the vectors would be<br />
respectively. Note that the population has grown<br />
enormously, but that the ratios <strong>of</strong> ,JI, : t,,a, are all<br />
equal (to two significant figures at least), i.e.<br />
This means that we have reached a situation in which<br />
the age distribution is proportionally constant or stable<br />
as the population increases. In other words, a, : a, :<br />
a, : a,, is the same in all subsequent generations. In<br />
fact, this particular stable age distribution is an<br />
attribute <strong>of</strong> the transition matrix, <strong>and</strong> would have<br />
been reached irrespective <strong>of</strong> the initial column vector;<br />
<strong>and</strong> in general, populations, when subjected to repeated<br />
pre-multiplication by the same transition matrix,<br />
achieve the stable age distribution characteristic<br />
<strong>of</strong> that matrix.<br />
Moreover, as Fig. 3.18 shows, the ratios from one<br />
generation to the next (1.18 in this case) are also<br />
constant: the population (as well as each <strong>of</strong> the ageclasses<br />
within it) is increasing at a constant rate. This<br />
rate is also a reflection <strong>of</strong> the transition matrix, <strong>and</strong> is,<br />
Fig. 3.18 The behaviour <strong>of</strong> a matrix population model:<br />
oscillations in an age-distributed population as a stable age<br />
distribution is approached. See text for details.<br />
in fact, the net reproductive-rate or finite rate <strong>of</strong><br />
increase per unit <strong>of</strong> time, R. Repeated premultiplication<br />
is, therefore, the mathematically simplest<br />
means <strong>of</strong> determining R from an age-specific<br />
schedule <strong>of</strong> births <strong>and</strong> deaths.<br />
We should not, however, simply dismiss the matrix<br />
model as a device for only h<strong>and</strong>ling sets <strong>of</strong> recurrence<br />
equations in an iterative manner. A transition matrix,<br />
stating age-specific data as it does, is a precise<br />
description <strong>of</strong> the population statistics <strong>and</strong> can be<br />
subjected to algebraic analysis. First, we can find R,<br />
by calculating 'the dominant latent root' <strong>of</strong> the
72 PART l : SINGLE-SPECIES <strong>POPULATION</strong>S<br />
transition matrix; <strong>and</strong> second, we can conduct sensitivity<br />
analyses to investigate the relative importance <strong>of</strong><br />
the different transitions in determining population<br />
growth-rate. Both techniques require a knowledge <strong>of</strong><br />
matrix algebra which is beyond the scope <strong>of</strong> this book<br />
(but which are clearly discussed in Caswell, 1989). A<br />
further usage <strong>of</strong> transition matrices comes in harvesting<br />
theory (Chapter S), which allows us to predict the<br />
level <strong>of</strong> 'cropping' that can occur without driving a<br />
population to extinction. All that need be appreciated<br />
at this stage is that matrix modelling can lead to<br />
sophisticated analyses <strong>of</strong> populations <strong>and</strong> their behaviour.<br />
Our computations <strong>of</strong> R <strong>and</strong> the stable age distribution<br />
rest on the assumption that the elements <strong>of</strong> the<br />
transition matrix are constant over time <strong>and</strong> independent<br />
<strong>of</strong> population density. In these respects our matrix<br />
model, in its present form, is very much divorced from<br />
the biological reality <strong>of</strong> natural populations. We can<br />
incorporate temporal changes in fecundity <strong>and</strong> survival<br />
in a very straightforward manner, by simply<br />
changing our transition matrix with every time-step.<br />
Thus, whereas we have assumed that:<br />
so that<br />
we can assume instead that, in general terms, for r<br />
time periods:<br />
Furthermore, we can incorporate the idea that the<br />
birth <strong>and</strong> death statistics are density-dependent by<br />
varying the fecundity <strong>and</strong> survival elements in the<br />
transition matrix in relation to population size. To<br />
achieve this, we need simply derive the relevant<br />
elements <strong>of</strong> the successive transition matrices from<br />
equations which relate fecundity <strong>and</strong> survivorship to<br />
the population size, which is itself the sum <strong>of</strong> the<br />
elements <strong>of</strong> the most recent age vector.<br />
3.5.3 A working example: Poa annua<br />
Both <strong>of</strong> these additions to the model are well illustrated<br />
in practice by the work <strong>of</strong> Law (1975) on the<br />
annual meadow grass Poa annua: a particularly successful<br />
colonizer <strong>of</strong> open habitats, which responds<br />
strongly to intraspecific competition. In modelling<br />
populations <strong>of</strong> this species, Law envisaged that the life<br />
cycle included four ages <strong>of</strong> plants besides s'eeds<br />
(Fig. 3.19), <strong>and</strong> that the span <strong>of</strong> each age group was<br />
approximately 8 weeks. The transition matrix appropriate<br />
to this life cycle is given in Table 3.1 <strong>and</strong>,<br />
although most <strong>of</strong> the elements are familiar to us, the<br />
incorporation <strong>of</strong> a seed bank into the model requires<br />
Fig. 3.19 The life cycle for annual meadow grass Poa surviving to become old adults. Fecundities (0 or >O): B,,<br />
annua. (After Law, 1975.) Proportions (ranging from 0 to 1): B, <strong>and</strong> B,, seed produced by young, medium <strong>and</strong> old<br />
p, , seeds surviving; g,, seeds germinating; p,, seedlings adults, respectively. All events occur over the time period t<br />
surviving to become young adults; p,, young adults to t + 1.<br />
surviving to become medium adults; p,, medium adults
CHAPTER 3: MODELS OF SINGLE-SPECIES <strong>POPULATION</strong>S 73<br />
Table 3.1 A matrix model <strong>of</strong> the life cycle outlined in<br />
Table 3.2 A transition matrix, P, for a Poa annua<br />
Fig. 3.19. population. (After Law, 1975).<br />
that the first element <strong>of</strong> the matrix (p,) is not a<br />
fecundity but the probability <strong>of</strong> a seed surviving in the<br />
bank if it does not germinate.<br />
Law was able to develop curves <strong>of</strong> both seedling<br />
survivorship to young adults, <strong>and</strong> age-specific seed<br />
output per plant in relation to overall population<br />
density. These are shown in Fig. 3.20 together with<br />
the equations that describe these relationships. The<br />
transition matrix which incorporates these densitydependent<br />
functions <strong>of</strong> survival <strong>and</strong> reproduction<br />
takes the form shown in Table 3.2. Between successive<br />
time intervals, 0.2 <strong>of</strong> the seeds in the banks<br />
remain dormant <strong>and</strong> survive, while 0.05 <strong>of</strong> them<br />
germinate. The proportion <strong>of</strong> individuals that survive<br />
from the seedling age-class, po(N), is initially 0.75 at<br />
very low population density, but declines according to<br />
the function shown in Fig. 3.20. The proportion <strong>of</strong><br />
individuals that survive from the young adult age-class<br />
onward, however, is fixed at 0.75. This represents the<br />
specific assertion that the survivorships <strong>of</strong> individuals<br />
in these age-classes are not subject to densitydependence.<br />
The maximum seed production <strong>of</strong> young<br />
<strong>and</strong> old adults at very low population density is 100<br />
seeds per plant, but, with increasing density, this<br />
decreases in a negative exponential fashion. Similarly,<br />
the maximum seed production <strong>of</strong> medium adults is<br />
200 seeds per plant, which also decreases with<br />
density. This reflects P. annua's schedule <strong>of</strong> fecundity<br />
in which seed output peaks in the medium adult ageclass<br />
(see Fig. 1.13).<br />
The matrix model,<br />
P X , p = ,r+lA<br />
can now be used to simulate the behaviour <strong>of</strong> the<br />
population, which is depicted in Fig. 3.21. We can see<br />
that each group <strong>of</strong> individuals undergoes oscillations<br />
in numbers, but when 18 time periods have elapsed<br />
the size <strong>of</strong> each has stabilized <strong>and</strong> population increase<br />
Fig. 3.20 (a) The proportion <strong>of</strong> seedlings <strong>of</strong> Poa annua production per plant for young (B,) medium (B,) <strong>and</strong> old<br />
surviving to become young adults as a function <strong>of</strong><br />
(B,) adults <strong>of</strong> Poa annua as a function <strong>of</strong> population density:<br />
population density: p,(N) = 0.75-0.25 exp (0.00005 N) if B,(N) = B,(N) = 100 exp (- 0.0001 N); B,(N) = 200 exp<br />
Nc27726; p,(N) = 0 if N>27726. (b) Age-specific seed (- 0.0001 N). (From Law, 1975.)
74 PART l : SINGLE-SPECIES <strong>POPULATION</strong>S<br />
Fig. 3.21 Application <strong>of</strong> matrix<br />
model: simulation <strong>of</strong> the densityregulated<br />
changes in density <strong>of</strong> five<br />
age-classes in a population <strong>of</strong> Poa<br />
annua. (From Law, 1975.)<br />
has been halted by intraspecific competition. (Note can derive a figure for R as previously described.<br />
that the age-structure stabilization after 18 time Moreover, by considering a variety <strong>of</strong> transition matriperiods<br />
both here <strong>and</strong> in section 3.5.2 is purely ces, based on a range <strong>of</strong> densities, we can examine the<br />
coincidental .)<br />
density-dependent effects on the actual reproductive-<br />
Seed germination <strong>and</strong> seed production in P. annua rate. This is illustrated in Fig. 3.22.<br />
vary considerably with the time <strong>of</strong> year, <strong>and</strong> to model<br />
this realistically it would be necessary to introduce a<br />
different transition matrix for each month <strong>of</strong> the year.<br />
The number <strong>of</strong> seeds per individual plant in each age<br />
class would then be a function <strong>of</strong> population density<br />
<strong>and</strong> time during the season. Although we do not need<br />
to examine the workings <strong>of</strong> this sophistication, we<br />
should realize that the facility <strong>of</strong> changing elements in<br />
successive transition matrices is essential for biological<br />
reality.<br />
Finally, it is interesting to note that the net<br />
reproductive-rate, R, can still be estimated, even from<br />
this more sophisticated form <strong>of</strong> the model. R is, by<br />
definition, the rate <strong>of</strong> increase in the absence <strong>of</strong><br />
competition. If we, therefore, consider the transition Fig, 3-22 Net reproductive-rate <strong>of</strong> Pea annua growing at a<br />
matrix P with its elements unaffected by density, we range <strong>of</strong> population densities. (Data from Law, 1975.)
Part 2
This page intentionally left blank
Chapter 4<br />
4.1 The nature <strong>of</strong> interspecif ic<br />
interactions<br />
In Chapters 2 <strong>and</strong> 3 we examined the consequences <strong>of</strong><br />
individuals <strong>of</strong> the same species competing with one<br />
another. Natural communities, however, are usually<br />
assemblages <strong>of</strong> species, <strong>and</strong> in many habitats the<br />
'neighbours' <strong>of</strong> any one individual may well be <strong>of</strong> a<br />
different species to the individual itself. Yet, although<br />
the process <strong>of</strong> interaction between species might occur<br />
in a variety <strong>of</strong> ways (fighting in animals, shading in<br />
plants, etc.), there are only three basic efects. One<br />
species may cause (or be the cause <strong>of</strong>) increases in the<br />
survival, growth or fecundity <strong>of</strong> another species, or it<br />
may cause decreases, or may have no effect at all.<br />
Placing these effects in symbolic form in Table 4.1, we<br />
can see that there are six possible outcomes, in five <strong>of</strong><br />
which at least one species is affected.<br />
The most obvious example <strong>of</strong> the ' + -' type <strong>of</strong><br />
interaction is a predator-prey relationship in which<br />
one species is eaten by the other; but there are other<br />
situations in which one species provides a food source<br />
or growth requirement for a second species at the first<br />
species' expense. Herbivores 'prey' on vegetation but<br />
<strong>of</strong>ten do not kill entire plants by grazing; <strong>and</strong> parasites,<br />
while reducing the vitality or fecundity <strong>of</strong> their<br />
Table 4.1 The effects <strong>of</strong> species 1 on survival, growth or<br />
fecundity in species 2. The effects <strong>of</strong> species 2 on survival,<br />
growth or fecundity in species 1.<br />
host, do not usually cause its immediate death. All<br />
aspects <strong>of</strong> the ' + - ' interaction will be considered in<br />
detail in Chapter 5.<br />
We can only make passing reference to the ' + O',<br />
' - 0' <strong>and</strong> ' + + ' interactions. This is not to belie their<br />
biological significance, but more to indicate the lack <strong>of</strong><br />
consideration they have received in terms <strong>of</strong> population<br />
analysis. Commensalism (+ 0) is the state in<br />
which prerequisite conditions for the existence <strong>of</strong> one<br />
species are maintained or provided by a second, but in<br />
which there is no associated adverse effect for the<br />
second species. Saprophytism between fungi <strong>and</strong><br />
higher plants might enter this category, as would<br />
'parasites' that have no measurable effect on their<br />
host. The reverse <strong>of</strong> commensalism is amensalism<br />
(- 0), an <strong>of</strong>ten-cited example <strong>of</strong> which is allelopathy<br />
between plants: toxic metabolite production by one<br />
species causing growth reduction in another. Allelopathy<br />
is difficult to investigate in controlled laboratory<br />
experiments, <strong>and</strong> its role in the field is uncertain (see<br />
Harper, 1977).<br />
Mutualism ( + + ) completes this group <strong>of</strong> three<br />
'minor' categories, <strong>and</strong> although it represents a<br />
uniquely fascinating topic in evolutionary terms, it has<br />
received relatively little attention from population<br />
ecologists. Nevertheless, a single example (Janzen,<br />
1966) will illustrate the essential continuity between<br />
mutualism <strong>and</strong> other interactions. The bullhorn acacia<br />
<strong>of</strong> Central America (Acacia cornigera) gets its name<br />
from the pairs <strong>of</strong> large, swollen, hollow spines it bears<br />
on its trunk. The spines have a patch <strong>of</strong> thin tissue on<br />
one side, <strong>and</strong> small, aggressive, stinging ants (Pseudomymex<br />
fermginea) perforate this tissue <strong>and</strong> nest inside<br />
the spine. The ants also feed on nectar produced at the<br />
base <strong>of</strong> the bullhorn acacia leaves, <strong>and</strong> on protein-rich<br />
(Beltian) bodies, produced at the leaf-tips, <strong>and</strong> they<br />
are, therefore, able to complete their whole life cycle<br />
on A. cornigera. In addition, however, the ants attack<br />
any insects that attempt to eat the acacia leaves, <strong>and</strong>
78 PART 2: INTERSPECIFIC INTERACTIONS<br />
Table 4.2 Effects <strong>of</strong> the ant Pseudomyrmex fermginea on the<br />
bullhorn acacia Acacia comigera. (After Janzen, 1966.)<br />
they cut the shoots <strong>of</strong> any other plants which come<br />
into contact with the acacia <strong>and</strong> may shade it. As<br />
Table 4.2 shows, therefore, the ants, apart from obtaining<br />
food <strong>and</strong> a protected place to live from the<br />
acacia, also cause measurable improvements in the<br />
fecundity <strong>and</strong> the survivorship <strong>of</strong> the acacia itself by<br />
protecting it from predators <strong>and</strong> competitors. Fecundity<br />
<strong>and</strong> survivorship are clearly the common currency<br />
linking mutualism with every other ecological<br />
interaction.<br />
4.2 lnterspecif ic competition<br />
The final interaction in Table 4.1 is interspecific competition,<br />
<strong>and</strong> the ' - - ' symbolism stresses its essential<br />
aspect: that the two species cause demonstrable reductions<br />
in each other's survival, growth or fecundity.<br />
Nevertheless, having stressed this, it must also be<br />
emphasized that whenever two species compete there<br />
will be some circumstances in which one species will<br />
be very much more affected than the other. In such<br />
'one-sided' cases <strong>of</strong> competition it may even be<br />
impossible to discern any measurable detrimental<br />
effects on the stronger competitor. These cases will<br />
appear to be amensal. (The relationship between<br />
amensalism <strong>and</strong> interspecific competition is a subtle<br />
one which we shall consider in more detail in section<br />
4.11.)<br />
As with intraspecific competition, we can expect<br />
that the detrimental effect <strong>of</strong> interspecific competition<br />
will act through some combination <strong>of</strong> fecundity <strong>and</strong><br />
survivorship; that the interaction will be essentially<br />
reciprocal; that competition will be for a resource<br />
which is in limited supply; <strong>and</strong> that the effects will be<br />
density-dependent.<br />
We can, however, expect important differences<br />
between the precise nature <strong>of</strong> interspecific competition<br />
in animals <strong>and</strong> plants. All animals obtain their<br />
food from the growth, reproduction <strong>and</strong> by-products<br />
<strong>of</strong> other living organisms, <strong>and</strong> they commonly compete<br />
for this food. Conversely, the factors required for<br />
plant growth, <strong>and</strong> for which they compete, are neither<br />
self-sustaining nor the products <strong>of</strong> reproductive processes.<br />
Moreover, because plants are sessile organisms,<br />
they will, once rooted <strong>and</strong> fixed in position,<br />
interfere mainly with their neighbours' growth <strong>and</strong><br />
reproduction (also true <strong>of</strong> sessile animals, <strong>of</strong> course).<br />
Conversely, amongst most animals there is rarely a<br />
continuous struggle between two, or even a few,<br />
individuals. Moreover, whereas two plants in close<br />
proximity to one another may immediately suggest the<br />
possibility <strong>of</strong> competition for a limited resource (perhaps<br />
soil nitrogen, or light in a canopy <strong>of</strong> leaves),<br />
many animal species may never even encounter their<br />
competitors (because <strong>of</strong> differences in foraging strategy,<br />
feeding times <strong>and</strong> so on). In assessing the nature<br />
<strong>of</strong> competitive interactions, therefore, particularly<br />
amongst animals, very detailed observation <strong>and</strong> exacting<br />
experimentation are required. Nevertheless, despite<br />
these difficulties <strong>and</strong> differences, there is, as we<br />
shall see, a coherent view <strong>of</strong> interspecific competition<br />
which applies to both animals <strong>and</strong> plants.<br />
4.3 A field example: granivorous ants<br />
Desert environments are <strong>of</strong> interest to physiologists<br />
because <strong>of</strong> the opportunities they present for studying<br />
animals <strong>and</strong> plants adapted to the extremes <strong>of</strong> water<br />
shortage; but because they are rather simple environments,<br />
there are also many instances in which ecological<br />
studies in deserts have been very instructive. One<br />
example is the work <strong>of</strong> Davidson (1977a, b, 1978) <strong>and</strong><br />
Brown <strong>and</strong> Davidson (1977) on interspecific competition<br />
in the seed-eating ants <strong>and</strong> rodents living in the<br />
deserts <strong>of</strong> the south-western USA. In examining this
CHAPTER 4: INTERSPECIFIC COMPETITION 79<br />
example, we shall take the approach which we try to<br />
follow throughout this chapter. First, we shall discover<br />
whether or not interspecific competition occurs, then<br />
we shall examine the form it takes <strong>and</strong> its consequences.<br />
Seeds play a major role in desert ecology, since they<br />
constitute a dormant, resistant stage in the life histories<br />
<strong>of</strong> plants, allowing them to survive the long,<br />
unfavourable intervals between short periods <strong>of</strong><br />
growth. But these seeds are also a food source for<br />
several, distantly related taxa (including ants <strong>and</strong><br />
rodents), which feed as specialized granivores. It is<br />
well established that in arid regions mean annual<br />
precipitation is a good measure <strong>of</strong> productivity; <strong>and</strong><br />
this productivity will determine the size <strong>of</strong> the seed<br />
resource available to these granivorous animals. Thus,<br />
the graphs in Fig. 4.1 (Brown & Davidson, 1977) <strong>of</strong><br />
numbers <strong>of</strong> common ant <strong>and</strong> rodent species against<br />
mean annual precipitation, indicate that species<br />
number is correlated with the size <strong>of</strong> the seed resource.<br />
This suggests that for both granivorous guilds<br />
- ants <strong>and</strong> rodents - the size <strong>of</strong> the food resource<br />
limits the number <strong>of</strong> common species, <strong>and</strong> probably<br />
also the total number <strong>of</strong> individuals (a 'guild' is defined<br />
as a group <strong>of</strong> species exploiting the same resource in a<br />
similar fashion; Root, 1967). Moreover, by actually<br />
taking seeds from foraging ants <strong>and</strong> rodents, Brown<br />
<strong>and</strong> Davidson were also able to show that the two<br />
guilds overlapped considerably in the sizes <strong>of</strong> seeds<br />
they ate (Fig. 4.2) suggesting not only that the ants<br />
<strong>and</strong> rodents are limited by their food, but also that the<br />
two guilds compete with one another for this limiting<br />
resource.<br />
These are only suggestions, however: plausible<br />
deductions from field correlations. Realizing this,<br />
Brown <strong>and</strong> Davidson performed an experiment in<br />
which four types <strong>of</strong> 36-m diameter plots were established<br />
in relatively level, homogeneous desert scrub.<br />
In two plots, rodents were excluded by trapping<br />
residents <strong>and</strong> fencing to preclude immigration; in<br />
another two plots, ants were removed by repeated<br />
insecticide applications; in two further plots, both<br />
rodents <strong>and</strong> ants were removed <strong>and</strong> excluded; <strong>and</strong>,<br />
finally, two plots were reserved as unmanipulated<br />
controls. The results are shown in Table 4.3, <strong>and</strong><br />
constitute positive evidence that the two guilds compete<br />
interspecifically with one another. When either<br />
rodents or ants were removed, there was a statistically<br />
Fig. 4.1 Patterns <strong>of</strong> species diversity <strong>of</strong> seed-eating rodents<br />
(A) <strong>and</strong> ants (0) inhabiting s<strong>and</strong>y soils in a geographic Fig. 4.2 The foods <strong>of</strong> ants <strong>and</strong> rodents overlap: sizes <strong>of</strong><br />
gradients <strong>of</strong> precipitation <strong>and</strong> productivity. (After Brown & native seeds harvested by coexisting ants <strong>and</strong> rodents near<br />
Davidson, 1977.) Portal, Arizona. (After Brown & Davidson, 1977 .)
80 PART 2: INTERSPECIFIC INTERACTIONS<br />
Table 4.3 Competition affects competitors <strong>and</strong> the resource<br />
competed for. Responses <strong>of</strong> ants, rodents <strong>and</strong> seed density<br />
to ant <strong>and</strong> rodent removal. (After Brown & Davidson,<br />
1977.)<br />
significant increase in the numbers <strong>of</strong> the other guild;<br />
the reciprocally depressive effect <strong>of</strong> interspecific competition<br />
was clearly shown. Moreover, when rodents<br />
were removed, the ants ate as many seeds as the<br />
rodents <strong>and</strong> ants had previously eaten between them,<br />
as did the rodents when the ants were removed; only<br />
when both were removed did the amount <strong>of</strong> resource<br />
increase. In other words, under normal circumstances<br />
both guilds eat less <strong>and</strong> achieve lower levels <strong>of</strong> abundance<br />
than they would do if the other guild was absent.<br />
This clearly indicates that the rodents <strong>and</strong> ants, although<br />
they coexist in the same habitat, compete interspecifically<br />
with one another. It also suggests strongly<br />
that the resource for which they compete is seed.<br />
Davidson (1977a, b) went on from this to examine<br />
the various species <strong>of</strong> ants more closely. She was<br />
particularly interested in two facets <strong>of</strong> the ants'<br />
feeding ecology. The first <strong>of</strong> these was the relationship<br />
between a species' worker body length <strong>and</strong> the size <strong>of</strong><br />
the seeds which the species harvested. Some <strong>of</strong> her<br />
data are illustrated in Fig. 4.3 (Davidson, 1977a),<br />
which represents the results <strong>of</strong> an experiment in<br />
which eight species <strong>of</strong> granivorous ants were presented<br />
with an artificially produced range <strong>of</strong> seeds <strong>and</strong><br />
seed fragments <strong>of</strong> various sizes. Workers <strong>and</strong> the seeds<br />
they were carrying were then sample <strong>and</strong> measured.<br />
The points in Fig. 4.3 refer to mean values, <strong>and</strong><br />
therefore fail to illustrate the fact that species overlap<br />
considerably in the sizes <strong>of</strong> seed that they take.<br />
Nevertheless, it is clear from Fig. 4.3 that seed size <strong>and</strong><br />
body size are strongly correlated, <strong>and</strong> that each<br />
Fig. 4.3 The relationship between worker body length <strong>and</strong><br />
seed size index for experiments with eight species <strong>of</strong> seedeating<br />
ants near Rodeo, New Mexico. Species designations<br />
are as follows: N.c., Novomessor cockerelli; Ph.d., Pheidole<br />
desertorum; Ph. m., Pheidole militicidu; Ph.s., Pheidole sitarches;<br />
Ph.x., Pheidole xerophila; Pd., Pogonomyrmex desertorum; Rr.,<br />
Pogonomyrmex rugosus S.X., Solenopsis xyloni. All species<br />
except Pheidole militicidu coexist at Rodeo. (After Davidson,<br />
1977a.)<br />
species tends to specialize in seeds <strong>of</strong> a particular size<br />
depending on its own size.<br />
The second facet studied by Davidson was the<br />
species' foraging strategy (Davidson, 1977b), <strong>of</strong> which<br />
there were essentially two types: 'group' <strong>and</strong> 'individual'.<br />
Workers <strong>of</strong> group-foraging species tend to move<br />
together in well-defined columns, so that, at any one<br />
time, most <strong>of</strong> the searching <strong>and</strong> feeding take place in a<br />
restricted portion <strong>of</strong> the area surrounding the nest. By<br />
contrast, in colonies <strong>of</strong> individual foragers, workers<br />
search for <strong>and</strong> collect seeds independently <strong>of</strong> one<br />
another, <strong>and</strong>, as a result, all <strong>of</strong> the area surrounding<br />
the colony is continuously <strong>and</strong> simultaneously<br />
searched. From a series <strong>of</strong> observations <strong>and</strong> experiments,<br />
Davidson was able to show that group foraging<br />
was more efficient than individual foraging when seed<br />
densities were high <strong>and</strong> when the distribution <strong>of</strong> seeds<br />
was clumped; but the relative efficiencies were reversed<br />
at low seed densities <strong>and</strong> when the seeds were<br />
more evenly distributed. The situation with regard to<br />
foraging is therefore directly comparable with that<br />
regarding size. Group <strong>and</strong> individual foragers show a
CHAPTER 4: INTERSPECIFIC COMPETITION 81<br />
considerable potential for overlap in the seeds which<br />
they harvest, but each specializes in a particular<br />
arrangement <strong>of</strong> the resource. In fact, the specialization<br />
resulting from foraging strategy tends to be a temporal<br />
one. Group foragers have marked peaks <strong>of</strong> activity<br />
coinciding with periods <strong>of</strong> high seed density, <strong>and</strong> pass<br />
less favourable periods in a 'resting' state. Individual<br />
foragers, although very active at high seed densities,<br />
retain intermediate levels <strong>of</strong> activity even during the<br />
less favourable periods.<br />
Bearing these observations on size <strong>and</strong> foraging<br />
strategy in mind, we can turn now to some <strong>of</strong><br />
Davidson's (1977a) results concerning the occurrence<br />
<strong>of</strong> various ant species at a range <strong>of</strong> sites. These are<br />
illustrated in Fig. 4.4. It will be convenient, initially, to<br />
restrict our discussion to the ant species with mean<br />
worker sizes exceeding 3 mm. If we do this, there are<br />
several important conclusions we can draw. Almost<br />
without exception, when species <strong>of</strong> similar size coexist<br />
at a site they differ in foraging strategy, <strong>and</strong> when<br />
species <strong>of</strong> similar foraging strategy coexist at a site<br />
they differ in size. The only apparent exception, in<br />
fact, is the coexistence <strong>of</strong> Pogonomyrmex desertorum<br />
<strong>and</strong> P. maricopa at site A, <strong>and</strong> <strong>of</strong> these the latter occurs<br />
only rarely. Certainly this should not prevent us from<br />
drawing the general conclusion that when several<br />
species <strong>of</strong> granivorous ant coexist at a single site, each<br />
specializes in a different way in its utilization <strong>of</strong> the<br />
food resource.<br />
Conversely, when the species compositions <strong>of</strong> different<br />
sites are compared, it is apparent that the<br />
species similar in both size <strong>and</strong> foraging strategy act as<br />
'ecological replacements' for one another. Thus, <strong>of</strong> the<br />
two group foragers exceeding 9 mm in length, P.<br />
barbatus <strong>and</strong> P. rugosus, only one ever inhabits a site;<br />
<strong>and</strong> <strong>of</strong> the three individual foragers between 6 <strong>and</strong><br />
7.6 mm in length, P. californicus. P. desertorum <strong>and</strong><br />
P. maricopa, there is never more than one that is<br />
Site<br />
A<br />
B<br />
C<br />
D<br />
E<br />
0 1 2 3 4 5 6 7 8 9 1 0<br />
Size (mm)<br />
Fig. 4.4 Mean worker body lengths <strong>of</strong> seed-eating ants at P.C., Pogonomyrmex calijornicus; P. m., Pogonomyrmex<br />
five sites: A, Rodeo 'A', New Mexico; B, Rodeo 'B', New maricopa: P.p., Pogonomyrmex pima; V.p., Veromessor<br />
Mexico; C, Casa Gr<strong>and</strong>e, Arizona; D, Ajo, Arizona; E, Gila perg<strong>and</strong>ei. G, group forager; I, individual forager; species<br />
Bend, Arizona. Species designations as for Fig. 4.3 plus designated by open circles occur only rarely. (After<br />
Ph.g., Pheidole gilvescens; P. b., Pogonomyrmex barbatus: Davidson, 1977a.)
82 PART 2: INTERSPECIFIC INTERACTIONS<br />
common. Given the numbers <strong>of</strong> species <strong>and</strong> sites, this<br />
is very unlikely to be mere coincidence. Overall,<br />
therefore, it appears that although amonsgt the guild<br />
<strong>of</strong> granivorous ants there is overlap in resource<br />
utilization <strong>and</strong> interspecific competition for food, there<br />
is coexistence only between species that differ in size,<br />
or foraging strategy, or both. Species that do not differ<br />
in at least one <strong>of</strong> these respects are apparently unable<br />
to coexist.<br />
The data for ant species less than 3 mm in length,<br />
however, do not conform to this pattern. It could be<br />
claimed that Pheidole sitarches <strong>and</strong> Ph. gilvescens are<br />
ecological replacement for one another, but, overall, it<br />
Fig. 4.5 The relationship between the within-colony<br />
<strong>of</strong> variation (CV) in m<strong>and</strong>ible length for<br />
any differentiation in size or foraging strategy. There ants in the community. (After Davidson, 1978.)<br />
are three possible explanations. The first is that the<br />
mode <strong>of</strong> coexistence <strong>of</strong> the larger species, described though they utilize the resource in the same way. The<br />
above, is not a general phenomenon; these small second explanation is that the Pheidole species do<br />
species compete for a resource <strong>and</strong> coexist, even utilize the seed resource in different ways, but at<br />
Fig. 4.6 Some frequency<br />
distributions <strong>of</strong> m<strong>and</strong>ible size classes<br />
for Veromessor perg<strong>and</strong>ei, with the<br />
mean m<strong>and</strong>ible lengths <strong>of</strong><br />
competitors most similar in size<br />
indicated by arrows. (After<br />
Davidson, 1978.)
CHAPTER 4: INTERSPECIFIC COMPETITION 83<br />
present the basis for the differentiation-some third<br />
facet <strong>of</strong> their feeding ecology-is unknown to us.<br />
Finally, the third explanation is that these species are<br />
not limited <strong>and</strong> do not compete for the seed resource<br />
because they are limited in some other way; perhaps<br />
by some other resource, or by a predator that keeps<br />
their densities so low that there is no competition.<br />
The most important aspect <strong>of</strong> these three alternative<br />
explanations is that they illustrate some very basic<br />
methodological problems in the study <strong>of</strong> interspecific<br />
competition. The second <strong>and</strong> third explanations are<br />
based on our ignorance concerning the ants' ecology;<br />
but since we are always likely to be ignorant <strong>of</strong> a<br />
species' ecology to some extent, these explanations<br />
can never be discounted. The first explanation is,<br />
therefore, left as a last resort: to be used only when we<br />
are confident <strong>of</strong> our own infallibility! Furthermore,<br />
these second <strong>and</strong> third explanations are essentially<br />
dependent on there being some 'other' important<br />
differences between the Pheidole species. Yet the mere<br />
discovery <strong>of</strong> differences between the species cannot, in<br />
itself, support either <strong>of</strong> the explanations. The differences<br />
must also be shown to reflect differential utilization<br />
<strong>of</strong> a resource for which the species do compete.<br />
Coexistence requires differences; but there are likely<br />
to be many differences that have nothing to do with<br />
coexistence. There are, therefore, some very real<br />
difficulties in studying interspecific competition (to<br />
which we shall return in section 4.11). Yet, as we shall<br />
see below, concerted effort <strong>of</strong>ten confirms that when<br />
competing species coexist they do so by differential<br />
utilization <strong>of</strong> the resource for which they are competing.<br />
Finally, Davidson (1978) looked closer still at just<br />
one <strong>of</strong> these species (Verornessor perg<strong>and</strong>ei) that differs<br />
in size, <strong>and</strong> size variation, from site to site. Some <strong>of</strong> her<br />
results are illustrated in Figs 4.5 <strong>and</strong> 4.6. In this case<br />
Davidson used m<strong>and</strong>ible length as a measure <strong>of</strong> size,<br />
<strong>and</strong>, as Fig. 4.5 shows, the variability <strong>of</strong> this measurement<br />
decreased significantly as the diversity <strong>of</strong> potential<br />
competitors at a site increased. In other words, V.<br />
perg<strong>and</strong>ei is apparently more <strong>of</strong> a size specialist at those<br />
sites in which interspecific competition is most likely,<br />
<strong>and</strong> less <strong>of</strong> a specialist where it is least likely. This is<br />
also apparent from Fig. 4.6, which suggests, in addi-<br />
tion, that size itself is strongly influenced by those<br />
species which are most similar to V. perg<strong>and</strong>ei in<br />
m<strong>and</strong>ible length. The effect is particularly noticeable<br />
at Ajo, where Pogonomyrrnex pima (mean m<strong>and</strong>ible<br />
length, 0.64 mm) coexists with V. perg<strong>and</strong>ei (0.81 mm).<br />
Note that, because <strong>of</strong> the nature <strong>of</strong> the data, we<br />
cannot conclude with absolute certainty that V. perg<strong>and</strong>ei<br />
competes with the other ant species for food;<br />
but we can say that, at each site, a form <strong>of</strong> V, perg<strong>and</strong>ei<br />
has evolved which competes less with, the other<br />
species than it might have done. Thus, this single,<br />
elegant example illustrates four important points.<br />
1 Species from distantly related taxa can compete<br />
with one another for a limited resource.<br />
2 Competition need not lead to exclusion: competitors<br />
can still coexist.<br />
3 Coexisting species tend to differ in at least one<br />
respect in the way they utilize the limited resource,<br />
<strong>and</strong> species which utilize the resource in the same<br />
way tend to exclude one another from a site.<br />
4 The precise nature <strong>of</strong> a species, <strong>and</strong> thus the precise<br />
way in which it utilizes the resource, can itself<br />
respond to the species' competitive milieu.<br />
4.4 Competition between plant species:<br />
experimental approaches<br />
Experimental approaches to interspecific competition<br />
in plants have followed one or other <strong>of</strong> two broad<br />
pathways. On the one h<strong>and</strong>, for a particular controlled<br />
suite <strong>of</strong> resources, investigators have altered the<br />
number <strong>of</strong> individual plants present in a two-species<br />
mixture, varying either the density or the relative<br />
frequency <strong>of</strong> species, or both. On the other h<strong>and</strong>,<br />
deliberate manipulation <strong>of</strong> particular resources has<br />
been made to assess the responses <strong>of</strong> competing species.<br />
<strong>Plants</strong> raised from seed or from ramets in a pot are<br />
easy to manipulate experimentally <strong>and</strong> it is not surprising<br />
that changes to density in two-species mixtures<br />
have provided the main thrust, at least historically.<br />
4.4.1 Manipulating density<br />
Deliberate manipulation <strong>of</strong> the number <strong>of</strong> plants in a<br />
pot allows the density <strong>and</strong> proportion <strong>of</strong> species in
84 PART 2: INTERSPECIFIC INTERACTIONS<br />
mixture to be changed at will, <strong>and</strong>, since the plants are<br />
together in the same pot, there will, at suitable<br />
densities, necessarily be root competition for finite<br />
(nutrient <strong>and</strong> water) resources in the soil, <strong>and</strong> shading<br />
amongst adjacent leaves resulting in competition for<br />
incident radiation within the canopy. However, although<br />
the execution <strong>of</strong> a competition experiment<br />
may appear straightforward, its design is not. Consider<br />
a pot containing a mixture <strong>of</strong> plants: 100 <strong>of</strong> species A<br />
<strong>and</strong> 50 <strong>of</strong> species B. Addition <strong>of</strong> 50 plants <strong>of</strong> species B<br />
to this pot has two immediate effects. First, it changes<br />
the overall density, increasing it by a third; but it also<br />
alters the proportion <strong>of</strong> species B to A in the mixture<br />
from 113 to 112. In other words, additive expriments like<br />
this confound two important variables which should,<br />
ideally, be clearly separated. One solution to this<br />
problem in design is deliberately to maintain the<br />
overall plant density constant, but to vary the proportions<br />
<strong>of</strong> the mixture by substitution. The inception <strong>and</strong><br />
development <strong>of</strong> the design <strong>and</strong> analysis <strong>of</strong> these<br />
substitutive competition experiments has largely been<br />
the work <strong>of</strong> de Wit <strong>and</strong> his colleagues in the Netherl<strong>and</strong>s<br />
(de Wit, 1960). The basis <strong>of</strong> the experimental<br />
design is the 'replacement series' in which seeds <strong>of</strong><br />
two species are sown to constant overall density, but<br />
the proportions <strong>of</strong> both species are varied in the<br />
mixture from 0 to 10O01o. At a density <strong>of</strong> 200 plants we<br />
may have 100 A <strong>and</strong> 100 B, 50 A <strong>and</strong> 150 B, 0 A <strong>and</strong><br />
200 B <strong>and</strong> so on, representing a set <strong>of</strong> mixtures all at<br />
constant density. Such a series may be repeated at<br />
different densities if required.<br />
Figure 4.7 summarizes the types <strong>of</strong> experimental<br />
designs that have been used in investigating competition<br />
between two species. In the simplest case <strong>of</strong> an<br />
additive design (Fig. 4.7a) species Y is added over a<br />
range <strong>of</strong> densities to a constant density <strong>of</strong> a target<br />
species (X), such that with each addition the overall<br />
number <strong>of</strong> plants per pot increases. Case 4.7b illustrates<br />
the substitutive design in which the overall<br />
density remains constant <strong>and</strong> the ratio <strong>of</strong> species X to<br />
species Y is varied. In the third design (Fig. 4.7~) all<br />
possible combinations <strong>of</strong> density <strong>and</strong> frequency are<br />
considered such that at any one density there is<br />
substitutive series (diagonal combinations, Fig. 4.7~)<br />
<strong>and</strong> there are also addition series for both species<br />
Fig. 4.7 The range <strong>of</strong> experimental designs used to assess<br />
plant competition. represents a combination <strong>of</strong> planting<br />
densities <strong>of</strong> the two species. (See text for details.)<br />
(horizontal <strong>and</strong> vertical combinations Fig. 4.7~). We<br />
will call this a full additive design.<br />
Simple additive experiments have been used by<br />
agronomists to demonstrate the outcome <strong>of</strong> competition<br />
between crops (the target species) <strong>and</strong> weeds <strong>and</strong><br />
by plant ecologists investigating the effects <strong>of</strong> neighbours<br />
on the yield <strong>of</strong> a single target plant (Goldberg,<br />
1987). Figure 4.8 illustrates the results <strong>of</strong> a typical<br />
additive experiment, in this case wheat experiencing<br />
competition from the weed Bromus sterilis. Bromus<br />
seeds were established over a wide density range (from<br />
0 to over 100 plants) into pots containing a common<br />
density <strong>of</strong> wheat. The design therefore follows
CHAPTER 4: INTERSPECIFIC COMPETITION 85<br />
Fig. 4.8 The response <strong>of</strong> wheat to<br />
competition from Bromus sterilis in<br />
an additive series experiment. (After<br />
Firbank et al., 1990.)<br />
Fig. 4.7a in which species X is the wheat <strong>and</strong> species Y<br />
is the Bromus. Seeds <strong>of</strong> both species germinated largely<br />
simultaneously, no plants died during the experiment<br />
<strong>and</strong> the yield <strong>of</strong> the wheat was measured shortly<br />
before the plants flowered. We can see (Fig. 4.8) that<br />
the yield <strong>of</strong> the wheat diminishes with increasing<br />
density <strong>of</strong> Bromus. Such a yield relationship may be<br />
described as hyperbolic, the yield <strong>of</strong> the target species<br />
(wheat) declining towards an asymptote as the density<br />
<strong>of</strong> the added species (Bromus) increases.<br />
This form <strong>of</strong> relationship in simple additive experiments<br />
has been widely observed for many plant<br />
species (Silvertown & Lovett Doust, 1993). Whilst<br />
being useful in practice for empirically ranking the<br />
damage done by weed species to a crop it is not<br />
possible to disentangle the competitive effect <strong>of</strong> the<br />
weed on crop yield, from the overall effect <strong>of</strong> increasing<br />
total plant density in the mixture. Substitutive<br />
designs have therefore been employed to investigate<br />
competitive effects at constant total density <strong>and</strong> an<br />
early but exemplary approach <strong>of</strong> how this may be<br />
done comes from work on wild oats.<br />
In the annual grassl<strong>and</strong>s <strong>of</strong> California two wild oat<br />
species, Avena fatua <strong>and</strong> A. barbata, occur naturally<br />
together, <strong>and</strong> Marshall <strong>and</strong> Jain (1969) undertook an<br />
experimental analysis <strong>of</strong> the competitive interaction<br />
between them, in order to elucidate the extent <strong>and</strong><br />
pattern <strong>of</strong> their cohabitation. The two oats were<br />
grown together from seed at four densities-32, 64,<br />
128 <strong>and</strong> 256 plants per pot-<strong>and</strong> five frequencies-0,<br />
12.5, 50, 87.5 <strong>and</strong> 100% <strong>of</strong> the total sown. After 29<br />
weeks <strong>of</strong> growth in a greenhouse, the yield <strong>of</strong> spikelets<br />
per pot was assessed for each species. To measure the<br />
intensity <strong>of</strong> intraspec$c competition across the range <strong>of</strong><br />
densities in the mixtures, both species were also<br />
grown in monoculture (pure st<strong>and</strong>). Figure 4.9 shows<br />
that the yield per pot in monoculture finally became<br />
independent <strong>of</strong> initial sowing density. This is the<br />
background <strong>of</strong> intraspecific competition against which<br />
Fig, 4.9 Intraspecific competition in Avena jatua <strong>and</strong> A.<br />
barbata. (From Marshal1 & Jain, 1969.)
86 PART 2: INTERSPECIFIC INTERACTIONS<br />
we must assess the reaction <strong>of</strong> each species grown in<br />
mixture.<br />
Figure 4.10 shows the replacement diagrams for<br />
each <strong>of</strong> the four densities, with yields per pot plotted<br />
against the proportion in mixture. The dotted lines in<br />
these diagrams are the appropriate yield responses<br />
from Fig. 4.9 <strong>of</strong> each species grown on its own; solid<br />
lines show the responses <strong>of</strong> each in mixture. Comparison<br />
<strong>of</strong> these lines for each species thus allows us to<br />
gauge the effect <strong>of</strong> interspecific competition. At the<br />
lowest total density (32 plants per pot), the yield<br />
responses <strong>of</strong> A. fatua in mixture <strong>and</strong> pure st<strong>and</strong> are<br />
almost identical, suggesting that this species is not<br />
responding to the presence <strong>of</strong> A. barbata in mixture.<br />
Conversely, for A. barbata the yield is depressed so that<br />
at the equiproportional mixture it is reduced to only<br />
44%. The interaction appears to be amensal.<br />
Examining the higher planting densities, however,<br />
(Fig. 4.10b-d) reveals a truly competitive interaction<br />
between the species. The monoculture yield responses<br />
are all convex, indicating yield limitation by intraspecific<br />
competition. Yet in mixture the yield responses <strong>of</strong><br />
Fig. 4.10 De Wit replacement<br />
diagrams for Avena fatua <strong>and</strong> A.<br />
barbata when grown in mixture at<br />
four overall densities. Dotted lines<br />
are the yield expectations in<br />
monoculture, solid lines the yield<br />
in mixture. (After Marshal1 & Jain,<br />
1969.)
CHAPTER 4: INTERSPECIFIC COMPETITION 87<br />
A. barbata are all concave, <strong>and</strong> with increasing total<br />
plant density they become substantially depressed<br />
below the expected yield in pure st<strong>and</strong>. The same is<br />
also true for A. fatua, since if we examine this species'<br />
response in mixture over the four densities, spikelet<br />
yield departs more <strong>and</strong> more from the monoculture<br />
expectation. There is, therefore, mutual depression<br />
resulting from interspecific competition. However, the<br />
shape <strong>of</strong> A. fatua's response curve changes from<br />
convex (Fig. 4. lOa), through linear (Fig 4.10c), to almost<br />
concave (Fig. 4.10d). So, whilst suffering interspecific<br />
competition, A. fatua is performing relatively<br />
better than A. barbata in mixture: it has a competitive<br />
advantage over A. barbata; <strong>and</strong> for both species the<br />
intensity <strong>of</strong> interspecific competition increases with<br />
overall density.<br />
Interpretation <strong>of</strong> replacement diagrams, then, involves<br />
two consideration~:<br />
1 an assessment <strong>of</strong> what a species might do when<br />
growing on its own at densities equivalent to the<br />
densities it experiences in the replacement series; <strong>and</strong><br />
2 a measurement <strong>of</strong> the departure from this response<br />
when grown in mixture.<br />
A response in mixture that is concave necessarily<br />
means that a species is suffering interspecific competition,<br />
since the yield-density response in monoculture<br />
can only be linear or convex (intraspecifically limited).<br />
However, a convex response does not mean that a<br />
species is not experiencing interspecific competition.<br />
We can only assess this with the additional knowledge<br />
<strong>of</strong> the equivalent pure st<strong>and</strong> response. Our important<br />
conclusions from this experiment are (i) that interspecific<br />
competition between two plant species may affect<br />
the performance <strong>of</strong> both, but to different extents, i.e. it<br />
is asymmetric; <strong>and</strong> (ii) that the intensity <strong>of</strong> competition<br />
is dependent on the density at which the interaction<br />
takes place.<br />
Marshal1 <strong>and</strong> Jain's experimental design represents<br />
a set <strong>of</strong> replacement series (four diagonals, see<br />
Fig. 4.7b). However, to fully explore the outcome <strong>of</strong><br />
two-species competition we must use a complete<br />
additive design (four diagonals, Fig. 4.7~). Law <strong>and</strong><br />
Watkinson (1987) grew the s<strong>and</strong> dune annuals Phleum<br />
awenarium <strong>and</strong> Vulpia fasiculata in eight density combinations<br />
over a density range <strong>of</strong> 1-200 plants per<br />
9-cm diameter pot, together with monoculture plantings<br />
over the same range. After fruiting was complete,<br />
they measured seed yield <strong>and</strong> examined graphically<br />
the response surface arising from competition in<br />
relating to the sown density combinations (Fig. 4.11).<br />
Comparison <strong>of</strong> the two surfaces reveals that in general<br />
Phleum was more sensitive to increases in density than<br />
Vulpia-yields decline more sharply for Phleum, top left<br />
to bottom right across the mixtures. More importantly<br />
the data suggest that there is an intergrading <strong>of</strong> the<br />
effects <strong>of</strong> inter- <strong>and</strong> intraspecific competition across<br />
the total plant density range. When present in mixture<br />
at low density, both species were sensitive to an<br />
increase in the density <strong>of</strong> the other, a response which<br />
diminished with increasing density <strong>of</strong> the mixture. At<br />
the highest sowing density, each species (200 plants<br />
per pot), responded little to the presence <strong>of</strong> the<br />
competitor over the entire density range. We may<br />
infer from this that the most important competitive<br />
interactions at high density tend to be intraspecific<br />
ones.<br />
All <strong>of</strong> the above experimental approaches provide<br />
methods that may illustrate the existence <strong>of</strong> competition<br />
between pairs <strong>of</strong> species but not its long-term<br />
outcome over generations, a point we will consider<br />
more fully below. Earlier editions <strong>of</strong> this <strong>and</strong> other<br />
textbooks <strong>of</strong>ten refer to a further form <strong>of</strong> analysis <strong>of</strong><br />
data collected on a substitutive series design <strong>and</strong> the<br />
use <strong>of</strong> relative yields to suggest whether or not prolonged<br />
competition between two plant species will<br />
result in competitive exclusion or coexistence. The<br />
relative yield <strong>of</strong> a species in a given mixture is the ratio<br />
<strong>of</strong> its yield in mixture to its yield in monoculture in the<br />
replacement series. Calculating yield in this way<br />
removes any absolute yield differences that may exist<br />
between species <strong>and</strong> refers both yields to the same<br />
scale. The relative yield total (RYT) is then the sum <strong>of</strong><br />
the two relative yields in a mixture. The original<br />
proponents <strong>of</strong> this approach argued that if the RYT <strong>of</strong><br />
a particular mixture was unity then both species are<br />
competing for the same resources for growth in that<br />
the relative gain <strong>of</strong> one species (in numbers <strong>and</strong><br />
resource acquisition) is exactly balanced by the relative<br />
loss <strong>of</strong> the other. RYT values greater than unity<br />
therefore signify differing resource dem<strong>and</strong>s-one
88 PART 2: INTERSPECIFIC INTERACTIONS<br />
XI<br />
Phleum<br />
XI<br />
Phleum<br />
Densities shown are per 9 cm diameter pot<br />
Fig. 4.11 The response surface measured as as seed yeild<br />
per plant <strong>of</strong> (a) Phleum arenarium, <strong>and</strong> (b) Vulpia fasiculata<br />
arising from sowing in monoculture <strong>and</strong> mixture over a<br />
range <strong>of</strong> densities <strong>and</strong> frequencies. (After Law & Watkinson,<br />
1987.)<br />
species' gain is accompanied by a comparatively<br />
minor loss <strong>of</strong> the other. Figure 4.12 illustrates data<br />
analysed in this way. de Wit et al. (1966) experimented<br />
on a grass legume mixture (Panicum maximum <strong>and</strong><br />
Fig. 4.12 Relative yield totals in the analysis <strong>of</strong> interspecific<br />
competition between Panicum maximum (P) <strong>and</strong> Glycine<br />
javanica (G) in the presence <strong>and</strong> absence <strong>of</strong> Rhizobium.<br />
(From de Wit et al., 1966.)<br />
Glycine javanica) typical <strong>of</strong> Australian pastures. The<br />
grass Panicum can only acquire nitrogen from the soil<br />
while Glycine acquires part <strong>of</strong> its nitrogen by nitrogen<br />
fixation from the air through its mycorrhizal association<br />
with Rhizobium. Both species were grown in a<br />
substitutive series with <strong>and</strong> without an inoculation <strong>of</strong><br />
Rhizobium. The RYTs for both dry matter yield <strong>and</strong><br />
nitrogen content <strong>of</strong> the plant were not significantly<br />
different from 1 in all mixtures in the absence <strong>of</strong><br />
Rhizobium. In contrast, when inoculated with Rhizobium<br />
in all mixtures investigated RYTs exceeded 1.<br />
The clear inference from this experiment is that<br />
when both grass <strong>and</strong> legume compete for the same<br />
nitrogen source (soil nitrogen), the legume will experience<br />
such intense competition from the grass that it<br />
will ultimately disappear from the mixture; but if the<br />
legume is able to utilize a different source, namely<br />
nitrogen from the air fixed by Rhizobium, then the two<br />
species will coexist.<br />
Connolly (1986) has pointed out that the interpretation<br />
<strong>of</strong> RYTs is based on restrictive assumptions. The<br />
first is that the yields <strong>of</strong> the individual species in the<br />
monocultures (the 'ends' <strong>of</strong> the replacement series) are<br />
the same as those that would be achieved if each<br />
species was grown alone at the constituent densities<br />
used over the series. In other words, each species is
CHAPTER 4: INTERSPECIFIC COMPETITION 89<br />
sown in mixture <strong>and</strong> monoculture at a density that<br />
gives constant final yield (Chapter 2). Second, RYTs<br />
greater than 1 indicate potential coexistence in mixture<br />
only at the particular proportion <strong>and</strong> density<br />
investigated. Because <strong>of</strong> these restrictions, Connolly<br />
proposed an index based on a concept <strong>of</strong> relative<br />
resource acquisition by species in mixture. He argued<br />
that for a species A grown at a density (Nu,,) in<br />
association with species B (total mixture density,<br />
Nu,, + N,,,) there will be a density Nu in monoculture<br />
which will give the same per plant yield (Y) as that<br />
observed in mixture. The reciprocal <strong>of</strong> this density<br />
(l/Na), the area occupied by an individual plant, is a<br />
measure <strong>of</strong> the resources needed to achieve Y. The<br />
area required to produce the equivalent yield <strong>of</strong> Nu,,<br />
individuals with yield Y is then Na,,/Na. By similar<br />
argument, the corresponding area for species B is<br />
Nb,,/Nb, where terms are equivalently defined. The<br />
relative resource total (RRT) is then the sum <strong>of</strong> these two<br />
ratios. If the RRT is greater than 1, the mixture <strong>of</strong> A<br />
<strong>and</strong> B returns a higher yield than the monocultures<br />
<strong>and</strong> thus this index measures the extent to which<br />
species utilize different resources. It should be noted,<br />
however, that if RRT is greater than 1, this does not<br />
imply that the mixture shows superior yielding to both<br />
the monocultures (Connolly, 1986). Further discussion<br />
<strong>of</strong> the strengths <strong>and</strong> weaknesses <strong>of</strong> the designs<br />
available for investigating plant competition is given<br />
by Firbank <strong>and</strong> Watkinson (1990) <strong>and</strong> Snaydon<br />
(1991).<br />
4.4.2 Manipulating resources<br />
The alternative approach to underst<strong>and</strong>ing interspecific<br />
competition has developed from the recognition<br />
that the methods above describe outcomes <strong>of</strong> competition<br />
but shed little light on the resources which may<br />
be limiting <strong>and</strong> hence on underlying mechanisms.<br />
Goldberg (1990) has drawn attention to the distinction<br />
between the effects <strong>of</strong> competition <strong>and</strong> the responses to<br />
competition. Competing plants will result in a lowering<br />
<strong>of</strong> resource availability but the significance <strong>of</strong> this<br />
reduction depends on the fitness <strong>of</strong> individuals at the<br />
lowered resource level(s) (Fig. 4.13).<br />
The development <strong>of</strong> our ideas <strong>of</strong> how competition<br />
Fig. 4.13 (a) The effect on resource availability caused by<br />
plants, <strong>and</strong> (b) the response to resource availability by<br />
plants. (From Goldberg, 1990.)<br />
<strong>and</strong> coexistence may be determined by resource<br />
depletion <strong>and</strong> species' response to it has come in large<br />
part from the work <strong>of</strong> Tilman (1976, 1982) using<br />
planktonic algal species. Silicate <strong>and</strong> phosphate are<br />
essential compounds in the aqueous environment <strong>of</strong><br />
Asterionella formosa <strong>and</strong> Cyclotella meneghiniana, as<br />
they are needed for the development <strong>of</strong> skeletal<br />
structure. The growth rate <strong>of</strong> populations <strong>of</strong> these<br />
single-celled organisms may be expected to be governed<br />
by the supply <strong>of</strong> these compounds in the<br />
aqueous environment. From experimental studies,<br />
Tilman (1976) showed that the actual growth-rate <strong>of</strong><br />
each species was determined by the concentration <strong>of</strong><br />
whichever compound was the more limiting <strong>and</strong><br />
moreover there were absolute limits below which<br />
growth could not occur. He was thus able to quantify<br />
the ranges <strong>of</strong> silicate <strong>and</strong> phosphate concentration at<br />
which both species would exhibit positive population<br />
growth-rate, when these compounds were supplied at<br />
a constant rate. Figure 4.14a illustrates the fundamental<br />
niches <strong>of</strong> each species with respect to silicate<br />
<strong>and</strong> phosphate. Neither species can inhabit environments<br />
characterized as region 1 as the supply <strong>of</strong> both<br />
resources is just too sparse. In region 2, however,<br />
silicate levels are above the threshold for net positive<br />
growth <strong>of</strong> Cyclotella but not for Asterionella. In region 3<br />
the converse is the case, but here it is phosphate that<br />
is the limiting resource. In the concentration ranges<br />
shown by region 4, populations <strong>of</strong> both species were<br />
not limited by either resource <strong>and</strong> competition can be
90 PART 2: INTERSPECIFIC INTERACTIONS<br />
Fig. 4.14 Competition between two algae, Asterionella<br />
formosa <strong>and</strong> Cyclotella meneghiniana. (a) The fundamental<br />
niche <strong>of</strong> each species is defined. (b) Predicted outcome <strong>of</strong><br />
competition between the species. Symbols indicate the<br />
winners <strong>and</strong> losers in competition experiments in aqueous<br />
environments <strong>of</strong> varying silicate/phosphate concentration.<br />
The predicted outcomes <strong>of</strong> competition according to the<br />
supply <strong>of</strong> phosphate <strong>and</strong> silicate are indicated by alternative<br />
shading. Data points represent the results <strong>of</strong> experimental<br />
tests <strong>of</strong> these predictions. In all but two experiments<br />
predictions were confirmed. (O), Asterionella wins; (0)<br />
Cyclotella wins; (+), coexistence <strong>of</strong> both species. (From<br />
Tilman, 1977, 1982.)<br />
expected to occur between them. Tilman postulated<br />
that the outcome <strong>of</strong> competition in region 4 was<br />
determined by the relative species' consumption-rates<br />
<strong>of</strong> the two compounds in relation to the supply-rates.<br />
Consider point X (Fig. 4.14a), which is the first combination<br />
<strong>of</strong> resources at which both species may potentially<br />
coexist. They will do so only if the ratio <strong>of</strong><br />
consumption-rate to supply-rate is exactly balanced<br />
<strong>and</strong> sufficient for each species with respect to each<br />
resource (i.e. not in region 2 or 4). If consumption <strong>of</strong> a<br />
resource by one species is not matched by supply <strong>and</strong><br />
the resulting concentration falls below the threshold<br />
needed by the other species then competitive exclusion<br />
will occur. Thus consumption <strong>of</strong> phosphate by<br />
Asterionella in excess <strong>of</strong> supply rate by the environment<br />
will reduce phosphate concentration to a level at<br />
which Cyclotella cannot persist (region 3, below point<br />
X). Similarly, over consumption <strong>of</strong> silicate by Cyclotella<br />
will lead to exclusion <strong>of</strong> Asterionella.<br />
Extension <strong>of</strong> this argument (see Tilman, 1980;<br />
Begon et al., 1990) leads to the following conclusion.<br />
Competitive exclusion will always occur unless each<br />
species consumes its more limiting resource at a rate<br />
in excess <strong>of</strong> the supply; or, in other words, coexistence<br />
can only arise because <strong>of</strong> concurrent disproportionate<br />
exploitation <strong>of</strong> the more limiting resource by each<br />
species. In Fig. 4.14b, the hatched region illustrates<br />
the combinations <strong>of</strong> silicate <strong>and</strong> phosphate concentration<br />
in which such disproportionate exploitation was<br />
predicted to occur, together with experimental tests <strong>of</strong><br />
these predictions (Tilrnan, 1982). We can see that<br />
pleasingly in all but two circumstances the experiments<br />
confirmed the predictions.<br />
In conclusion, these experiments on plants confirm<br />
the findings <strong>and</strong> interpretations <strong>of</strong> the studies on ants.<br />
Two species may compete with one another <strong>and</strong><br />
coexist, even though the competition has a detrimental<br />
effect on both species. Moreover, the conclusion<br />
has also been reinforced that for two species to coexist<br />
they must in some way avoid making identical dem<strong>and</strong>s<br />
for limited environmental resources.<br />
4.5 The ecological niche<br />
It is necessary to digress slightly at this point. The term<br />
'ecological niche' has been in the ecological vocabulary<br />
for over 70 years, but for more than half <strong>of</strong> this<br />
time its meaning was rather vague (see V<strong>and</strong>ermeer,<br />
1972 for a historical review). Here, we shall concern
CHAPTER 4: INTERSPECIFIC COMPETITION 91<br />
ourselves only with its current, generally accepted<br />
meaning, originating with Hutchinson (1957).<br />
If we consider a single environmental parameter<br />
(e.g. temperature), then a species will only be able to<br />
survive <strong>and</strong> reproduce within certain temperature<br />
limits. This range <strong>of</strong> temperature is the species'<br />
ecological niche in one dimension (Fig. 4.15a). If we<br />
also consider the range <strong>of</strong> humidities in which the<br />
species can survive <strong>and</strong> reproduce, then the niche<br />
becomes two-dimensional <strong>and</strong> can be visualized as an<br />
area (Fig. 4.15b); <strong>and</strong> if a third dimension is added<br />
(food particle size in Fig. 4.15~) then the niche becomes<br />
a volume. Yet it is clear that there are many<br />
biotic <strong>and</strong> abiotic parameters affecting a species: the<br />
number <strong>of</strong> niche dimensions (n) greatly exceeds three.<br />
We cannot visualize such a situation; but we can, by<br />
analogy with the three-dimensional model, consider a<br />
species' ecological niche to be an 'n-dimensional<br />
hypervolume' within which a positive contribution to<br />
future generations can be made. And this, in essence,<br />
is Hutchinson's conception <strong>of</strong> the niche. There are,<br />
however, several additional, important points which<br />
must be understood.<br />
Fig. 4.15 Building up the n-dimensional hypervolume:<br />
ecological niches. (a) in one dimension (temperature); (b) in<br />
two dimensions (temperature <strong>and</strong> humidity); (c) in three<br />
dimensions (temperature, humidity <strong>and</strong> food particle size).<br />
1 The ecological niche <strong>of</strong> a species has been defined<br />
from the species' point <strong>of</strong> view. This allows it to be<br />
contrasted with the term 'habitat', which is an objective<br />
description-in n-dimensions if need be-<strong>of</strong> the<br />
environment itself. Thus, although both niche <strong>and</strong><br />
habitat are defined in terms <strong>of</strong> environmental parameters,<br />
the term niche characterizes a species, while the<br />
term habitat characterizes an environment within<br />
which many species may live.<br />
2 Hutchinson gave special consideration to one particular<br />
type <strong>of</strong> environmental parameter: interspecific<br />
competitors. The connections between interspecific<br />
competition <strong>and</strong> the ecological niche should become<br />
much clearer below, but we can outline Hutchinson's<br />
ideas at this stage. He called the niche <strong>of</strong> a species in<br />
the absence <strong>of</strong> competitors from other species its<br />
fundamental niche, i.e. the niche which it could potentially<br />
occupy. In the presence <strong>of</strong> competitors the<br />
species is restricted to a realized niche, the precise<br />
nature <strong>of</strong> which is determined by which competing<br />
species are present. In other words, Hutchinson<br />
wished to stress that interspecific competition reduced<br />
contributions to future generations, <strong>and</strong> that as a<br />
result <strong>of</strong> interspecific competition, contributions in<br />
certain parts <strong>of</strong> a species' fundamental niche might be<br />
reduced to zero. These parts <strong>of</strong> the fundamental niche<br />
are absent from the realized niche.<br />
3 A species' niche might also be restricted in practice<br />
by the habitat: parts <strong>of</strong> a species' niche-fundamental<br />
or realized-which are simply not present at a particular<br />
location (in space <strong>and</strong> time) become, temporarily,<br />
irrelevant. This is particularly pertinent to laboratory<br />
investigations, in which the simplicity <strong>of</strong> the habitat<br />
confines species to those parts <strong>of</strong> their niche which<br />
happen to be provided by the experimenter.<br />
4 Finally, it must be stressed that the Hutchinsonian<br />
niche is not supposed to be a literal description <strong>of</strong> a<br />
species' relationship with its environment. Like other<br />
models, it is designed to help us think, in useful terms,<br />
about an immensely complex interaction. For instance,<br />
the perpendicularity <strong>of</strong> the volume in<br />
Fig. 4.15~ is a result <strong>of</strong> the assumption that the three<br />
parameters are independent. Interaction <strong>of</strong> variablesalmost<br />
certainly the general rule-would lead to a less<br />
regularly shaped niche; but in practice a perpendicular
92 PART 2: INTERSPECIFIC INTERACTIONS<br />
visualization may be just as useful. Similarly, the solid<br />
lines around the niche in Fig. 4.15 ignore the existence<br />
<strong>of</strong> variability within a species. Each individual has a<br />
niche, <strong>and</strong> a species' niche is, in effect, the superimposition<br />
<strong>of</strong> as many niches as there are individuals: a<br />
species' niche should have very blurred edges. Once<br />
again, however, such sophistication is rarely necessary<br />
in practice.<br />
4.6 The Competitive Exclusion Principle<br />
We can now return to our main theme <strong>and</strong> consider<br />
two laboratory investigations <strong>of</strong> interspecific competition.<br />
The first is the work <strong>of</strong> Park (1954) on the flour<br />
beetles Tribolium confusum <strong>and</strong> T. castaneum. In a series<br />
<strong>of</strong> simple, sterilized cultures, Park held most environmental<br />
variables constant, but varied a single, albeit<br />
complex parameter: climate. In all conditions, both<br />
species were able to survive in monospecific cultures:<br />
the fundamental niches <strong>of</strong> both species spanned the<br />
whole climatic range (Fig. 4.16a). In mixed-species<br />
cultures, however, the results were as outlined in<br />
Table 4.4. It appears that the climatic extremes are<br />
represented in the realized niche <strong>of</strong> only one <strong>of</strong> the<br />
two species. In the middle <strong>of</strong> the range there is also,<br />
invariably, elimination <strong>of</strong> one species by the other; but<br />
the precise outcome is probable rather than definite.<br />
The situation can therefore be visualized as in<br />
Fig. 4.16b, with overlapping realized niches in a single<br />
dimension.<br />
The second experiment (Crombie, 1947) also concerns<br />
two species <strong>of</strong> flour beetle: T. confusum <strong>and</strong><br />
Oryzaephilus surinamensis. Both species can maintain<br />
Table 4.4 Results from the work <strong>of</strong> Park (1954), see text.<br />
monospecific populations under a variety <strong>of</strong> environmental<br />
conditions in laboratory cultures <strong>of</strong> ordinary<br />
flour (Fig. 4.16~). In mixed culture <strong>of</strong> this type, however,<br />
T. confusum always eliminates 0. surinamensis;<br />
only T. confusum has a realized niche (Fig. 4.16d). In<br />
such circumstances, T. confisum has a higher rate <strong>of</strong><br />
reproduction <strong>and</strong> survival, <strong>and</strong> is also more effective in<br />
its destruction <strong>of</strong> pre-adult individuals. (Both species<br />
exhibit this reciprocal predation making it a '- - ' <strong>and</strong><br />
therefore competitive interaction.) However, if an extra<br />
dimension is added to the environment, namely 'space'<br />
(in the form <strong>of</strong> small glass tubes which are available to<br />
0. surinamensis but too small to be accessible to T.<br />
confusum), then 0. surinamensis gains added protection<br />
against predation <strong>and</strong> there is stable coexistence. Both<br />
species now have realized niches (Fig. 4.16e).<br />
The st<strong>and</strong>ard interpretation <strong>of</strong> experiments like<br />
these has been elevated to the status <strong>of</strong> a principle: the<br />
so-called 'Competitive Exclusion Principle'. This<br />
merely recasts, in terms <strong>of</strong> niches, what has already<br />
been hinted at in granivorous ants <strong>and</strong> certain plants:<br />
if there is no differentiation between the realized<br />
niches <strong>of</strong> two competing species, or if such diflerentiation<br />
is precluded by the limitations <strong>of</strong> the habitat, then one<br />
species will eliminate or exclude the other. (As the<br />
experiments described above show, such lack <strong>of</strong><br />
differentiation is <strong>of</strong>ten expressed as the total nonexistence<br />
<strong>of</strong> the realized niche <strong>of</strong> one <strong>of</strong> the species.)<br />
Conversely, when differentiation <strong>of</strong> realized niches is<br />
allowed by the habitat, coexistence <strong>of</strong> competitors is<br />
possible.<br />
4.7 Competitive exclusion in the field<br />
Laboratory habitats tend to differ from field habitats in<br />
having fewer dimensions, <strong>and</strong> narrower ranges <strong>of</strong><br />
those dimensions that they do have. It is likely, therefore,<br />
that, in the laboratory, habitat will frequently<br />
preclude niche differentiation, forcing potential coexistors<br />
to compete in a way that leads to the elimination<br />
<strong>of</strong> one <strong>of</strong> them. For this reason, field evidence <strong>of</strong><br />
competitive exclusion is particularly valuable.<br />
Connell(1961) produced such evidence, working in<br />
Scotl<strong>and</strong> with two species <strong>of</strong> barnacle: Chthamalus<br />
stellatus <strong>and</strong> Balanus balanoides. Adult Chthamalus
CHAPTER 4: INTERSPECIFIC COMPETITION 93<br />
Fig 4.16 (a,b) Indicate, respectively, the fundamental <strong>and</strong><br />
realized niches <strong>of</strong> the flour beetles Tribolium confusum <strong>and</strong><br />
T. castaneum in relationto climate. (Based on the data <strong>of</strong><br />
Park, 1954.) (c,d) Indicate, respectively, the fundamental<br />
<strong>and</strong> realized niches <strong>of</strong> the flour beetles Oryzaephilus<br />
generally occur in an intertidal zone which is above<br />
that <strong>of</strong> adult Balanus. Yet young Chthamalus do settle<br />
in the Balanus zone, so that their subsequent disappearance<br />
suggests either that Balanus individuals exclude<br />
them, or that they are simply unable to live<br />
there. Connell sought to distinguish between these<br />
alternatives by monitoring the survival <strong>of</strong> young<br />
Chthamalus in the Balanus zone, taking successive<br />
censuses <strong>of</strong> mapped individuals over the period <strong>of</strong> 1<br />
year. Most important <strong>of</strong> all, he ensured at some <strong>of</strong> his<br />
sites that the Chthamalus individuals were kept free<br />
from contact with Balanus. In other words, he carried<br />
out a 'removal experiment' allowing him to compare<br />
the responses <strong>of</strong> Chthamalus in the presence or ab-<br />
surinamensis <strong>and</strong> Tribolium confusum in relation to food,<br />
while (e) indicates their realized niches when another niche<br />
dimension, space, is added. (Based on the data <strong>of</strong> Crombie,<br />
1947.) For further discussion, see text.<br />
sence <strong>of</strong> Balanus. In contrast with the normal pattern,<br />
Chthamalus in the absence <strong>of</strong> Balanus survived very<br />
well (Fig. 4.17). Thus, it seemed that competition from<br />
Balanus, rather than increased submergence time, was<br />
the usual cause <strong>of</strong> Chthamalus mortality. This was<br />
confirmed by direct observation. Balanus smothered,<br />
undercut or crushed Chthamalus, <strong>and</strong> the greatest<br />
Chthamalus mortality occurred during the seasons <strong>of</strong><br />
most rapid Balanus growth. Moreover, the few Chthamalus<br />
individuals that survived a year <strong>of</strong> Balanus<br />
crowding were much smaller than uncrowded ones<br />
showing, since smaller barnacles produces fewer <strong>of</strong>fspring,<br />
that interspecific competition was also reducing<br />
fecundity. It is clear, then, that the fundamental
94 PART 2: INTERSPECIFIC INTERACTIONS<br />
Fig. 4.17 The intertidal distribution<br />
<strong>of</strong> adults <strong>and</strong> newly settled larvae <strong>of</strong><br />
Balanus balanoides <strong>and</strong> Chthamalus<br />
stellatus, with a diagrammatic<br />
representation <strong>of</strong> the relative effects<br />
<strong>of</strong> desiccation <strong>and</strong> competition.<br />
Zones are indicated to the left; from<br />
(mean high water-spring) (MHWS)<br />
down to (mean low water-spring)<br />
(MLWS). (After Connell, 1961 .)<br />
niches <strong>of</strong> both species extend down into the lower<br />
levels <strong>of</strong> the 'barnacle belt'; but interspecific competition<br />
from Balanus excludes Chthamalus from these<br />
levels, restricting its realized niche to the upper zones<br />
in which it can survive by virtue <strong>of</strong> its comparatively<br />
high resistance to desiccation. It is also clear that<br />
competition is markedly 'one-sided' in the lower<br />
zones. Yet Balanus must expend some <strong>of</strong> its energy <strong>and</strong><br />
resources in the process <strong>of</strong> smothering, undercutting<br />
<strong>and</strong> crushing invading Chthamalus, <strong>and</strong> the two species<br />
do undoubtedly compete for the same space. This<br />
is, therefore, an example <strong>of</strong> interspecific competition<br />
bearing a superficial resemblance to amensalism.<br />
Another example <strong>of</strong> competitive exclusion in the<br />
field is provided by the work <strong>of</strong> Inouye (1978) on two<br />
species <strong>of</strong> bumble bee: Bombus appositus <strong>and</strong> B. flavifrons.<br />
In the Colorado Rocky Mountains, B. appositus<br />
forages primarily from larkspur, Delphinium barbeyi<br />
<strong>and</strong> B. flavifvons from monkshood, Aconitum columbianum.<br />
When Inouye temporarily removed one or<br />
other <strong>of</strong> the bee species, however, the remaining<br />
species quickly increased its utilization <strong>of</strong> its less-<br />
preferred flower. Moreover, it visited more <strong>of</strong> these<br />
flowers than usual during each stay in a patch (such<br />
increased stay-times being a recognized indication<br />
that the forager is being more successful in the patch).<br />
Thus, the fundamental niches <strong>of</strong> both bee species<br />
clearly include both species <strong>of</strong> flower; <strong>and</strong>, since it is<br />
the presence <strong>of</strong> one bee species that restricts the<br />
realized niche <strong>of</strong> the other, reciprocal competitive<br />
exclusion is strongly suggested. The probable mechanism<br />
is as follows: B. appositus (longer proboscis) is<br />
better adapted to forage from larkspur (long corolla<br />
tube) than B. flavifrons, but when either bee species is<br />
alone the difference is sufficiently slight for both<br />
flowers to be valuable sources <strong>of</strong> nectar. When both<br />
bee species are present, however, B. appositus depletes<br />
the nectar in larkspur flowers to a level which makes<br />
them unattractive to B. flavifrons (with its shorter<br />
proboscis). As a consequence, B. flavifrons concentrates<br />
on monkshood, depleting the nectar there to a<br />
level which makes them significantly less attractive (in<br />
cost-benefit terms) to B. appositus. The two bee species<br />
are, therefore, attracted primarily to different flowers,
CHAPTER 4: INTERSPECIFIC COMPETITION 95<br />
<strong>and</strong> they forage accordingly. This results in reciprocal<br />
competitive exclusion.<br />
The Balanus-Chthamalus interaction <strong>and</strong> Inouye's<br />
Bombus study are excellent illustrations <strong>of</strong> the two<br />
contrasting types <strong>of</strong> interspecific competition (Park,<br />
1954). The aggressive competition by which Balanus<br />
excludes Chthamalus in their joint pursuit <strong>of</strong> limited<br />
space is termed interference competition; whereas the<br />
reciprocal exclusion <strong>of</strong> the two Bombus species, resulting<br />
from the depletion <strong>of</strong> a resource by one species to<br />
a level which makes it essentially valueless to the<br />
other species, is termed exploitation competition. Thus,<br />
with interference there is no consumption <strong>of</strong> a limited<br />
resource, whereas with exploitation there invariably<br />
is. (Note that the interferencelexploitation dichotomy<br />
is somewhat similar to that between scramble <strong>and</strong><br />
contest (section 2.4), in that contest always involves<br />
interference, while scramble usually involves only<br />
exploitation. Note, however, that interference <strong>and</strong><br />
exploitation have none <strong>of</strong> the extreme threshold or<br />
all-or-none characteristics associated with scramble<br />
<strong>and</strong> contest.)<br />
These two field studies are also particularly good<br />
examples <strong>of</strong> competitive exclusion because they are<br />
the results <strong>of</strong> experimental manipulations; the exclusion<br />
<strong>of</strong> Glycine by Panicum in the absence <strong>of</strong> Rhizobium<br />
(section 4.4.1) was equally persuasive. But<br />
evidence is much more commonly circumstantial.<br />
Remember, for instance, that amongst the larger<br />
species <strong>of</strong> Davidson's granivorous ants there was<br />
never coexistence between species that shared both a<br />
size <strong>and</strong> a foraging strategy, i.e. species with apparently<br />
very similar realized niches. Providing the number<br />
<strong>of</strong> CO-occurrences expected by mere coincidence is<br />
much greater than the number observed, reciprocal<br />
competitive exclusion is a very plausible explanation in<br />
such cases; but it can never be more than a plausible<br />
explanation when reliance is placed solely on observational<br />
data.<br />
4.8 Competitive release<br />
A class <strong>of</strong> evidence lying between simple observation<br />
<strong>and</strong> experimental manipulation is represented by<br />
observations <strong>of</strong> what is known as 'competitive re-<br />
lease'. Some <strong>of</strong> the species in the above examples <strong>of</strong><br />
exclusion show this phenomenon in the special context<br />
<strong>of</strong> an experimental manipulation (exp<strong>and</strong>ing their<br />
'range' when a competitor is removed); but the term<br />
competitive release is more commonly applied to the<br />
results <strong>of</strong> natural experiments, as in the following<br />
example.<br />
The New Guinea archipelago comprises one large,<br />
several moderately sized <strong>and</strong> very many small isl<strong>and</strong>s.<br />
Species distribution on isl<strong>and</strong>s has been extensively<br />
studied <strong>and</strong> analysed (see for instance MacArthur,<br />
1972); but for our present purposes we need note only<br />
that in the New Guinea region, as elsewhere, small<br />
isl<strong>and</strong>s tend to lack species which are present on large<br />
isl<strong>and</strong>s <strong>and</strong> on the mainl<strong>and</strong>. One example <strong>of</strong> this<br />
concerns ground doves (Diamond, 1975). As Fig. 4.18<br />
illustrates, there are three similar species <strong>of</strong> ground<br />
dove on New Guinea itself, <strong>and</strong> moving progressively<br />
inl<strong>and</strong> from the coast one encounters them in<br />
sequence: Chalcophaps indica in the coastal scmb, C.<br />
stephani in the light or second-growth forest, <strong>and</strong><br />
Gallicolumba ruJigula in the rainforest. On the isl<strong>and</strong> <strong>of</strong><br />
Bagabag, however, where G. rujigula is absent, C.<br />
stephani exp<strong>and</strong>s its range inl<strong>and</strong> into rainforest; <strong>and</strong><br />
on Karkar, Tolokiwa, New Britain, <strong>and</strong> numerous<br />
other isl<strong>and</strong>s where C. indica is also absent, C. stephani<br />
exp<strong>and</strong>s coastwards to occupy the whole habitat<br />
gradient. Conversely, on Espiritu Santo C. indica is the<br />
only species present, <strong>and</strong> it occupies all three habitats.<br />
This, as Diamond (1975) remarks, is a particularly<br />
neat example, but there are many other natural<br />
experiments with similar results. -Direct interspecific<br />
competition has not been positively established, but<br />
since C. stephani <strong>and</strong> C. indica only occupy rainforest in<br />
the absence <strong>of</strong> G. rufigula, C. stephani only occupies<br />
coastal scrub in the absence <strong>of</strong> C. indica, <strong>and</strong> C. indica<br />
only occupies light forest in the absence <strong>of</strong> C. stephani,<br />
the conclusion is more or less unavoidable that there<br />
is competitive exclusion on New Guinea <strong>and</strong> competitive<br />
release elsewhere.<br />
4.9 Coexistence: resource partitioning<br />
We have seen, from both direct <strong>and</strong> circumstantial<br />
evidence, that competitive exclusion can influence the
96 PART 2: INTERSPECIFIC INTERACTIONS<br />
Fig. 4.18 Habitats occupied by three<br />
species <strong>of</strong> ground doves on various<br />
isl<strong>and</strong>s: Chalcophaps indica (vertical<br />
bars), Chalcophaps stephani (solid<br />
shading) <strong>and</strong> Gallicolumba rufigula<br />
(diagonal bars). (After Diamond,<br />
1975.)<br />
range <strong>and</strong> distribution <strong>of</strong> species. We return now to<br />
what is, in a sense, the reverse question: when do<br />
similar or competing species coexist?<br />
Vance (1972a) studied competition <strong>and</strong> the mechanism<br />
<strong>of</strong> coexistence in three sympatric species <strong>of</strong><br />
intertidal hermit crabs from the San Juan Isl<strong>and</strong>s <strong>of</strong><br />
Washington State: Pagurus hirsutiusculus, P. granosimanus<br />
<strong>and</strong> P. beringanus. The first priority was to<br />
confirm that competition was occurring. These hermit<br />
crabs are generalized omnivorous feeders <strong>and</strong> food is<br />
apparently abundant throughout the year: a priori, the<br />
most likely limiting resource was the empty gastropod<br />
shells which the crabs inhabit. Vance chose an experimental<br />
<strong>and</strong> a control site, <strong>and</strong> to the former he added<br />
1000 marked, appropriately sized shells once per<br />
month for 1 year. He concentrated on P. hirsutiusculus<br />
<strong>and</strong> estimated densities at both sites at the beginning<br />
<strong>and</strong> end <strong>of</strong> the year, noting separately (at the experimental<br />
site) the numbers in marked <strong>and</strong> unmarked<br />
shells. Despite the fact that many <strong>of</strong> the empty shells<br />
were removed by strong currents, there was a significant<br />
increase in total numbers <strong>of</strong> crabs at the experimental<br />
site. However, there was no such increase at<br />
the control site, nor in the unmarked shells at the<br />
experimental site. Empty shells are obviously a limited<br />
resource for P. hirsutiusculus. To establish the generality<br />
<strong>of</strong> shell limitation, Vance gathered data on the size<br />
distributions <strong>of</strong> the three species <strong>of</strong> crabs, <strong>of</strong> the shells<br />
occupied by them, <strong>and</strong> <strong>of</strong> unoccupied shells; <strong>and</strong> he<br />
compared these data with the preferred shell sizes <strong>of</strong><br />
the crabs, determined in preference experiments.<br />
Except for small size-classes, empty shells were rare,
CHAPTER 4: INTERSPECIFIC COMPETITION 97<br />
<strong>and</strong> all but small crabs <strong>of</strong> the three species occupied<br />
shells which were smaller than their preferred size.<br />
Thus, it appears that empty shells constitute for these<br />
three species <strong>of</strong> hermit crab a common, necessary <strong>and</strong><br />
limiting resource for which they compete.<br />
Vance went on to examine the mechanism <strong>of</strong> coexistence<br />
<strong>of</strong> these three species. He found, first <strong>of</strong> all,<br />
that there was partitioning <strong>of</strong> the resource: P. hirsutiusculus<br />
prefer short-spired light shells, whereas both<br />
P. beringanus <strong>and</strong> P. granosirnanus prefer relatively<br />
taller <strong>and</strong> heavier shells. He also found that there was<br />
partitioning <strong>of</strong> the habitat: P. hirsutiusculus predominates<br />
in the upper intertidal <strong>and</strong> amongst Hedophyllurn<br />
sessile, a brown alga living on horizonal rock faces in<br />
the lower intertidal; Pagurus beringanus predominates<br />
in tide-pools in the lower intertidal; <strong>and</strong> P. granosirnanus<br />
predominates under large loose stones <strong>and</strong> in<br />
shallow tide-pools <strong>of</strong> the mid-intertidal. Thus, there is<br />
differentiation amongst the realized niches <strong>of</strong> the three<br />
species, allowing them to compete <strong>and</strong> yet coexist.<br />
The mode <strong>of</strong> competition between these species<br />
appears, essentially, to be interference. Shell occupancy<br />
is determined by intra- <strong>and</strong> interspecific<br />
fighting: crabs in less-preferred shells attempting to<br />
displace crabs in more-preferred shells, the loser<br />
taking the less-preferred shell (Vance, 1972b). We<br />
have seen that the outcome <strong>of</strong> such interspecific<br />
encounters is determined to some extent by resource<br />
partitioning on the basis <strong>of</strong> shell shape <strong>and</strong> weight.<br />
However, the basic resource-empty shells-is also<br />
divisible into 'shells-amongst-brown-algae', 'shells-inshallow-tide-pools'<br />
<strong>and</strong> so on; <strong>and</strong> each species is<br />
apparently specialized in winning fights in a particular<br />
area. Thus, what we have called 'habitat partitioning'<br />
could also be considered as resource partitioning.<br />
Resource partitioning is, therefore, the means by<br />
which these three competitors coexist. As Table 4.5<br />
shows, moreover, both types <strong>of</strong> resource partitioning<br />
are necessary for coexistence. P. beringanus <strong>and</strong> P.<br />
granosirnanus are well separated by habitat, but P.<br />
hirsutiusculus is only truly separated from the other<br />
two in shells within its own preference range.<br />
We have obviously met other, similar examples<br />
already, though in a slightly different context. Bornbus<br />
appositus <strong>and</strong> B. Jlavijirons partition the nectar resource<br />
on the basis <strong>of</strong> corolla length: they are adapted to do so<br />
by differences in proboscis length. Balanus balanoides<br />
<strong>and</strong> Chtharnalus stellatus partition the space resource<br />
on the basis <strong>of</strong> intertidal zone: Balanus is adapted to<br />
physically oust its competitor from the lower zones<br />
<strong>and</strong> Chtharnalus to resist desiccation in the higher<br />
zone. Glycine <strong>and</strong> Panicurn partition the 'total nitrogen'<br />
resource: Glycine is adapted to utilize free nitrogen by<br />
its intimate association with Rhizobiurn. Finally,<br />
granivorous ants partition the seed resource on the<br />
basis <strong>of</strong> the size, density <strong>and</strong> microdistribution <strong>of</strong> the<br />
seeds: they are adapted to do so by differences in their<br />
own size <strong>and</strong> in foraging strategy. In all these cases the<br />
basic pattern is the same: competing species appear to<br />
coexist as a result <strong>of</strong> resource partitioning-in other<br />
words, by virtue <strong>of</strong> the differentiation <strong>of</strong> their realized<br />
niches. Moreover, since the same examples have<br />
served to illustrate both phenomena, it is clear that<br />
resource partitioning <strong>and</strong> competitive exclusion are<br />
Table 4.5 Hermit crabs occupying Littorina sitkana shells (which fall in the Pagurus hirsutiusculus preference range) <strong>and</strong><br />
Searlesia dira shells (which fall in the Pagurus beringanus-P. granosimanus perference range) collected from various physical<br />
habitats at a single site. (After Vance, 1972a.)
98 PART 2: INTERSPECIFIC INTERACTIONS<br />
<strong>of</strong>ten, though not always, alternative aspects <strong>of</strong> the<br />
same process. Competitive exclusion between species<br />
from portions <strong>of</strong> their fundamental niches leads to<br />
differentiation <strong>of</strong> their realized niches.<br />
In fact, there are two further patterns which have<br />
emerged from the examples we have considered. The<br />
species pairs-bees, barnacles <strong>and</strong> plants-partitioned<br />
their resource along a single dimension: corolla<br />
length, intertidal zone <strong>and</strong> total nitrogen, respectively.<br />
Conversely, the three species <strong>of</strong> hermit crab required<br />
at least two dimensions: shell shape <strong>and</strong> weight, <strong>and</strong><br />
shell location; while the guild <strong>of</strong> granivorous ants<br />
partitioned resources on the basis <strong>of</strong> seed size <strong>and</strong> seed<br />
density/distribution, <strong>and</strong> even these two dimensions<br />
were apparently not enough to account for the coexistence<br />
<strong>of</strong> the smaller species. There appears, in<br />
other words, to be a correlation between the number<br />
<strong>of</strong> species in a guild <strong>and</strong> the number <strong>of</strong> niche<br />
dimensions involved in the partitioning <strong>of</strong> the resource.<br />
Schoener (1974) reviewed the literature on<br />
resource partitioning, <strong>and</strong> found that this correlation<br />
was, indeed, statistically significant. Interestingly, this<br />
parallels the results <strong>of</strong> theoretical investigations by<br />
MacArthur (1 965) <strong>and</strong> Levins (1 968).<br />
In addition, Schoener (1974), like several others,<br />
pointed to the niche complementarity frequently involved<br />
in resource partitioning. As illustrated by the<br />
examples <strong>of</strong> hermit crabs <strong>and</strong>, more especially, Davidson's<br />
ants, species which are not differentiated along<br />
one niche dimension tend to be separated along another.<br />
Realized niches are, therefore, fairly evenly distributed<br />
in multidimensional space, <strong>and</strong> species<br />
compete simultaneously with several species in several<br />
dimensions (called difuse competition by MacArthur,<br />
1972).<br />
Finally, however, it should be clear that we have<br />
avoided the most important aspect <strong>of</strong> competitive<br />
exclusion. We have seen that when there is no niche<br />
differentiation, competitive exclusion occurs; <strong>and</strong> we<br />
have seen that when competitors coexist there is<br />
resource partitioning. But we have ignored a much<br />
more pr<strong>of</strong>ound question. How much niche differentiation<br />
is necessary for the coexistence <strong>of</strong> competitors?<br />
We return to this question in section 4.15.<br />
4.1 0 Character displacement<br />
A particular type <strong>of</strong> resource partitioning, allowing<br />
competitors to coexist, is known as character displacement.<br />
It involves the modification <strong>of</strong> the morphological<br />
form <strong>of</strong> a species as a result <strong>of</strong> the presence <strong>of</strong><br />
interspecific competitors. Fenchel (1975) investigated<br />
the coexistence <strong>of</strong> hydrobiid mud snails in Limfiord,<br />
Denmark, <strong>and</strong> paid particular attention to two species:<br />
Hydrobia ventrosa <strong>and</strong> H. ulvae. These deposit feeders<br />
seem to ingest their substrate indiscriminately <strong>and</strong><br />
utilize the attached micro-organisms, <strong>and</strong> Fenchel<br />
found that for both species there is a single linear<br />
relationship between shell length <strong>and</strong> food particle<br />
size. Some <strong>of</strong> Fenchel's results are illustrated in<br />
Fig. 4.19. It is clear from this figure that when the two<br />
species live alone (which they do in a range <strong>of</strong><br />
habitats), their sizes are more or less identical, as are<br />
the sizes <strong>of</strong> their food particles. When the two species<br />
coexist, however, there is character displacement. H.<br />
ulvae is larger, H. ventrosa is smaller, <strong>and</strong> the sizes <strong>of</strong><br />
their food particles are similarly modified. The evidence<br />
for interspecific competition is not direct, but<br />
there is no simple alternative to the suggestion that the<br />
character displacement allows the partitioning <strong>of</strong> a<br />
potentially limiting resource, <strong>and</strong> thus allows the<br />
coexistence <strong>of</strong> two competitors.<br />
A similar situation, <strong>of</strong> course, was that desribed<br />
previously for the ant Veromessor perg<strong>and</strong>ei (Davidson,<br />
1978), which shows character (size) displacment in<br />
response to its competitive milieu: the number <strong>and</strong><br />
nature <strong>of</strong> its interspecific competitors. Thus, we can<br />
note that, in our newly defined terms, Davidson's ants<br />
show competitive exclusion, coexistence through differentiation<br />
<strong>of</strong> realized niches (resource partitioning)<br />
<strong>and</strong> character diplacement.<br />
4.1 l Competition: its avoidance or its<br />
non-existence?<br />
We have seen that species can coexist when, as<br />
competitors, they partition resurces between them;<br />
<strong>and</strong> also that such partitioning may be achieved, in<br />
special cases, by character displacement. But species<br />
may also coexist simply because they do not compete.
CHAPTER 4: INTERSPECIFIC COMPETITION 99<br />
Fig. 4.19 Coexistence through character displacement.<br />
(a) Average lengths (plus st<strong>and</strong>ard deviations) <strong>of</strong> Hydrobia<br />
ulvae (open circles) <strong>and</strong> H. ventrosa (closed circles) at a<br />
variety <strong>of</strong> sites at which they coexist or live alone. (b)<br />
Distributions <strong>of</strong> food particle size <strong>of</strong> the same species at<br />
typical sites at which they coexist or live alone. (After<br />
Fenchel, 1975.)<br />
We have tried, until now, to include only those<br />
examples in which competition has been positively<br />
established. Suppose, however, that Inouye, instead <strong>of</strong><br />
carrying out his experimental manipulations, had<br />
observed simply that two different species <strong>of</strong> bee<br />
forage from two different species <strong>of</strong> flower, <strong>and</strong> that<br />
the bee species with the longer proboscis foraged from<br />
the flower species with the longer corolla tube. The<br />
explanation that has been suggested, involving competition,<br />
competitive exclusion <strong>and</strong> resource partitioning,<br />
would certainly have been plausible; but there are<br />
two alternative explanations. It might have been<br />
suggested that each bee species has become so well<br />
adapted to its own flower that there was no (even<br />
potentially) shared resource, <strong>and</strong> therefore no interspecific<br />
competition. This explanation implies the<br />
existence <strong>of</strong> interspecific competition in the past, but<br />
proposes, in addition, that selection for resource<br />
partitioning has been so strong <strong>and</strong> so longst<strong>and</strong>ing<br />
that the partitioning is now complete <strong>and</strong> irreversible.<br />
It might also have been suggested, however, that the<br />
difference in proboscis length between Bombus appositus<br />
<strong>and</strong> B. jlavifrans merely reflects the fact that they<br />
are two different species, <strong>and</strong> has nothing to do with<br />
competition. There would, therefore, have been a real<br />
problem <strong>of</strong> interpretation if Inouye had relied solely on<br />
observational data; <strong>and</strong> to illustrate this problem we<br />
can consider an example <strong>of</strong> the sort <strong>of</strong> information<br />
that is normally described as 'field evidence <strong>of</strong> interspecific<br />
competition'.<br />
Lack (1971) described the coexistence <strong>of</strong> five specials<br />
<strong>of</strong> tit in English broadleaved woodl<strong>and</strong>s: the blue<br />
tit (Parus caeruleus), the great tit (P. major), the marsh tit
100 PART 2: INTERSPECIFIC INTERACTIONS<br />
(P. palustris), the willow tit (P. montanus) <strong>and</strong> the coal<br />
tit (P. ater). Four <strong>of</strong> these congeneric species weigh<br />
between 9.3 <strong>and</strong> 11.4 g on average (great tit 20 g); all<br />
have short beaks <strong>and</strong> hunt for food chiefly on leaves<br />
<strong>and</strong> twigs, but at times on the ground; all eat insects<br />
throughout the year, <strong>and</strong> also seeds in winter; <strong>and</strong> all<br />
nest in holes, normally in trees. Nevertheless, in<br />
Marley Wood, Oxford, all five species breed <strong>and</strong> the<br />
blue, great <strong>and</strong> marsh tits are common.<br />
All five species feed their young on leaf-eating<br />
caterpillars, <strong>and</strong> all except the willow tit feed on<br />
beechmast in the winters when it is plentiful; but both<br />
<strong>of</strong> these foods are temporarily so abundant that<br />
competition for them is most unlikely. The small blue<br />
tit feeds mainly on oak trees throughout the year,<br />
concentrating on the smaller twigs <strong>and</strong> leaves <strong>of</strong> the<br />
canopy to which it is suited by its agility. It also strips<br />
bark to feed on the insects underneath, <strong>and</strong> generally<br />
takes insects less than 2 mm in length. It eats hardly<br />
any seeds, except those <strong>of</strong> birch which it takes from<br />
the tree itself. The heavy great tit, by contrast, feeds<br />
mainly on the ground, especially in winter. Most <strong>of</strong> the<br />
insects it takes exceed 6 mm in length; it eats more<br />
acorns, sweet chestnut <strong>and</strong> wood sorrel seeds than the<br />
other species; <strong>and</strong> it is the only species to take hazel<br />
nuts. The marsh tit has a feeding station intermediate<br />
between the other two common species: in the shrub<br />
layer, in large trees on twigs <strong>and</strong> branches below 6 m,<br />
or in herbage. It is also intermediate in size between<br />
the other two species, <strong>and</strong> generally takes insects<br />
between 3 <strong>and</strong> 4 mm in length. In addition it takes the<br />
fruits <strong>and</strong> seeds <strong>of</strong> burdock, spindle, honeysuckle,<br />
violet <strong>and</strong> wood sorrel. The coal tit is another small<br />
species feeding on oak, but also, later in the winter, on<br />
ash. It generally takes insects which are less than<br />
2 mm long, <strong>and</strong> which are indeed shorter, on average,<br />
than those taken by the blue tit. Moreover, unlike the<br />
blue tit, the coal tit feeds mainly from branches rather<br />
than in the canopy. Finally, the willow tit is most like<br />
the marsh tit, feeding on birch <strong>and</strong>, to a lesser extent,<br />
elder, <strong>and</strong> in herbage. Unlike the marsh tit, however,<br />
the willow tit avoids oak <strong>and</strong> takes very few seeds.<br />
As Lack concluded, the species are separated from<br />
each other at most times <strong>of</strong> the year by their feeding<br />
station, the size <strong>of</strong> their insect prey <strong>and</strong> the hardness<br />
<strong>of</strong> the seeds they take; <strong>and</strong> this separation is associated<br />
with differences in overall size, <strong>and</strong> in the size <strong>and</strong><br />
shape <strong>of</strong> the beaks. Yet, as we have seen, there are<br />
three possible interpretations <strong>of</strong> this situation. The<br />
first two ('current competition' <strong>and</strong> 'competition in the<br />
past') are based on the assumption that the differences<br />
reflect the partitioning by the tits <strong>of</strong> a potentially<br />
limited resource; but the third makes no such assumption.<br />
It states simply that the five species, in the course<br />
<strong>of</strong> their evolution, have adapted to their environment<br />
in different ways; but in ways that have nothing to do<br />
with interspecific competition. And on the basis <strong>of</strong> the<br />
evidence presented, it is impossible to reject this interpretation.<br />
It has not been shown that the birds would<br />
exp<strong>and</strong> their niches in the absence <strong>of</strong> the other<br />
species, <strong>and</strong> it has not even been shown that food is a<br />
limited resource. There is, therefore, no direct evidence<br />
<strong>of</strong> competition, <strong>and</strong> no overriding reason for<br />
involving it in our interpretation.<br />
Nevertheless, the possibility <strong>of</strong> the first two interpretations<br />
does remain. We have seen in several<br />
examples-ants, barnacles, bumble bees, etc.-that<br />
competing species can coexist by resource partitioning,<br />
<strong>and</strong> can retain the ability to exp<strong>and</strong> their range in<br />
the absence <strong>of</strong> their competitor. Thus, it may be the<br />
case that this is also the correct interpretation <strong>of</strong> the<br />
tits' ecology, but that the appropriate experimental<br />
manipulations have simply not been carried out.<br />
Moreover, we have also seen-e.g. in the examples<br />
<strong>of</strong> character displacement-that species can evolve<br />
morphological adaptations which allow them (largely<br />
if not totally) to avoid competition. This (second)<br />
interpretation, like the third interpretation (above)<br />
denies the existence <strong>of</strong> current interspecific competition,<br />
but unlike the third interpretation it invokes<br />
interspecific competition as the evolutionary drivingforce<br />
behind the differences currently observed.<br />
Indeed, the first <strong>and</strong> second interpretations are<br />
based on alternative outcomes <strong>of</strong> a shared evolutionary<br />
process, which undoubtedly does pertain in some<br />
cases. The process occurs as follows. Natural selection<br />
favours the survival <strong>and</strong> reproduction <strong>of</strong> those individuals<br />
with the greatest fitness, but interspecific competition<br />
reduces fitness. Individuals that avoid<br />
interspecific competition will therefore evolve, <strong>and</strong>
CHAPTER 4: INTERSPECIFIC COMPETITION 101<br />
interspecific competition is avoided by resource partitioning.<br />
Evolution <strong>of</strong> a realized niche which is too<br />
small, however, will increase intraspecific competition,<br />
<strong>and</strong> this, too, reduces fitness. We can, therefore,<br />
expect each species to evolve towards a form in which<br />
inter- <strong>and</strong> intraspecific competition are optimally<br />
<strong>of</strong>fset. Sometimes this will evolve relatively flexible<br />
resource partitioning (first interpretation); sometimes<br />
the partitioning will be inflexible (second interpretation).<br />
Sometimes there will be a lessening <strong>of</strong> interspecific<br />
competition; sometimes its total avoidance. Yet in<br />
either case, <strong>and</strong> with either interpretation, interspecific<br />
competition will be <strong>of</strong> paramount importance.<br />
On the available evidence, however, it is impossible<br />
to determine whether these tit data indicate interspecific<br />
competition (first interpretation), its evolutionary<br />
avoidance (second interpretation) or its total nonexistence,<br />
now <strong>and</strong> in the past (third interpretation);<br />
<strong>and</strong> this would be true <strong>of</strong> almost all examples <strong>of</strong><br />
apparent interspecific competition in the field. There<br />
are undoubtedly cases <strong>of</strong> current resource partitioning<br />
amongst competitors; <strong>and</strong> there are undoubtedly<br />
cases in which species' ecologies have been moulded<br />
by interspecific competition in the past. But differences<br />
between species are not, in themselves, indications<br />
<strong>of</strong> the ways in which those species coexist; <strong>and</strong><br />
interspecific competition cannot be studied by the<br />
mere documentation <strong>of</strong> these interspecific differences.<br />
Note, finally, that while the first interpretation is<br />
based on a ' - - ' interaction, the second interpretation<br />
assumes that the interaction is essential '00'. In other<br />
words, it is assumed that evolution, acting to avoid<br />
'minuses', converts them to 'zeros'; <strong>and</strong> this is probably<br />
also the basis <strong>of</strong> most cases <strong>of</strong> amensalism ( - 0).<br />
The plant species that produces a toxic metabolite<br />
causing growth reduction in a second species presumably<br />
does so as an evolutionary response to the harmful,<br />
competitive effects that the second species had on<br />
its growth in the past. At that time the interaction<br />
would have been competitive: ' - - ': Now, however,<br />
evolution has led to the production <strong>of</strong> toxin by the<br />
aggressive species which occurs whether or not potential<br />
competitors are present. The aggressive species is,<br />
therefore, unaffected by these other species, <strong>and</strong> the<br />
interaction is amensal. Evolution has, in this case,<br />
converted only one <strong>of</strong> the minuses <strong>of</strong> a ' - - ' interaction<br />
into a zero. In other cases (as in the second<br />
interpretation, above) it converts both.<br />
4.1 2 Competition <strong>and</strong> coexistence<br />
in plants<br />
The theory <strong>of</strong> the niche <strong>and</strong> the competitive exclusion<br />
principle have their origins firmly rooted in zoological<br />
study, <strong>and</strong> it is intuitively less easy to see how niche<br />
differentiation can occur in autotrophic plants, when<br />
all have essentially the same basic growth requirements<br />
(light, water <strong>and</strong> nutrients). It might be imagined<br />
that plants have evolved specializations to<br />
capture energy for photosynthesis from different<br />
wavelengths <strong>of</strong> light, or that nutrients might be<br />
utilized in unique <strong>and</strong> separate ways; but comparative<br />
physiological studies show that this is not so. Plant<br />
growth requirements ('food') are not usually discrete<br />
packages that can be simply partitioned amongst<br />
competing species. (An important exception to this<br />
however, is nitrogen utilization. The legumes (as we<br />
have seen in section 4.4.1), <strong>and</strong> some other genera<br />
such as Alnus, do not place total reliance on fixed<br />
nitrogen in the soil for growth. Instead, by virtue <strong>of</strong><br />
their symbiotic relationship with nitrogen-fixing<br />
micro-organisms, they utilize free nitrogen from the<br />
air.) Moreover, the very nature <strong>of</strong> the effect <strong>of</strong> limiting<br />
resources on plant growth is complex. Limitation in<br />
water supply resulting from intense root competition,<br />
for instance, will limit leaf growth; but this may<br />
contribute in turn to a reduction in the growth <strong>of</strong> new<br />
roots. Thus, shortage <strong>of</strong> one limiting resource (water)<br />
affects the competitive struggle to obtain both light<br />
<strong>and</strong> water itself. Disentangling the web <strong>of</strong> cause <strong>and</strong><br />
effect experimentally has proved very difficult (reviewed<br />
by Harper, 1977)<br />
In practice, most attempts to explain the coexistence<br />
<strong>of</strong> plant species have rested largely on a demonstration<br />
<strong>of</strong> the fact that potential competitors differ in ways<br />
which might reduce competition. Attention has focused<br />
particularly on differences in life form, differences<br />
in the timing <strong>of</strong> various stages <strong>of</strong> growthparticularly<br />
germination <strong>and</strong> flowering-<strong>and</strong><br />
differences in preferred levels <strong>of</strong> abiotic factors (see
102 PART 2: INTERSPECIFIC INTERACTIONS<br />
Grubb, 1977 <strong>and</strong> Werner, 1979 for reviews). However,<br />
we have seen from the tits in Marley Wood that<br />
such differences, taken alone, are impossible to interpret<br />
with confidence. The conclusions that can be<br />
drawn from such data are severely limited.<br />
Perhaps the most that can be obtained from the<br />
interpretation <strong>of</strong> these differences is illustrated by the<br />
work <strong>of</strong> Werner <strong>and</strong> Platt (1976). They studied six<br />
species <strong>of</strong> golden rod (Solidago) that commonly occur<br />
together both in old hayfields undergoing successional<br />
change, <strong>and</strong> in mature, stable prairie communities in<br />
North America. In both habitats, but particularly in<br />
the prairies, they were able to relate the frequency <strong>of</strong><br />
occurrence <strong>of</strong> each species to the availability <strong>of</strong> soil<br />
moisture (Fig. 4.20): different species appear to 'prefer'<br />
different moisture levels. There is, <strong>of</strong> course, no direct<br />
evidence that interspecific competition is the driving<br />
Fig. 4.20 Coexistence <strong>of</strong> competing plants? The occurrence<br />
<strong>of</strong> six species <strong>of</strong> Solidago in relation to available soil<br />
moisture in a hayfield undergoing succession, <strong>and</strong> in a<br />
mature prairie in North America. Soil moisture percentages<br />
were determined in summer. (From Werner 81 Platt, 1976.)<br />
force behind this arrangement; but the circumstantial<br />
evidence is strengthened in this case by the fact that<br />
the degree <strong>of</strong> separation between species is much<br />
greater in the mature prairies than in the young<br />
hayfield successional habitats. The position taken up<br />
by a species along this environmental gradient is<br />
apparently the one at which it has been most successful<br />
in competition with the others: interspecific competition,<br />
with time, seems to realize the niche <strong>of</strong> each<br />
species.<br />
Intuitively, spatial heterogeneity in resource use by<br />
plants is probably one <strong>of</strong> the most powerful promoters<br />
<strong>of</strong> niche separation <strong>and</strong> coexistence between plants.<br />
Species occupying distinct rooting zones within the<br />
soil may exploit nutrients <strong>and</strong> soil moisture sufficiently<br />
independently <strong>of</strong> one another. This can be seen even<br />
at the genotypic level. Ennos (1985) observed that<br />
genotypes <strong>of</strong> Trifolium repens exhibited different rooting<br />
lengths <strong>and</strong> was able to show that this character was<br />
genetically determined. He selected plants having<br />
either short or long roots <strong>and</strong> compared their performance<br />
in a replacement series. Under artificially<br />
imposed drought conditions the yields <strong>of</strong> aboveground<br />
stolons in 50 : 50 mixtures plantings <strong>of</strong> the<br />
two genotypes significantly exceeded both <strong>of</strong> the<br />
monoculture yields. Bearing in mind the restrictions <strong>of</strong><br />
this form <strong>of</strong> analysis, it does seem that the exploitation<br />
<strong>of</strong> different soil layers may enable coexistence in<br />
plants.<br />
In a few plant examples, however, it is possible to do<br />
more than merely implicate interspecific competition<br />
as an important interaction between coexisting species.<br />
Sharitz <strong>and</strong> McCormick (1973), for instance,<br />
studied the population dynamics <strong>of</strong> pairs <strong>of</strong> annual<br />
plant species (Sedum smallii <strong>and</strong> either Minuartia<br />
uniflora or M. glabra) which dominate the vegetation<br />
growing on granite outcrops in the south-eastern USA.<br />
As Fig. 4.21 shows, there is very strict zonation <strong>of</strong> the<br />
adults <strong>of</strong> the two species associated with the soil depth<br />
around the outcrops; <strong>and</strong> soil depth itself is strongly<br />
correlated with soil moisture. The experimental results<br />
in Fig. 4.21b <strong>and</strong> 4.21c, however, indicate that<br />
this zonation is not simply a reflection <strong>of</strong> the tolerance<br />
ranges <strong>of</strong> the species. In fact, their fundamental niches<br />
cover the same range <strong>of</strong> experimental conditions.
CHAPTER 4: INTERSPECIFIC COMPETITION 103<br />
(W<br />
Sedum smallii<br />
lntraspecific competition<br />
High<br />
Low<br />
Sedum smallii<br />
m- L<br />
o Interspecific competition<br />
+<br />
o Hiah Low<br />
Seedling<br />
Rosette<br />
0 2 4 6 8 10 12 1 4<br />
Flowering<br />
1<br />
Mature<br />
Soil depth (cm)<br />
Minuartia uniflora<br />
(C)<br />
Soil depth (cm)<br />
Minuartia glabra<br />
lntraspecific competition<br />
High<br />
Low<br />
15 f 15 f<br />
100<br />
Seedling<br />
0 Rosette<br />
Flowering<br />
Soil depth (cm)<br />
lnterspecific competition<br />
Soil depth (cm)<br />
Fig. 4.21 (a) The zonation <strong>of</strong> individuals, according to soil<br />
depth, <strong>of</strong> two annual plants Sedum smallii <strong>and</strong> Minuartia<br />
uniJlora at four stages <strong>of</strong> the life cycle. (b,c) The<br />
consequences <strong>of</strong> competitive interaction between Sedum<br />
smallii <strong>and</strong> Minuartia glabra, respectively. For each species<br />
the final density at plant maturity (as a percentage <strong>of</strong> the<br />
initial seed sown) is shown when grown alone <strong>and</strong> with the<br />
other species. The experiment was conducted at three soil<br />
depths <strong>and</strong> three relative moisture levels: S, saturation; FC,<br />
field capacity; D, one-third <strong>of</strong> field capacity. (From Sharitz<br />
& McCormick, 1973.)<br />
Nevertheless, while Sedum is clearly more capable<br />
than Minuartia <strong>of</strong> tolerating the lack <strong>of</strong> moisture at the<br />
low end <strong>of</strong> the range, Minuartia is obviously much less<br />
affected than Sedum by interspecific competition at the<br />
high end. It is apparent, in other words, that interspecific<br />
competition in nature restricts these species to<br />
realized niches (in practice, 'zones') that are significantly<br />
smaller than their fundamental niches. Further<br />
evidence <strong>of</strong> this is provided by the very incomplete<br />
zonation at the seedling stage, prior to any substantial<br />
competitive interaction (Fig. 4.21a). The parallel with<br />
the barnacles in section 4.7 is quite striking.
104 PART 2: INTERSPECIFIC INTERACTIONS<br />
In at least some cases, therefore, plant species<br />
which are potential competitors for a limited resource<br />
can coexist by virtue <strong>of</strong> a differentiation <strong>of</strong> their<br />
realized niches. Yet it must be recognized that there<br />
are very few instances in which this has been positively<br />
established (see Werner, 1979). It is very easy, in<br />
plants, to demonstrate the reductions in fitness which<br />
can result from interspecific competition; but it has<br />
proved very difficult so far to demonstrate the mechanisms<br />
which allow potential competitors to coexist.<br />
There are two reasons for this. Grubb (1977) has<br />
suggested that this difficulty may stem from an<br />
overemphasis on adult plants. Irrespective <strong>of</strong> any<br />
niche differentiation, it is almost impossible for a<br />
seedling <strong>of</strong> one species to outcompete an established<br />
adult <strong>of</strong> another species. The most important competition<br />
between plants, therefore, may be pre-emptive<br />
competition for the regeneration niche, i.e. competition<br />
amongst seedlings to become established in a part <strong>of</strong><br />
the environment which has recently become vacant. It<br />
seems certain that in future, the study <strong>of</strong> pre-emptive<br />
competition will teach us a great deal about the<br />
coexistence in nature <strong>of</strong> competing plants. A very<br />
similar phenomenon, restricted to single species <strong>and</strong><br />
referred to as 'space capture', is discussed in section<br />
6.11.<br />
The second reason is a neglect <strong>of</strong> the fact that<br />
environmental parameters indirectly interact to determine<br />
the intensity <strong>of</strong> competition. Utilization <strong>of</strong> resources<br />
in limited supply may be determined by the<br />
species' response to other (non-limiting) environmental<br />
factors which govern the competitive outcome.<br />
Figure 4.22a portrays the requirements <strong>of</strong> two hypothetical<br />
species for a limiting resource, determined by<br />
an abiotic factor such as temperature or pH. At the<br />
lower part <strong>of</strong> the range, species A, by virtue <strong>of</strong> a lower<br />
requirement for the limiting resource will tend to<br />
outcompete species B. The converse will be true in the<br />
upper part <strong>of</strong> the range. In mid-range, all other factors<br />
being equal, growth is limited to the same extent <strong>and</strong><br />
coexistence occurs. Partial support for this view comes<br />
from a further experiment using the planktonic algal<br />
species Asterionella formosa <strong>and</strong> Synedra ulna (Fig.<br />
4.22b). Over much <strong>of</strong> the temperature range (4-20°C),<br />
Asterionella formosa has the lower requirement for<br />
Fig. 4.22 (a) Competition for one limiting resource in<br />
relation to an abiotic factor. (b) The outcome <strong>of</strong> competition<br />
for silicate for two species <strong>of</strong> planktonic algae over a wide<br />
temperature range. A$, Asterionella formosa; S.U., Synedra<br />
ulna. (Modified from Tilman et al., 1982.)<br />
SiO, <strong>and</strong> outcompetes Synedra ulna, but the reverse is<br />
true above 20°C. Although there is no temperature<br />
range in which both species have the same dem<strong>and</strong><br />
for silicate, we can envisage coexistence if there are<br />
fluctuations in temperature over the range in which<br />
alternative competitive displacement can occur. Indeed,<br />
diurnal temperature fluctuations between 16
CHAPTER 4: INTERSPECIFIC COMPETITION 105<br />
<strong>and</strong> 24°C are very likely in the surface waters <strong>of</strong> the<br />
lakes in which these species live. The only proviso that<br />
we must add in final explanation <strong>of</strong> this mechanism is<br />
that it clearly depends on the time scale over which<br />
population growth responses can occur.<br />
than species 1 has on itself.) We now simply need to<br />
replace N, in the bracket <strong>of</strong> our logistic equation with<br />
a term which signifies: 'N, plus N,-equivalents', i.e.<br />
- = rlN1<br />
dt<br />
K1<br />
4.13 A logistic model <strong>of</strong> or<br />
two-species competition<br />
- =<br />
Having examined what is known about interspecific<br />
rlN1<br />
dt<br />
competition, it will be valuable to turn (as we did with<br />
single-species pop~ations) to some simple models, to<br />
see whether they can improve our undershnding <strong>of</strong> L:<br />
the interaction.<br />
The conventional starting point for such models is<br />
the differential logistic equation (following Lotka, 1925;<br />
We can, <strong>of</strong> course, write a similar equation for species<br />
-<br />
Volterra, 1926). Obviously, therefore, in conforming to This is our basic (Lotka-Volterra) model.<br />
this convention, we will be incorporating into our To describe the properties <strong>of</strong> this model, we must<br />
model all <strong>of</strong> the logistic's shortcomings. Nevertheless, ask the following questions: when (under what ciras<br />
will become apparent below, a useful model can be cumstances) does species 1 increase in numbers?<br />
constructed. When does it decrease? And, when does species 2<br />
The logistic equation:<br />
increase <strong>and</strong> decrease? In order to answer these<br />
questions we construct what are, in essence, the<br />
K-N<br />
equivalents <strong>of</strong> maps. Thus, while in maps there are<br />
= rN (X)<br />
areas <strong>of</strong> l<strong>and</strong> <strong>and</strong> areas <strong>of</strong> sea, with a coastline (neither<br />
contains, within the brackets, a term which is respon- l<strong>and</strong> nor sea) dividing them; in our case we will have<br />
sible for the incorporation <strong>of</strong> intraspecific competition. areas <strong>of</strong> N, (or N,) increase. <strong>and</strong> areas <strong>of</strong> N, (or N,)<br />
We can proceed by replacing this term with one which decrease, with a zero isocline (neither increase nor<br />
incorporates not only intra- but also interspecific com- decrease) dividing them. Moreover, if we begin by<br />
petition. We will denote the numbers <strong>of</strong> our original drawing a zero isocline (coastline), we will know that<br />
species by N, (carrying-capacity, K,; intrinsic rate <strong>of</strong> there is increase (l<strong>and</strong>) on one side <strong>of</strong> it .<strong>and</strong> decrease<br />
increase, r,), <strong>and</strong> those <strong>of</strong> a second species by N,. (sea) on the other. As Fig. 4.25 shows, the axes <strong>of</strong> our<br />
Suppose that, together, 10 individuals <strong>of</strong> species 2 'map' will be N, <strong>and</strong> N,: the bottom left-h<strong>and</strong> corners<br />
have the same competitive, inhibitory effect on species are areas where there are low numbers <strong>of</strong> species 1<br />
1 as does a single species 1 individual. The total <strong>and</strong> 2, <strong>and</strong> the top right-h<strong>and</strong> corners areas where<br />
competitive effect on species 1 (inter- <strong>and</strong> intraspecific) there are high numbers <strong>of</strong> species 1 <strong>and</strong> 2.<br />
will then be equivalent to (N, + {N,/lO)) species 1 In order to draw the NI--isocline we will use the<br />
individuals. We call the constant-1/10 in the present fact that on it dN,/dt = 0, i.e.<br />
case-a coeficient <strong>of</strong> competition, <strong>and</strong> denote it by a,,<br />
since it measures the competitive effect on species 1 <strong>of</strong><br />
) =o.<br />
species 2. In other words, multiplying N, by a,,<br />
converts it to a number <strong>of</strong> W,-equivalents'. (Note that<br />
This is tme for two trivial cases (when rl or are<br />
a,, < l means that species 2 has less inhibitory effect<br />
zero), but also for an important case:<br />
on species 1 than species 1 has on itself, while a,, > 1<br />
means that species 2 has a greater inhibitory effect K, - N, - a12N2 = 0
106 PART 2: INTERSPECIFIC INTERACTIONS<br />
Indeed, the straight line represented by this equation<br />
is our isocline, <strong>and</strong> since it is a straight line we can<br />
draw it by finding two points on it <strong>and</strong> joining them.<br />
Thus when<br />
K1<br />
N1 = 0, N2 = - (point A, Fig. 4.23a)<br />
a12<br />
<strong>and</strong> when<br />
N2=0,N1 =K, (point B, Fig. 4.23a).<br />
The line in Fig. 4.23a is, therefore, the NI-isocline.<br />
Below <strong>and</strong> to the left <strong>of</strong> it, numbers are low, competition<br />
is comparatively weak <strong>and</strong> species 1 increases in<br />
abundance (arrows from left to right, N, on the<br />
horizontal axis); above <strong>and</strong> to the right <strong>of</strong> it, numbers<br />
are high, competition is comparatively strong <strong>and</strong><br />
species 1 decreases in abundance (arrows from right<br />
to left).<br />
Based on an equivalent derivation, Fig. 4.23b has<br />
areas <strong>of</strong> species 2 increase <strong>and</strong> decrease separated by<br />
the (straight) N2-isocline; arrows, like the N2-axis, are<br />
vertical.<br />
All that is required now is to put the N,- <strong>and</strong><br />
N2-isoclines together on a single figure. In so doing, it<br />
should be noted that the arrows in Fig. 4.23 are<br />
actually vectors-with a strength as well as a direction-<strong>and</strong><br />
that, to determine the behaviour <strong>of</strong> a joint<br />
NI-N2 population, the normal rules <strong>of</strong> vector addition<br />
should be applied (see Fig. 4.24). It is clear from<br />
Fig. 4.25 that there are four different ways in which<br />
the two isoclines can be arranged. In Fig. 4.25a <strong>and</strong><br />
4.25b, one isocline lies entirely beyond the other, <strong>and</strong><br />
the vectors indicate that, as a consequence, the species<br />
with the inner isocline becomes extinct, while the<br />
other species attains its own carrying-capacity.<br />
Such situations can be defined by the intercepts <strong>of</strong><br />
the isoclines. In Fig. 4.25a, for instance:<br />
K, > K2a12 <strong>and</strong> K, < K1a2,.<br />
Species 1 exerts more effect on itself than species 2<br />
exerts on it, but also exerts more effect on species 2<br />
than species 2 does on itself. In other words, species 1<br />
is a strong interspecific competitor, species 2 is a weak<br />
interspecific competitor, <strong>and</strong> species 1 drives species 2<br />
to extinction. The situation is reversed in Fig. 4.25b.<br />
Fig. 4.23 (a) The N,-isocline<br />
generated by the Lotka-Volterra<br />
competition equations. Species 1<br />
increases below <strong>and</strong> to the left <strong>of</strong><br />
the isocline (arrows left to right),<br />
<strong>and</strong> decreases above <strong>and</strong> to the<br />
right <strong>of</strong> the isocline (arrows right to<br />
left). (b) The equivalent NZ-isocline.
CHAPTER 4: INTERSPECIFIC COMPETITION 107<br />
In Fig. 4.25~:<br />
K, < K2a12 <strong>and</strong> K, < K1a2,.<br />
Interspecific effects are more important than intraspecific<br />
effects: both species are strong interspecific competitors.<br />
There are two stable points (N, = K,, N, = 0<br />
<strong>and</strong> N2 = K,, N, = 0) <strong>and</strong> an unstable equilibrium<br />
combination <strong>of</strong> N, <strong>and</strong> N,. In other words, one species<br />
always drives the other to extinction, but the precise<br />
outcome depends on the initial densities.<br />
Finally, in Fig. 4.25d:<br />
Fig. 4.24 Vector addition. When species 1 <strong>and</strong> 2 increase in<br />
the manner indicated by the N, <strong>and</strong> N, arrows (vectors),<br />
the joint population increase is given by the vector along<br />
the diagonal <strong>of</strong> the rectangle, generated as shown by the N,<br />
<strong>and</strong> N,-vectors.<br />
K, > K2a2, <strong>and</strong> K, > K1a2,.<br />
Intraspecific effects are now more important than<br />
interspecific effects, both species are weak interspecific<br />
competitors, <strong>and</strong> there is stable coexistence at a<br />
particular, equilibrium combination <strong>of</strong> N, <strong>and</strong> N,.<br />
4.13.1 The model's utility<br />
We can now proceed to examine this simple model's<br />
utility. Clearly, it can produce the full range <strong>of</strong><br />
outcomes <strong>of</strong> interspecific competition: stable coexistence,<br />
predictable exclusion <strong>of</strong> one species by another,<br />
<strong>and</strong> exclusion between the two species with an<br />
indeterminate outcome. It should be recognized, however,<br />
that these are the only conceivable outcomes; to<br />
be useful, the model must produce the right outcome<br />
at the right time.<br />
The model indicates (Figs 4.25a & 4.25b) that one<br />
species will outcompete <strong>and</strong> exclude a second if the<br />
first species is a stronger competitor on the second<br />
than the second is on itself, <strong>and</strong> the effect is not<br />
reciprocated. We saw in section 4.7 that this was,<br />
indeed, the case for each bumble bee on its own flower<br />
(exploitation competition), <strong>and</strong> for Balanus excluding<br />
Chthamalus (interference competition). In other words,<br />
Fig. 4.25a <strong>and</strong> 4.25b successfully describes situations<br />
in which the second species lacks a realized niche in<br />
competition with the first.<br />
In Fig. 4.25c, both species are stronger competitors<br />
on the other species than they are on themselves:<br />
there is reciprocal interference competition. This will<br />
occur when each species produces a substance that is<br />
toxic to the other species but harmless to itself, or<br />
when there is reciprocal predation. In fact, this latter<br />
situation is the mechanism by which Park's flour<br />
beetles compete (section 4.6), <strong>and</strong> it is satisfying,<br />
therefore, to see that the model's predictions are borne<br />
out by Park's data: there is competitive exclusion, but<br />
the precise outcome is indeterminate. Whichever<br />
species starts with (or, at some point, attains) a more<br />
favourable density will 'outpredate' (or outpoison) the<br />
other.<br />
Finally, Fig. 4.25d indicates, quite reasonably, that<br />
stable coexistence is only possible when, for both<br />
species, intraspecific competition is more inhibitory<br />
than interspecific competition, i.e. when there is niche<br />
differentiation. We have seen repeatedly that this is<br />
the case. However, the model avoids the more pr<strong>of</strong>ound<br />
question <strong>of</strong> how much niche differentiation is<br />
necessary for stable coexistence.<br />
It is clear, then, that in broad terms the model is<br />
successful in spite <strong>of</strong> its limitations. Indeed, it is
108 PART 2: INTERSPECIFIC INTERACTIONS<br />
Fig. 4.25 The outcomes <strong>of</strong> competition generated by the<br />
Lotka-Volterra competition equations for the four possible<br />
arrangements <strong>of</strong> the N,- <strong>and</strong> N,-isoclines. Vectors,<br />
generally, refer to joint populations <strong>and</strong> are derived as<br />
indicated in (a). For further discussion, see text.<br />
important to realize that this model (given 'experimental<br />
teeth' by the laboratory work <strong>of</strong> Gause, 1934) was<br />
the original inspiration <strong>of</strong> the Competitive Exclusion<br />
Principle; investigation <strong>of</strong> the relevance <strong>of</strong> the principle,<br />
<strong>and</strong> its applicability in the real world, came later.<br />
Yet, the most important aspect <strong>of</strong> the model is that it<br />
makes exact, quantitative predictions about coexistence,<br />
based on the numerical values <strong>of</strong> the Ks <strong>and</strong> as.<br />
Ultimately the model's utility must be tested in these<br />
quantitative terms.
CHAPTER 4: INTERSPECIFIC COMPETITION 109<br />
4.13.2 A test <strong>of</strong> the model: fruit fly competition<br />
There have been several studies in which experimental<br />
results have tended to support the model's predictions.<br />
It will be more instructive, however, to consider<br />
an example in which results <strong>and</strong> predictions disagree,<br />
because this will illustrate a point <strong>of</strong> general<br />
importance: models are <strong>of</strong> their greatest utility when<br />
their predictions are not supported by real data, as long<br />
as the reason for the discrepancy can subsequently be<br />
discovered. Confirmation <strong>of</strong> a model's predictions represents<br />
consolidation; refutation with subsequent explanation<br />
represents progress.<br />
Ayala et al. (1973) reviewed Ayala's own findings on<br />
laboratory competition between pairs <strong>of</strong> Drosophila<br />
species. Their results are illustrated in Fig. 4.26.<br />
Ayala's basic procedure was to maintain either one- or<br />
two-species populations in culture bottles using a<br />
'serial transfer' technique-transferring adults to new<br />
food at regular intervals-<strong>and</strong> to monitor the populations<br />
for several generations until an approximate<br />
equilibrium was reached. This allowed him to estimate<br />
the carrying-capacities (K, <strong>and</strong> K,) in singlespecies<br />
populations, <strong>and</strong> the numbers for stable<br />
coexistence (N, <strong>and</strong> N,) in two-species populations.<br />
Figure 4.25d shows that our simple model predicts<br />
that stable coexistence should only occur at a point<br />
above <strong>and</strong> to the right <strong>of</strong> the line joining K, <strong>and</strong> K,. It<br />
is clear from Fig. 4.26, however, that in seven out <strong>of</strong><br />
eight cases Ayala found coexistence below <strong>and</strong> to the<br />
left <strong>of</strong> this line. Our simple model is, therefore, unable<br />
to account for Ayala's results.<br />
The simplest explanation for such a discrepancy is<br />
illustrated in Fig. 4.27. If the isoclines are concave,<br />
rather than straight, the values <strong>of</strong> K,, K,, G, <strong>and</strong> N,<br />
immediately become compatible. In fact, Ayala et al..<br />
(1973) were able to support this solution, in a particular<br />
species-pair, by following a number <strong>of</strong> populations<br />
for a single generation <strong>and</strong> obtaining an actual<br />
series <strong>of</strong> vectors. These, too, are shown in Fig. 4.27, in<br />
which we can see that the curved isoclines are,<br />
indeed, satisfactory lines <strong>of</strong> demarcation between<br />
areas <strong>of</strong> increase <strong>and</strong> decrease.<br />
Ayala et al. took their analysis a stage further by<br />
considering a range <strong>of</strong> possible alternative models<br />
Fig. 4.26 Carrying-capacities (open circles) <strong>and</strong> stable twospecies<br />
equilibrium points (closed circles) for eight<br />
combinations <strong>of</strong> two species <strong>of</strong> Drosophila. Each division<br />
along the coordinates corresponds to 250 flies. In all but<br />
the last case, the point <strong>of</strong> stable two-species equilibrium falls<br />
below the straight line joining the carrying-capacities. (After<br />
Ayala et al., 1973.)<br />
which would generate the appropriately curved isoclines.<br />
They judged these on a number <strong>of</strong> criteria,<br />
including simplicity, biological relevance <strong>of</strong> the parameters<br />
<strong>and</strong> quality <strong>of</strong> fit to the data, <strong>and</strong> found that<br />
one equation was particularly satisfactory. This<br />
equation:<br />
is a modification <strong>of</strong> the original, simple model, but it<br />
contains, in addition, a parameter, 8,' which modifies<br />
the underlying logistic equation, such that the function<br />
relating growth-rate to density need no longer be
110 PART 2: INTERSPECIFIC INTERACTIONS<br />
Thus, with a notation similar to that used in<br />
equation 3.5 in section 3.2.2 the mean yield iG1 <strong>of</strong> a<br />
plant <strong>of</strong> species 1 in a mixed population containing<br />
species 1 <strong>and</strong> 2, at densities N, <strong>and</strong> N, is<br />
in which y,, is a 'competition coefficient' or 'equivalence<br />
value' converting the density <strong>of</strong> species 2 into<br />
numerical terms equivalent to species 1. Likewise, the<br />
effect <strong>of</strong> species 2 on the mortality <strong>of</strong> 1 is<br />
Fig. 4.27 Isoclines for two species <strong>of</strong> Drosophila fitted by<br />
visual inspection <strong>of</strong> the vectors, which were derived<br />
empirically <strong>and</strong> are reduced to one-third <strong>of</strong> their actual<br />
length for clarity. Each division along the coordinates<br />
corresponds to 200 flies. Closed circles indicate the carrying<br />
capacities <strong>and</strong> the point <strong>of</strong> stable two-species equilibrium,<br />
which were also derived empirically. (After Ayala et al.,<br />
1973.)<br />
a straight line symmetrical about Kl2. Thus, the work<br />
<strong>of</strong> Ayala et al. confirms our original misgivings regarding<br />
the incorporation <strong>of</strong> the. logistic equation into our<br />
model. It also points to an alternative model which, in<br />
quantitative terms, is certain to be more generally<br />
applicable than the original. Note, however, that the<br />
more qualitative conclusions concerning exclusion<br />
<strong>and</strong> coexistence remain unaffected.<br />
4.14 Analysis <strong>of</strong> competition in plants<br />
Where competitive outcomes are assessed by additive<br />
designs (see Fig. 4.7) the analysis <strong>of</strong> competition is<br />
achieved by the use <strong>of</strong> yield-density models. These<br />
come in a variety <strong>of</strong> forms depending on the design<br />
used <strong>and</strong> the ability <strong>of</strong> the model to fit the observed<br />
data empirically (Cousens, 1985).<br />
To analyse additive designs we must reconsider the<br />
model developed earlier for intraspecific competition<br />
(equations 3.5 <strong>and</strong> 3.6). Hassell <strong>and</strong> Comins (1976)<br />
<strong>and</strong> Watkinson (1980) have pointed out that this<br />
model may be easily extended to include the influence<br />
<strong>of</strong> a second species.<br />
where dI2 is the appropriate equivalence value determining<br />
the density-dependent mortality in species 1<br />
attributable to species 2. This pair <strong>of</strong> equations can<br />
also be written for species 2 with (<strong>of</strong> course) different<br />
equivalence coefficients.<br />
We can appreciate the value <strong>of</strong> this model by<br />
re-examining the data <strong>of</strong> Marshal1 <strong>and</strong> Jain (1969) on<br />
oats (see Fig. 4.10). Whereas from our earlier interpretation<br />
we could qualitatively conclude that Avena fatua<br />
was the superior competitor in mixture with A, barbata<br />
we can now quantify this. Fitting equation 4.1 to the<br />
results (Firbank & Watkinson, 1985) gave the following<br />
pair <strong>of</strong> equations:<br />
<strong>and</strong><br />
The subscripts B <strong>and</strong> F refer to A. barbata <strong>and</strong> A. fatua,<br />
respectively, whilst S is the mean number <strong>of</strong> seeds<br />
produced per plant <strong>and</strong> N is the density <strong>of</strong> each species<br />
in the mixture. This pair <strong>of</strong> equations neatly encapsulates<br />
the absolute differences between the two species<br />
<strong>and</strong> their competitive interactions. On average an<br />
isolated plant <strong>of</strong> A. fatua produced 47 seeds (188-141)<br />
less than A. barbata but required more space to do so<br />
since its ecological neighbour area (1.02) is larger than<br />
for A. barbata (0.41). This numerical superiority in<br />
seed output is <strong>of</strong>fset, however, by the fact that on a<br />
one-to-one basis A. fatua is much more competitive as<br />
judged by the competition coefficients. In mixture, A.<br />
barbata 'perceives' each A. fatua as equivalent to 1.44<br />
<strong>of</strong> its own individuals. Each A. fatua plant on the other
CHAPTER 4: INTERSPECIFIC COMPETITION 111<br />
h<strong>and</strong> 'perceives' each A. barbata plant as about a fifth<br />
(0.19) <strong>of</strong> one <strong>of</strong> its own. (Note that this analysis does<br />
not assume a reciprocity in competition coefficients as<br />
in the case <strong>of</strong> the replacement series.) We can immediately<br />
see then that this approach extends our<br />
qualitative conclusions about the nature <strong>of</strong> interspecific<br />
interactions.<br />
The 'competition coefficient' in equation 4.1 is<br />
density-independent-a 'fixed' value applying to all<br />
densities <strong>of</strong> the second species. In analysing the<br />
response surface shown in Fig. 4.1 1, Law <strong>and</strong> Watkinson<br />
(1987) showed, by careful statistical analysis, that<br />
a better fit to the observed data was achieved by a<br />
model that allowed competition coefficients to vary<br />
both with frequency <strong>and</strong> density.<br />
The form <strong>of</strong> model used was<br />
where, following previous conventions, yi is the mean<br />
seed yield per plant <strong>of</strong> species i, <strong>and</strong> ymi is the<br />
maximum yield <strong>of</strong> an isolated plant <strong>of</strong> species i, <strong>and</strong> Nl<br />
<strong>and</strong> N2 are the initial densities <strong>of</strong> each species. The<br />
power terms b, <strong>and</strong> b, enable competitive abilities to<br />
be described in a density-dependent manner, but it is<br />
not possible to attach biological meaning to them in<br />
the same way as b in equation 4.1. The estimated<br />
parameter values are indicated in the equations 4.3<br />
<strong>and</strong> the outcome <strong>of</strong> competition can be determined by<br />
iterating them from any initial pair <strong>of</strong> population<br />
densities, N,,, (Phleum) <strong>and</strong> N,,, (Vulpia). Note that this<br />
model assumes discrete generations <strong>of</strong> population<br />
growth <strong>and</strong> the seed yield <strong>of</strong> each species after the<br />
action <strong>of</strong> competition is reduced by 50% to mimic seed<br />
losses during the dormant stage <strong>of</strong> the life cycle.<br />
Figure 4.28 gives in a joint abundance diagram <strong>of</strong><br />
the two species the density combinations that give<br />
zero population growth for each species-the zero<br />
growth isoclines-<strong>and</strong> some illustrative population<br />
trajectories. All <strong>of</strong> the population trajectories move<br />
(usually in a single generation) to the space between<br />
the isoclines <strong>and</strong> then consistently towards the bound-<br />
Fig. 4.28 An abundance diagram for Phleum arenanum <strong>and</strong><br />
Vulpia fasiculata showing the isoclines (derived from the data<br />
shown in Fig. 4.11) <strong>and</strong> the trajectories (arrowed)<br />
illustrating the long-term outcome <strong>of</strong> competition over<br />
succeeding generations. (After Law & Watkinson, 1987.)<br />
ary equilibrium density for Vulpia <strong>of</strong> 227 seeds, with<br />
the eventual eradication <strong>of</strong> Phleum. Note that this<br />
happens despite the fact that isolated plants <strong>of</strong> Phleum<br />
are much more prolific seed producers than Vulpia,<br />
1160 as opposed to 187 seeds per plant.<br />
The outcome <strong>of</strong> competition described by yielddensity<br />
relationships in the form <strong>of</strong> equation 4.1 may<br />
be analysed in a similar manner on joint abundance<br />
diagrams but in actual fact there is an alternative <strong>and</strong><br />
easier method <strong>of</strong> analysis. Consider the pair <strong>of</strong> recurrence<br />
equations (4.4) for two species X <strong>and</strong> Y in which<br />
competitive effects are described by an 'equivalence<br />
coefficient'.<br />
Hassell <strong>and</strong> Comins (1976) have shown that difference<br />
equations <strong>of</strong> this form are analytically tractable. That<br />
is to say, that it is possible by the mathematical<br />
technique <strong>of</strong> phase plane analysis to identify four<br />
regions in the parameter space <strong>of</strong> the coefficients a<br />
<strong>and</strong> p in which diierent outcomes <strong>of</strong> competition will<br />
occur. In two regions the model predicts that one<br />
species will be driven to extinction by the other; in<br />
another region stable coexistence <strong>of</strong> both species will<br />
result, whilst in the fourth unstable equilibria may<br />
result (Fig. 4.29). Thus from knowledge <strong>of</strong> the entire
112 PART 2: INTERSPECIFIC INTERACTIONS<br />
Fig. 4.29 Regions in the ap-plane defining the dynamical<br />
behaviour <strong>of</strong> two species interactions governed by equation<br />
4.9. (After Hassell & Comins. 1976.) The boundaries <strong>of</strong> the<br />
four regions are determined by Q where<br />
Q =<br />
See text for details.<br />
- l])/(al[(hy)1/b2 - l]).<br />
set <strong>of</strong> parameter values, we might make predictions <strong>of</strong><br />
the long-term outcome. As mentioned above, yielddensity<br />
responses have long been explored by agronomists<br />
seeking models to describe the relationships<br />
between crop yield <strong>and</strong> weed densities in additive<br />
competition experiments. Spitters (1983) reviews the<br />
range <strong>of</strong> reciprocal yield models <strong>and</strong> Mortimer et al.<br />
(1989) describe their relationship to equations 4.4.<br />
4.15 Niche overlap<br />
We return to the question first posed in section 4.10.<br />
How much niche differentiation is necessary for the<br />
coexistence <strong>of</strong> interspecific competitors? We shall see<br />
that this question is intimately related to a problem<br />
which, in evolutionary terms, confronts all species:<br />
that <strong>of</strong> <strong>of</strong>fsetting interspecific competition against<br />
intraspecific competition (section 4.12). There have<br />
been several theoretical approaches to the solution <strong>of</strong><br />
this problem, but since, for the most part, they reach<br />
similar conclusions, we can concentrate on the one<br />
Fig. 4.30 Resource utilization curves for three species<br />
coexisting in a one-dimensional niche system; d is the<br />
distance between curve maxima, which occur at the centre<br />
<strong>of</strong> the curve; W is the st<strong>and</strong>ard deviation <strong>of</strong> the curves.<br />
(a) Narrow niches with little overlap (d > W). (b) Broad<br />
niches with considerable overlap (d < W).<br />
initiated by MacArthur <strong>and</strong> Levins (1967) <strong>and</strong> developed<br />
by May (1973).<br />
Imagine three species competing for a single, unidimensional<br />
resource which is distributed continuously;<br />
food size <strong>and</strong> food at different heights in a forest<br />
canopy both conform to this description. Each species<br />
has its own niche in this single dimension within<br />
which it will (in our examples) consume food. Moreover,<br />
its consumption-rate is highest at the centre <strong>of</strong><br />
its niche <strong>and</strong> tails <strong>of</strong>f to zero at either end. Its niche
CHAPTER 4: INTERSPECIFIC COMPETITION 113<br />
can, therefore, be visualized as a resource utilization<br />
curve (Fig. 4.30). Clearly, the more adjacent species'<br />
utilization curves overlap, the more they compete.<br />
Indeed, if we make the (fairly restrictive) assumptions<br />
that the curves are 'normal' (in the statistical sense),<br />
<strong>and</strong> that the different species have similar curves, then<br />
the competition coefficient (applicable to both adjacent<br />
species) can be related to the st<strong>and</strong>ard deviation <strong>of</strong> the<br />
curves, W, <strong>and</strong> the difference between their peaks, d,<br />
by the following formula:<br />
- d2<br />
Thus a is very small when there is considerable<br />
separation <strong>of</strong> adjacent curves (dlw >> 1, Fig. 4.30a) <strong>and</strong><br />
approaches unity as the curves themselves approach<br />
one another (dlw < 1, Fig. 4.30b).<br />
In terms <strong>of</strong> this model, we can ask the following<br />
question. How much overlap <strong>of</strong> adjacent utilization<br />
curves is compatible with stable coexistence? Obviously,<br />
if there is very little overlap, as in Fig. 4.30,<br />
there is very little interspecific competition <strong>and</strong> competitors<br />
can coexist. Conversely, in such a case the<br />
species have rather narrow niches. This means, since<br />
all conspecifics are consuming very similar food, that<br />
there is intense intraspecific competition. Moreover,<br />
the food items in those positions along the resource<br />
spectrum where the curves overlap are being almost<br />
totally ignored by the consumers. It is, therefore, likely<br />
that natural selection will favour an increased consumption<br />
<strong>of</strong> these neglected food items, an increase in<br />
niche breadth, a lessening <strong>of</strong> intraspecific competition,<br />
<strong>and</strong> thus an increase in niche overlap. The question is:<br />
how much?<br />
MacArthur <strong>and</strong> Levins (1967) <strong>and</strong> May (1973)<br />
answered this question by what was, in essence, an<br />
extension <strong>of</strong> the search for stable coexistence pursued<br />
in section 4.13. They assumed that the two peripheral<br />
species had similar carrying capacities (K,, proportional<br />
to the area under the utilization curve), <strong>and</strong><br />
considered the coexistence between them <strong>of</strong> an intermediate<br />
species (carrying capacity K,). Their results<br />
are illustrated in Fig. 4.31, which indicates the values<br />
<strong>of</strong> K,lK, that are compatible with stable coexistence<br />
for various values <strong>of</strong> &W. At low values <strong>of</strong> dlw (high a)<br />
Fig. 4.31 Niche overlap <strong>and</strong> coexistence. The range <strong>of</strong><br />
resource utilization (indicated by the carrying capacities, K,<br />
<strong>and</strong> K,, where K, = K,) which permits a three-species<br />
equilibrium community with various degrees <strong>of</strong> niche<br />
overlap (dlw). (After May, 1973.)<br />
the conditions for coexistence are extremely restrictive,<br />
but these restrictions lift rapidly as dlw approaches<br />
<strong>and</strong> exceeds unity. In other words, stable<br />
coexistence is possible under the restrictive conditions<br />
imposed by low values <strong>of</strong> dlw, but as May (1973) points<br />
out, because conditions are so restrictive '. . . it may be<br />
plausibly argued that environmental vagaries in the<br />
real world will upset such an equilibrium'.<br />
So we have seen that high values <strong>of</strong> dlw there is<br />
intense intraspecific competition <strong>and</strong> underexploitation<br />
<strong>of</strong> resources, <strong>and</strong> at low values <strong>of</strong> dlw the<br />
equilibrium is too fragile to be maintained in the real<br />
world. Theory, therefore, suggests that the coexistence<br />
<strong>of</strong> competitors (using a unidimensional resource) will<br />
be based on niche differentiation in which &W is<br />
approximately equal to, or slightly greater than unity.<br />
Unfortunately, the testing <strong>of</strong> this suggestion is hindered<br />
by two major problems. The first is that it<br />
applies only to situations in which there is a simple,<br />
unidimensional resource (probably quite rare), <strong>and</strong> in<br />
which the utilization curves are at least approximately<br />
the same as in the model. Competition in several<br />
dimensions, <strong>and</strong> certain alternative utilization curves<br />
(Abrarns, 1976) would both lead to lower values <strong>of</strong> dlw<br />
being compatible with robust, stable coexistence. The<br />
second problem is the collection <strong>of</strong> the appropriate
114 PART 2: INTERSPECIFIC INTERACTIONS<br />
data. These are needed in order to establish the<br />
dimensionality <strong>of</strong> competition, <strong>and</strong> the form <strong>of</strong> the<br />
utilization curve; <strong>and</strong> also to determine not only d but<br />
W as well. Thus, the field evidence persuasively used<br />
by May (1973) in support <strong>of</strong> this model's suggestions<br />
was even more persuasively criticized by Abrams<br />
(1976). In particular, there is a grave danger, when<br />
attempting to 'test' the predictions <strong>of</strong> this model, that<br />
those field examples that support it will be selected,<br />
while those that do not support it are ignored. From<br />
our own examples, for instance, we could select the<br />
ant Veromessor perg<strong>and</strong>ei (see Fig. 4.6) <strong>and</strong> the two<br />
hydrobiid snails (see Fig. 4.19) as providing empirical<br />
support for the model's prediction (dfw = 1). Yet, while<br />
such support is gratifying, it most certainly does not<br />
prove that the model is correct. What is needed is<br />
evidence that such 'supportive' patterns occur much<br />
more frequently than would be expected by chance<br />
alone; <strong>and</strong> as yet we have insufficient data to provide<br />
this evidence.<br />
Nevertheless, the model has shown us that there is<br />
likely to be some limit to the similarity <strong>of</strong> competing<br />
species; <strong>and</strong> that this limit represents a balance<br />
between, on the one h<strong>and</strong>, the evolutionary avoidance<br />
<strong>of</strong> intraspecific competition <strong>and</strong> the underexploitation<br />
<strong>of</strong> resources, <strong>and</strong> on the other h<strong>and</strong>, the evolutionary<br />
avoidance <strong>of</strong> equilibria which are too fragile to withst<strong>and</strong><br />
the vagaries <strong>of</strong> the real world. Once again,<br />
therefore, a model, without being 'correct', has been<br />
immensely instructive.<br />
4.16 Competition <strong>and</strong> heterogeneity<br />
Most <strong>of</strong> this chapter has been concerned with competitive<br />
situations in which the habitat has remained<br />
more or less constant <strong>and</strong> environmental conditions<br />
have remained more or less stable. Under these<br />
circumstances the models we have explored, based on<br />
intrinsic rates <strong>of</strong> increase, carrying capacities <strong>and</strong><br />
competitive abilities, can be expected to give a reasonable<br />
description <strong>of</strong> interspecific competition. Individuals<br />
have had time to distribute themselves relatively<br />
evenly in the suitable habitats <strong>and</strong>, as assumed by the<br />
classical theory, each individual encounters about the<br />
same number <strong>of</strong> conspecific <strong>and</strong> heterospecific com-<br />
petitors. However, for many competing species, habitats<br />
are <strong>of</strong>ten less predictable <strong>and</strong> shorter lived. Many<br />
species exploit resources which are divided into small,<br />
discrete patches, such as carrion, dung, fungi or fruit.<br />
In these patches there is <strong>of</strong>ten time for just one<br />
generation before the resource unit (patch) becomes<br />
unusable. Here, species' competitive abilities are not<br />
the only determinants <strong>of</strong> coexistence or competitive<br />
exclusion.<br />
Atkinson <strong>and</strong> Shorrocks (1981) explored by computer<br />
simulation, <strong>and</strong> Hanski (1981) by a simple<br />
analytical model, ways <strong>of</strong> incorporating habitat heterogeneity<br />
into competition models. They examined the<br />
effect <strong>of</strong> resource subdivision on two species competition<br />
<strong>and</strong> found that their coexistence could be facilitated<br />
by dividing the resource into more <strong>and</strong> smaller<br />
breeding patches, assuming that the distribution <strong>of</strong><br />
individuals was aggregated over those patches. The<br />
opposite <strong>of</strong> an aggregated distribution is an even<br />
distribution when each patch contains an equal number<br />
<strong>of</strong> competitors. If both competitors were evenly<br />
distributed then the inferior competitor would come<br />
into conflict with the superior competitor on every<br />
patch <strong>and</strong> would be eliminated. This is not the case<br />
with aggregated distributions, when, depending on<br />
the level <strong>of</strong> aggregation, many individuals <strong>of</strong> the<br />
inferior competitor meet few, if any, individuals <strong>of</strong> the<br />
superior competitor. In particular, the models <strong>of</strong><br />
Atkinson <strong>and</strong> Shorrocks <strong>and</strong> <strong>of</strong> Hanski demonstrate<br />
the possibility <strong>of</strong> continued coexistence <strong>of</strong> an inferior<br />
with a superior competitor, when the two species have<br />
independently aggregated distributions over the resource<br />
patches. Coexistence occurs because the competitive<br />
pressure <strong>of</strong> the superior competitor is largely<br />
directed-as a result <strong>of</strong> aggregation-at members <strong>of</strong> its<br />
own species, those present in the high density patches.<br />
In other patches, the superior competitor will be<br />
scarce or absent, <strong>and</strong> here the inferior competitor is<br />
able to escape interspecific competition. In other<br />
words, coexistence is facilitated becasue the variation<br />
in population densities among the habitat patches<br />
shifts the balance from interspecific towards more<br />
intraspecific competition. It should be noted that if two<br />
species do not have relatively independent distributions<br />
but have a tendency to aggregate in the same
CHAPTER 4: INTERSPECIFIC COMPETITION 115<br />
patches, then coexistence is less likely. Thus habitat<br />
patchiness itself is not critical: the important question<br />
is how that heterogeneity is perceived by individuals.<br />
Rosewell et al. (1990) <strong>and</strong> Shorrocks et al. (1990)<br />
have tested the assumptions <strong>of</strong> the aggregation mode1<br />
<strong>of</strong> coexistence using 360 data sets, largely for drosophilid<br />
flies-the group that inspired the original model.<br />
The assumptions tested were that: (i) the competing<br />
individuals (larvae) are aggregated; (ii) the degree <strong>of</strong><br />
aggregation can be represented by a parameter (k <strong>of</strong><br />
the negative binomial distribution) which remains the<br />
same at different overall densities; <strong>and</strong> (iii) there is no<br />
strong association between species. The vast majority<br />
(930) <strong>of</strong> the data sets showed larval aggregation, so<br />
the first assumption was upheld: competing stages are<br />
strongly aggregated. Of the data sets 79% were adequately<br />
described by a negative binomial distribution.<br />
The assumption that aggregation (as measured by the<br />
parameter k <strong>of</strong> the negative binomial distribution) does<br />
not change with density was less well supported.<br />
Aggregation declined at higher densities <strong>and</strong> thus<br />
coexistence may be less likely in larger patches (see<br />
also Shorrocks & Rosewell, 1987). Even if this second<br />
assumption is relaxed, however, the predictions <strong>of</strong> the<br />
model remain essentially unchanged. The final assumption,<br />
that species utilizing patchy resources are<br />
distributed independently <strong>of</strong> each other was potentially<br />
a complicating factor for the two-species model,<br />
but in only 5% <strong>of</strong> possible comparisons examined were<br />
significant associations found. Thus coexistence <strong>of</strong> two<br />
species with independently aggregated distributions is<br />
likely in situations in which one or other <strong>of</strong> the species<br />
would have been eliminated in a homogeneous environment.<br />
Studies on the coexistence <strong>of</strong> competitors on<br />
ephemeral resources have not been restricted to fruit<br />
flies. Hanski <strong>and</strong> Kuusela (1977), Hanski (1987) <strong>and</strong><br />
Ives (1991) have looked at aggregation <strong>and</strong> coexistence<br />
in carrion fly communities (the community <strong>of</strong><br />
flies whose larvae feed on dead animals, usually<br />
vertebrates). In Hanski <strong>and</strong> Kuusela's study, 50 small<br />
pieces <strong>of</strong> carrion were laid out in a small area <strong>and</strong><br />
natural colonization was permitted to take place. A<br />
total <strong>of</strong> nine species <strong>of</strong> carrion fly was recovered from<br />
the patches, but the mean number <strong>of</strong> species emerging<br />
per patch was only 2.7. AIl nine species showed highly<br />
aggregated distributions <strong>and</strong> particular pairs <strong>of</strong> species<br />
came into contact only rarely, thus interspecific competition<br />
was much less intense than might have been<br />
expected on the basis <strong>of</strong> the number <strong>of</strong> species <strong>and</strong><br />
number <strong>of</strong> patches present. Ives (1991), by a mixture<br />
<strong>of</strong> experiment similar to that described above, <strong>and</strong><br />
theory, has estimated that the effect <strong>of</strong> aggregation on<br />
coexistence for the five carrion fly species present in<br />
his study was equivalent to reducing the amount <strong>of</strong><br />
larval competition between pairs <strong>of</strong> species by an<br />
average <strong>of</strong> at least 5 7%.<br />
The aggregation model predicts that coexistence <strong>of</strong><br />
many species is <strong>of</strong>ten dependent on their independently<br />
aggregated spatial distributions. Hanski (1987)<br />
has tested this prediction with a field experiment with<br />
blowfiies. Female flies were allowed to oviposit for 3<br />
days on small carcasses placed at 15 m intervals in a<br />
homogeneous field. After the oviposition period, the<br />
Fig. 4.32 Comparison between the control <strong>and</strong><br />
experimental rearings in species number. The open<br />
histogram is the null hypothesis, derived by pooling flies<br />
from each combination <strong>of</strong> two <strong>and</strong> four <strong>of</strong> the 20 control<br />
rearings (n = 190 <strong>and</strong> 4845, respectively). The number <strong>of</strong><br />
experimental rearings was 11 (two pieces) <strong>and</strong> nine (four<br />
pieces). Removing resource patchiness increases the<br />
dominance <strong>of</strong> the best competitor <strong>and</strong> decreases species<br />
richness. (From Hanski, 1987.)
116 PART 2: INTERSPECIFIC INTERACTIONS<br />
carcasses were removed from the field <strong>and</strong> placed in<br />
containers to rear the flies out. In the control rearings,<br />
each carcass was placed in its own container, whereas<br />
in the experimental rearings two or four carcasses<br />
were placed next to each other in the same container.<br />
In the experimental rearings fly maggots could easily<br />
move from one carcass to another, <strong>and</strong> thereby<br />
density variation among the carcasses placed in the<br />
same container was effectively removed. Figure 4.3 2<br />
shows that decreasing larval aggregation (the experimental<br />
rearings) decreased the number <strong>of</strong> fly species<br />
emerging from the rearing, in comparison with the<br />
expected results calculated from the control rearings.<br />
This result directly demonstrates how the aggregated<br />
spatial distribution <strong>of</strong> fly maggots among replicate<br />
carcasses maintains species richness in this community.<br />
There seems little doubt that aggregation plays a<br />
major role in explaining the coexistence <strong>of</strong> competitors<br />
on divided <strong>and</strong> ephemeral resources that would exclude<br />
one another on resources that were more<br />
homogeneous in space <strong>and</strong> time. Although insects<br />
living in carrion, dung, fruit or fungi may be extreme<br />
examples <strong>of</strong> species exploiting patchy habitats, they<br />
should not be regarded as exceptions to a rule <strong>of</strong><br />
habitat homogeneity, rather as one end <strong>of</strong> a continuum.<br />
All habitats are patchy <strong>and</strong> ephemeral to a<br />
degree, hence the theory outlined in this section can<br />
be expected to be applicable to many communities <strong>of</strong><br />
competitors.
Chapter 5<br />
5.1 Introduction<br />
Although this chapter is entitled 'Predation', we shall<br />
be dealing in it with a variety <strong>of</strong> interactions. In all the<br />
cases we shall be considering, however, animals will<br />
totally consume, or partly consume <strong>and</strong> also harm, other<br />
animals or plants. This broad umbrella is designed to<br />
include each <strong>of</strong> the following categories <strong>of</strong> 'predator'.<br />
1 True predators that consume other animals-their<br />
prey-<strong>and</strong> thus gain sustenance for their own survival<br />
<strong>and</strong> reproduction.<br />
2 Parasitoids. These are insects, mainly from the order<br />
Hymenoptera, but also including many Diptera,<br />
which are free-living in their adult stage, but lay their<br />
eggs in, on or near other insects (or, more rarely,<br />
spiders or woodlice). The larval parasitoids then develop<br />
on or within their 'host' (usually, itself, a<br />
pre-adult), initially doing little harm, but eventually<br />
almost totally consuming, <strong>and</strong> therefore killing, the<br />
host prior to pupation. Often just one parasitoid<br />
develops from each host, but in some species several<br />
individuals share a host. Nevertheless, in either case,<br />
the number <strong>of</strong> hosts attacked in one generation closely<br />
defines the number <strong>of</strong> parasitoids produced in the<br />
next. This, along with the fact that the act <strong>of</strong> 'predation'<br />
is confined to a particular phase <strong>of</strong> the life history<br />
(adult females attacking hosts), means that parasitoids<br />
are especially suitable for study. They have provided a<br />
wealth <strong>of</strong> information relevant to predation generally.<br />
3 Parasites. These are organisms (animals or plants)<br />
that live in an obligatory, close association, usually<br />
with a single host individual for a large portion <strong>of</strong> their<br />
lives. They gain sustenance from their host <strong>and</strong> do<br />
their host harm, but parasite-induced host mortality is<br />
by no means the general rule, <strong>and</strong> is <strong>of</strong>ten rather rare.<br />
4 Herbivores. These are animals that eat plants. Some<br />
appear to act as true predators, since they totally<br />
consume other organisms for their own sustenance<br />
(seed-eaters are a particularly good example). Others<br />
are much more like parasites; aphids, for instance, live<br />
in close association with plant hosts, gain sustenance<br />
from them, <strong>and</strong> reduce their vitality. Many other<br />
herbivores, however, fall into neither category. They<br />
do not live in close association with any one plant<br />
host; but by consuming parts <strong>of</strong> plants, they are <strong>of</strong>ten<br />
the ultimate, if not the immediate, cause <strong>of</strong> plant<br />
mortality. Thus, they certainly do have a detrimental<br />
effect on their plant 'prey'.<br />
These four categories are all quite distinct <strong>and</strong><br />
special in their own way, but, as their inclusion within<br />
a single definition shows, they share important common<br />
features. For this reason there will be many<br />
statements in this chapter that apply to all categories.<br />
It would be tedious to refer individually in every such<br />
case to 'true predators <strong>and</strong> their prey, parasitoids <strong>and</strong><br />
their hosts, parasites <strong>and</strong> their hosts, <strong>and</strong> herbivores<br />
<strong>and</strong> their food plants'. Instead, for simplicity, <strong>and</strong><br />
where the context precludes ambiguity, the four<br />
categories will be referred to, together, as predators<br />
(or, rarely, consumers) <strong>and</strong> their prey.<br />
We can, therefore, apply a single definition <strong>and</strong> a<br />
single, all-embracing label to these four categories. But<br />
we can also apply a single naive expectation regarding<br />
their population dynamics. If we imagine a single species<br />
<strong>of</strong> predator <strong>and</strong> a single species <strong>of</strong> prey, then we can<br />
expect predators to increase in abundance when there<br />
are large numbers <strong>of</strong> prey. However, there should then<br />
be an increase in predation-pressure on the prey,<br />
leading to a decrease in prey abundance. This will<br />
ultimately lead to food-shortage for the predators, a<br />
decrease in predator abundance, a concomitant drop in<br />
predation-pressure, an increase in prey abundance<br />
<strong>and</strong> so on. In other words, there appears, superficially,<br />
to be an inherent tendency for predators <strong>and</strong> their prey<br />
(<strong>and</strong> parasitoids <strong>and</strong> their hosts, parasites <strong>and</strong> their<br />
hosts, <strong>and</strong> herbivores <strong>and</strong> their food plants) to undergo<br />
coupled oscillations in abundance, predator numbers<br />
'tracking' those <strong>of</strong> the prey.
118 PART 2: INTERSPECIFIC INTERACTIONS<br />
5.2 Patterns <strong>of</strong> abundance<br />
Some actual examples <strong>of</strong> abundance patterns are<br />
shown in Fig. 5.1. Certainly, some do appear to show<br />
coupled oscillations (Fig. 5 .la & 5.lb), but there are<br />
also cases in which the 'prey' are kept at a constant<br />
low level (Fig. 5 .lc & 5.ld), cases in which the prey<br />
exhibit periodic outbreaks (Fig. 5.le), <strong>and</strong> cases in<br />
which the 'predators' have no noticeable, simple effect<br />
on the prey since the fluctuations in the sizes <strong>of</strong> the<br />
two populations are apparently unconnected (Fig. 5. l f<br />
& 5.lg).<br />
It is clear, in other words, even from this limited<br />
range <strong>of</strong> examples, that actual predators, parasitoids,<br />
( f 1 I Wood mice <strong>and</strong> bank voles<br />
'0 5 10 15 20 25<br />
Generation<br />
(c) 5<br />
g 60 t Beetle introduced<br />
.<br />
I<br />
\'<br />
L L Estimated<br />
80 2<br />
II<br />
I I . house mouse<br />
I<br />
0 50 150<br />
Days<br />
Fig. 5.1 Patterns <strong>of</strong> abundance in predator-prey systems.<br />
(a) The lynx Lynx canadensis <strong>and</strong> the snowshoe hare Lepus<br />
americanus; true predator-prey. (After MacLulick, 1937 .)<br />
(b) The wasp Heterospilus prosopidis <strong>and</strong> the bean weevil<br />
Callosobruchus chinensis; parasitoid-host. (After Utida,<br />
1957.) (c) Changes in the abundance <strong>of</strong> the Klamath weed<br />
Hypericum perjoratum following the introduction <strong>of</strong> the leafeating<br />
beetle Chpjsolina quadrigemina; herbivore-plant.<br />
(After Huffaker & Kennett, 1959.) (d) The effect on the<br />
beetle Laemophloeas minutus <strong>of</strong> being infected by the<br />
protozoan Mattesia dispora; parasite-host. (After Finlayson,<br />
1949.) (e) The psyllid Cardiaspina albitextura <strong>and</strong> mortality<br />
caused by Syrphus species; true predator-prey. (After Clark,<br />
1963.) (f) Tawny owls Strix aluco <strong>and</strong> wood mice <strong>and</strong> bank<br />
voles Apodemus sylvaticus <strong>and</strong> Clethrionomys glareolus: true<br />
predator-prey. (After Southern, 1970.) (g) The house mouse<br />
Mus musculus <strong>and</strong> barley Hordeum vulgare; herbivore-plant.<br />
(After Newsome, 1969a.)
CHAPTER 5: PREDATION 119<br />
parasites, herbivores <strong>and</strong> their 'prey' all exhibit a wide<br />
variety <strong>of</strong> patterns <strong>of</strong> abundance, <strong>and</strong> we can immediately<br />
see two rather obvious reasons for this. The<br />
first is that predators <strong>and</strong> prey do not normally exist as<br />
simple, two-species systems. To underst<strong>and</strong> the abundance<br />
patterns exhibited by two interacting species,<br />
these must be viewed in a realistic, multi-species<br />
context. The second reason is that our conception <strong>of</strong><br />
even the simplest, abstracted, two-species system is<br />
itself excessively naive. Before multi-species systems<br />
are even considered, we must ab<strong>and</strong>on our expectation<br />
<strong>of</strong> universal prey-predator oscillations, <strong>and</strong> look<br />
instead, much more closely, at the ways in which<br />
predators <strong>and</strong> their prey interact in practice.<br />
We shall examine, in turn, the individual components<br />
<strong>of</strong> the predator-prey relationship (an approach<br />
employed successfully by Hassell, 1976, 1978); but<br />
the journey covering these components will be a long<br />
ancl fairly complicated one. Moreover, it is only after all<br />
the topics have been examined in detail that we shall<br />
be able to reassemble them into an integrated whole.<br />
At this stage, therefore, we provide an itinerary which<br />
can be referred to now or part-way through the<br />
journey. This is set out in Table 5.1, <strong>and</strong> in the<br />
folllowing outline <strong>of</strong> the rest <strong>of</strong> this chapter.<br />
In section 5.3, the patterns <strong>of</strong> food preference<br />
shown by predators are examined, along with some<br />
possible determinants <strong>of</strong> these patterns. Then, in<br />
section 5.4, a number <strong>of</strong> effects <strong>of</strong> time scales <strong>and</strong><br />
timing are considered. This is followed by an examination<br />
<strong>of</strong> the detailed effects <strong>of</strong> predators on the fitness<br />
Table 5.1 Summary <strong>of</strong> the components <strong>of</strong> the predatorprey<br />
interaction which are examined in this chapter.<br />
<strong>of</strong> prey, paying special attention to the effects <strong>of</strong><br />
herbivores on plants (section 5.5). Then, in section<br />
5.6, consideration is given to the ways in which prey<br />
'thresholds' <strong>and</strong> food quality complicate the relationship<br />
between predation-rate <strong>and</strong> the beneficial effects<br />
to the predator. Section 5.7 covers the way in which<br />
predation-rate is influenced by the availability (especially<br />
the density) <strong>of</strong> prey items; while a long section<br />
5.8 considers some <strong>of</strong> the consequences <strong>of</strong> environmental<br />
heterogeneity (particular attention being paid<br />
to the unequal way in which many predators distribute<br />
their harmful effects amongst individual prey). In<br />
section 5.9, the consequences <strong>of</strong> mutual interference<br />
amongst predators are examined, <strong>and</strong> in section 5.10,<br />
the similarities between the effects produced by the<br />
processes in sections 5.8 <strong>and</strong> 5.9 are discussed. Then,<br />
in section 5.11 attention is drawn to the tendency <strong>of</strong><br />
predators to maximize their 'pr<strong>of</strong>its' by 'foraging<br />
optimally'; while section 5.12 is a resume <strong>of</strong> the<br />
preceding nine sections.<br />
Throughout these sections we will be especially<br />
concerned with the effects that these individual components<br />
have on the dynamics <strong>of</strong> the predator <strong>and</strong><br />
prey populations; <strong>and</strong> in particular, with the regulatory,<br />
stabilizing effects <strong>of</strong> density-dependent processes,<br />
<strong>and</strong> the destabilizing effects <strong>of</strong> inversely densitydependent<br />
processes (sections 2.3 <strong>and</strong> 2.6). Then, in<br />
section 5.13, we attempt to incorporate many <strong>of</strong> the<br />
behaviourally complex components into models <strong>of</strong><br />
predator-prey interactions, hoping to explore further<br />
their effects on population dynamics <strong>and</strong> stability; <strong>and</strong><br />
this allows us, in section 5.14, to reconsider the<br />
abundance patterns <strong>of</strong> the present section in the light<br />
<strong>of</strong> sections 5.3-5.13. Finally, section 5.15 examines<br />
problems emanating from the contrived human predation<br />
involved in the process <strong>of</strong> harvesting.<br />
5.3 Coevolution, <strong>and</strong> specialization<br />
amongst predators<br />
Predators <strong>of</strong> all types can be classified, according to<br />
their diet width, as monophagous (feeding on a single<br />
prey type), oligophagous (few prey types) or polyphaous<br />
(many prey types), <strong>and</strong> the degree <strong>of</strong> specialization can<br />
have important effects on predator-prey dynamics.
120 PART 2: INTERSPECIFIC INTERACTIONS<br />
The abundance <strong>of</strong> a monophagous predator, for instance,<br />
is likely to be closely linked to the distribution<br />
<strong>and</strong> abundance <strong>of</strong> its prey; while a polyphage is very<br />
unlikely to have its abundance determined by any one<br />
<strong>of</strong> its prey types. If we are to underst<strong>and</strong> the patterns<br />
<strong>of</strong> diet width amongst predators, however, we must<br />
begin by establishing two basic points. The first is that<br />
predators choose pr<strong>of</strong>itable prey. This follows, by an act<br />
<strong>of</strong> faith, from a consideration <strong>of</strong> natural selection<br />
(evolution favours those individuals with the highest<br />
Fig. 5.2 Predators eating 'pr<strong>of</strong>itable' prey: (a) crabs eating<br />
mussels (Elner & Hughes, 1978); (b) pied wagtails eating<br />
flies (Davies, 1977). (After Krebs, 1978.) 1 calorie (non-S1<br />
unit) = 4.186 joules.<br />
fitness; fitness is increased by increasing the pr<strong>of</strong>itability<br />
<strong>of</strong> food-acquisition; evolution, therefore, favours<br />
predators that choose pr<strong>of</strong>itable prey). It is also<br />
borne out by the facts. Figure 5.2, for instance,<br />
illustrates examples <strong>of</strong> predators actively selecting<br />
those prey items which are most pr<strong>of</strong>itable, i.e. prey<br />
items for which the gain (in terms <strong>of</strong> energy intake per<br />
unit time spent h<strong>and</strong>ling prey) is greatest.<br />
The second point stems from the fact that all<br />
animals <strong>and</strong> plants have evolved in response to<br />
selection pressures originating, to a large extent, from<br />
the other animals <strong>and</strong> plants in their environment.<br />
The point, then, is that predators <strong>and</strong> their prey are likely<br />
to have coevolved. There is a continuous selection<br />
pressure on prey to avoid death (or, more generally,<br />
fitness-reduction) at the h<strong>and</strong>s <strong>of</strong> their predators, <strong>and</strong><br />
a reciprocal, continuous pressure on predators to<br />
increase their fitness by exploiting their prey more<br />
effectively. At perhaps its most trivial, this evolutionary<br />
arms race consists <strong>of</strong> prey that can run quickly<br />
from their predators, <strong>and</strong> predators that can run<br />
quickly after their prey, both being favoured by<br />
natural selection. However, we can see the results <strong>of</strong><br />
analogous pressures on prey in the distasteful or<br />
poisonous chemicals in the leaves <strong>of</strong> many plants, in<br />
the spines <strong>of</strong> hedgehogs, the camouflage coloration <strong>of</strong><br />
many insects, <strong>and</strong> the immunological responses <strong>of</strong><br />
hosts to parasite infection; while in predators these<br />
pressures results, for instance, in the long, stout,<br />
penetrative ovipositors <strong>of</strong> wood wasps, the hooks <strong>and</strong><br />
suckers on the heads <strong>of</strong> tapeworms, <strong>and</strong> the silent<br />
approach <strong>and</strong> sensory excellence <strong>of</strong> owls. It is clear, in<br />
short, that no natural predator-prey interaction can<br />
be properly understood unless it is realized that each<br />
protagonist has played an essential role in the evolution<br />
<strong>of</strong> the other.<br />
It is equally clear, however, irrespective <strong>of</strong> any<br />
coevolution, that no predator can possibly be capable<br />
<strong>of</strong> consuming all types <strong>of</strong> prey; simple design constraints<br />
prevent shrews from eating owls, <strong>and</strong><br />
humming-birds from eating seeds. Nevertheless, coevolution<br />
provides an added force in the restriction <strong>of</strong><br />
diet width. Each prey species responds (in an evolutionary<br />
sense <strong>and</strong> on an evolutionary time scale) in a<br />
different way to the pressures imposed by its predators,
CHAPTER 5: PREDATION 121<br />
but a predator cannot 'coevolve' in a wide range <strong>of</strong><br />
directions simultaneously. Predators, therefore, tend<br />
to specialize to a greater or lesser extent, <strong>and</strong> the<br />
better adapted a predator is for the exploitation <strong>of</strong> a<br />
particular prey species, the less likely it is to pr<strong>of</strong>it<br />
from the exploitation <strong>of</strong> a wide variety <strong>of</strong> prey.<br />
Parasites, in particular, because they live in such<br />
intimate association with their hosts, tend to specialize,<br />
evolutionarily, on a single host species. Their<br />
whole life style <strong>and</strong> life cycle is finely tuned to that <strong>of</strong><br />
their host, <strong>and</strong> this precludes their being finely tuned<br />
to any other host species. They are, therefore, commonly<br />
monophagous. For similar reasons, the same is<br />
true <strong>of</strong> many parasitoids, although in their case,<br />
possibly because they are free-living as adults, polyphagy<br />
(or at least oligophagy) is rather more common.<br />
Conversely, with herbivores <strong>and</strong> predators the situation<br />
is much less clear-cut. At one extreme there are<br />
examples <strong>of</strong> complete monophagy. The fruit fly, Drosophila<br />
pachea, for example, indigenous to the Sonoran<br />
Desert <strong>of</strong> the south-west USA, is the only species<br />
capable <strong>of</strong> consuming the rotten tissues <strong>of</strong> the Senita<br />
cactus (<strong>and</strong> its associated micro-organisms), because<br />
all other species are poisoned by an alkaloidpilocereine-which<br />
the Senita produces (Heed et al.,<br />
1976). Moreover, natural selection has favoured D.<br />
pachea's exploitation <strong>of</strong> this exclusive niche to such an<br />
extent that the fly has an absolute requirement for<br />
certain unusual sterols which are also only produced<br />
by the Senita. Many plants produce 'secondary',<br />
protective chemicals <strong>and</strong>, probably as a consequence,<br />
many herbivorous insects are specialists (Lawton &<br />
McNeill, 1979; Price, 1980). However, most true<br />
predators <strong>and</strong> many herbivores feed on a variety <strong>of</strong><br />
prey items.<br />
A partial explanation <strong>of</strong> the range <strong>of</strong> diet widths is<br />
provided by a simple consideration <strong>of</strong> the fact that,<br />
although there is pressure from coevolution towards<br />
predator specialization, there is a counterbalancing<br />
evolutionary pressure discouraging the reliance <strong>of</strong><br />
predators on an unpredictable or heavily exploited<br />
resource. For many parasites, the necessity for specialization<br />
clearly provides a pressure that outweighs any<br />
disadvantages stemming from resource unpredictability;<br />
for D. pachea, specialization is presumably fa-<br />
voured by the exclusivity (<strong>and</strong>, perhaps, predictability)<br />
<strong>of</strong> the Senita, <strong>and</strong> the consequent lack <strong>of</strong> interspecific<br />
competition. To a certain extent, similar arguments<br />
can be advanced to explain diet width generally. Thus,<br />
where prey exert pressures which dem<strong>and</strong> specialized<br />
morphological adaptation by the predator, there is a<br />
tendency for the predator to have a narrow range <strong>of</strong><br />
diet; <strong>and</strong> where predators feed on an unpredictable<br />
resource, there is a tendency for them not to be<br />
specialists.<br />
5.3.1 One explanation for the<br />
degrees <strong>of</strong> specialization<br />
In many cases, however, some further explanation is<br />
needed, <strong>and</strong> this may be provided by the ideas <strong>of</strong><br />
MacArthur <strong>and</strong> Pianka (1966; see also MacArthur<br />
1972). In order to obtain food, any predator must<br />
expend time <strong>and</strong> energy, first in searching for its prey,<br />
<strong>and</strong> then in h<strong>and</strong>ling it (i.e. pursuing, subduing <strong>and</strong><br />
consuming it). Searching will tend to be directed, to<br />
some degree, towards particular prey types; but, while<br />
searching, a predator is nevertheless likely to encounter<br />
a wide variety <strong>of</strong> food items. MacArthur <strong>and</strong><br />
Pianka, therefore, saw diet width as being determined<br />
by the choices made by predators once they had<br />
encountered prey. Generalist predators are those that<br />
choose to pursue (<strong>and</strong>, hopefully, subdue <strong>and</strong> consume)<br />
a large proportion <strong>of</strong> the prey they encounter;<br />
specialists are those that continue searching except<br />
when they encounter prey <strong>of</strong> their specifically preferred<br />
type.<br />
The basic conclusion MacArthur <strong>and</strong> Pianka drew<br />
from these considerations can be stated as follows.<br />
Predator choices are determined, ultimately, by the<br />
forces <strong>of</strong> natural selection, <strong>and</strong> are driven by these<br />
forces towards the maximization <strong>of</strong> pr<strong>of</strong>itability for the<br />
predator. Natural selection, therefore, favours a predator<br />
that chooses to pursue a particular prey item if,<br />
during the time it takes to h<strong>and</strong>le that prey item, the<br />
predator cannot expect to search for <strong>and</strong> h<strong>and</strong>le a<br />
more pr<strong>of</strong>itable prey item. On this basis, predators<br />
with h<strong>and</strong>ling times that are generally short compared<br />
to their search times should be catholic in their tastes,<br />
because in the short time it takes them to h<strong>and</strong>le a
122 PART 2: INTERSPECIFIC INTERACTIONS<br />
prey item which has already been found, they can<br />
barely begin to search for another prey item. This is<br />
MacArthur <strong>and</strong> Pianka' s explanation for the broad<br />
diets <strong>of</strong> many insectivorous birds that 'glean' foliage.<br />
Search is always moderately time-consuming; but<br />
h<strong>and</strong>ling the minute, stationary insects takes negligible<br />
time <strong>and</strong> is almost always successful. Ignoring<br />
such prey items (i.e. narrowing diet width) would,<br />
therefore, decrease overall pr<strong>of</strong>itability, <strong>and</strong> the birds<br />
tend to be generalists.<br />
By contrast, many other predators have search<br />
times that are short relative to their h<strong>and</strong>ling times. In<br />
such cases, specialization will be favoured, because<br />
the predators can expect to find a more pr<strong>of</strong>itable food<br />
item very soon after ignoring a less pr<strong>of</strong>itable one.<br />
Lions, for instance live more or less constantly in sight<br />
<strong>of</strong> their prey so that search time is negligible; conversely,<br />
h<strong>and</strong>ling time <strong>and</strong> particularly pursuit time,<br />
can be very long (<strong>and</strong> energy-consuming). Lions consequently<br />
specialize on those prey that can be pursued<br />
most pr<strong>of</strong>itably: the immature, the lame <strong>and</strong> the old.<br />
Thus, on the basis <strong>of</strong> MacArthur <strong>and</strong> Pianka's ideas<br />
we can expect pursuers or h<strong>and</strong>lers (like lions) to have<br />
relatively narrow diets, <strong>and</strong> searchers to have relatively<br />
broad ones. Along similar lines, Recher (in<br />
MacArthur, 1972) found that great blue herons in the<br />
productive waters <strong>of</strong> Florida (in which search times<br />
were consequently short) had a much narrower range<br />
<strong>of</strong> food size in their diet than those inhabiting the<br />
unproductive lakes <strong>of</strong> the Adirondacks (where search<br />
times were relatively long).<br />
Clearly, we can go some way at least towards an<br />
underst<strong>and</strong>ing <strong>of</strong> the degrees <strong>of</strong> specialization shown<br />
by predators.<br />
<strong>and</strong> white spruce. As Table 5.2 shows, the deer, with<br />
free <strong>and</strong> equal access to all four species, exhibited a<br />
fairly consistent preference for jack pine followed by<br />
white pine, with red pine being only lightly browsed<br />
<strong>and</strong> white spruce ignored. Such preference amongst<br />
polyphagous animals is, in fact, the general rule; but<br />
as Murdoch <strong>and</strong> Oaten (1975) have shown, there are<br />
two distinct forms that this preference can take.<br />
An example <strong>of</strong> the simpler <strong>and</strong> much commoner<br />
form is shown in Fig. 5.3 (Murdoch, 1969). Two types<br />
<strong>of</strong> predatory shore snails, Thais <strong>and</strong> Acanthina, were<br />
presented with two species <strong>of</strong> mussel (Mytilus edulis<br />
<strong>and</strong> M. californianus) as prey, at a range <strong>of</strong> prey<br />
proportions. When the porportions were equal, the<br />
snails showed a marked preference for the thinnershelled<br />
M. edulis. The line in Fig. 5.3 has been drawn<br />
on the assumption that they retained this same<br />
preference at other (unequal) proportions, <strong>and</strong> this<br />
assumption is clearly justified: irrespective <strong>of</strong> availability,<br />
the snails showed the same marked preference for<br />
the less protected prey, which they could exploit most<br />
effectively.<br />
This can be contrasted with data <strong>of</strong> a rarer sort in<br />
Fig. 5.4a, obtained from an experiment in which the<br />
predatory water bug, Notonecta glauca, was presented<br />
5.3.2 Food preference <strong>and</strong> predator switching<br />
Irrespective <strong>of</strong> this range <strong>of</strong> diet width, however,<br />
polyphagy is very common; especially amongst predators<br />
<strong>and</strong> herbivores. Yet polyphagous animals are<br />
rarely indiscriminate in the various types <strong>of</strong> food they<br />
eat. Horton (1964), for example, presents the results <strong>of</strong><br />
an accidental field experiment in which deer broke<br />
into a plantation containing four species <strong>of</strong> tree<br />
arranged at r<strong>and</strong>om; white pine, red pine, jack pine<br />
Fig. 5.3 Snails exhibiting a consistent preference amongst<br />
the mussels Mytilus edulis <strong>and</strong> M. californianus irrespective<br />
<strong>of</strong> their relative abundance (means + 2 SE). (After Murdoch<br />
& Oaten, 1975).
CHAPTER 5: PREDATION 123<br />
Table 5.2 Food preferences exhibited by deer. Percentage<br />
browsing incidence <strong>of</strong> deer on planted trees. (After Horton,<br />
1964.)<br />
with two types <strong>of</strong> prey-the isopod, Asellus aquaticus<br />
<strong>and</strong> mayfly larvae (Cloeon dipterum)--with overall prey<br />
density held constant (Lawton et al., 1974). In this case<br />
the preference exhibited when the two prey types<br />
were equally available, if extrapolated to other availabilities<br />
(thin line in Fig. 5.4a), is obviously not a good<br />
indication <strong>of</strong> the overall response. Instead, Notonecta<br />
took a disproportionately small number <strong>of</strong> Asellus<br />
when they were scarce, <strong>and</strong> a disproportionately high<br />
number when they were common. This is known as<br />
predator switching, since it suggests that predators<br />
switch their preference to whichever prey is most<br />
common. In the case <strong>of</strong> Notonecta, the explanation is<br />
apparently illustrated in Fig. 5.4b: the more previous<br />
experience Notonecta has <strong>of</strong> Asellus, the more likely it is<br />
to make a successful attack. It appears, in other<br />
words, as if predator switching is based upon a learnt<br />
ability to specialize. This, essentially, is the view taken<br />
by Tinbergen (1960), who proposed that certain predators,<br />
particularly vertebrates, develop a 'specific<br />
searching image'. This enables them to search more<br />
successfully (since they effectively 'know what they<br />
are looking for'), <strong>and</strong> results in them concentrating on<br />
their 'image' prey to the relative exclusion <strong>of</strong> their<br />
non-image prey. Moreover, since the searching image<br />
develops as a result <strong>of</strong> previous experience, <strong>and</strong> since<br />
the predators (or herbivores) are most likely to experience<br />
common prey, we can expect predators to<br />
concentrate on a prey type when that type is common<br />
<strong>and</strong>l switch to another prey type when it is rare.<br />
The basis for predator switching has been discussed<br />
in more detail by Murdoch <strong>and</strong> Oaten (1975). One <strong>of</strong><br />
their most instructive examples is the work <strong>of</strong> Murdoch,<br />
Avery <strong>and</strong> Smyth (in Murdoch & Oaten, 1975)<br />
on guppies <strong>of</strong>fered a choice between fruit flies <strong>and</strong><br />
Fig. 5.4 (a) The percentage <strong>of</strong> Asellus in the diet <strong>of</strong> Notonecta<br />
as a function <strong>of</strong> their relative abundance; the thinner lie<br />
indicates the function expected on the basis <strong>of</strong> a consistent<br />
preference. (b) The effect <strong>of</strong> 'experience' on the success <strong>of</strong><br />
Notonecta in attacking Asellus. (After Lawton et al., 1974.)<br />
(Means <strong>and</strong> total ranges are indicated.)<br />
tubificid worms as prey (Fig. 5.5). Figure 5.5a shows<br />
that there was, indeed, switching by the guppies. But<br />
more interesting than this is Fig. 5.5b, which shows<br />
that although the population <strong>of</strong> predators showed little<br />
preference when <strong>of</strong>fered equal proportions <strong>of</strong> the two<br />
prey, the individual guppies showed considerable specialization.<br />
This does not contradict the idea <strong>of</strong> a<br />
search image, but does suggest that predator switching<br />
in a population does not result from individual<br />
predators gradually changing their preference, but<br />
from the proportion <strong>of</strong> specialists changing. Murdoch <strong>and</strong><br />
Oaten provide evidence for the occurrence <strong>of</strong> this type<br />
<strong>of</strong> switching in other vertebrate predators, in some
124 PART 2: INTERSPECIFIC INTERACTIONS<br />
Fig. 5.6 Seasonal changes in diet. The percentage<br />
contributions <strong>of</strong> different food types to the diet <strong>of</strong> the wood<br />
pigon Columba palumbus in Cambridgeshire, UK. (After<br />
Murton et al., 1964.)<br />
Fig. 5.5 (a) Switching in guppies fed on Drosophila <strong>and</strong><br />
tubificids (with total ranges indicated). (b) A frequency<br />
histogram showing the number <strong>of</strong> individual guppies with<br />
particular types <strong>of</strong> diet when <strong>of</strong>fered equal numbers <strong>of</strong> the<br />
two prey types. All showed a preference (< 0.4 or > 0.6)<br />
even though the population as a whole consumed<br />
approximately equal amounts <strong>of</strong> the two types. (After<br />
Murdoch & Oaten, 1975.)<br />
invertebrate predators, <strong>and</strong> in a herbivore: the feral<br />
pigeon feeding on peas <strong>and</strong> beans (Murton, 1971).<br />
Nevertheless, it is fair to conclude that this more<br />
complex type <strong>of</strong> food preference is most common in<br />
vertebrates, where the ability to learn from experience<br />
is most highly developed. The consequences <strong>of</strong> it are<br />
discussed in section 5.7.4.<br />
5.4 Time <strong>and</strong> timing<br />
In any discussion <strong>of</strong> predation there are several points<br />
that must be made regarding the effects <strong>of</strong> time <strong>and</strong><br />
timing. The first is that levels <strong>of</strong> specialization need not<br />
involve morphological adaptation, but may, in many<br />
cases, be the result <strong>of</strong> differing degrees <strong>of</strong> 'temporal'<br />
coincidence. Thus, the European rabbit flea (Spilopsyllus<br />
cuniculi), like very many parasites, has a life cycle<br />
that coincides more or less exactly with that <strong>of</strong> its host:<br />
maturation <strong>of</strong> the flea can only occur on a doe in the<br />
latter part <strong>of</strong> pregnancy, <strong>and</strong> eggs are laid only on the<br />
newborn rabbit young (Mead-Briggs & Rudge, 1960).<br />
The wood pigeon (Columba palumbus), by contrast,<br />
switches its food preference seasonally, depending on<br />
availability (Fig. 5.6: Murton et al., 1964). Thus, while<br />
it may, at any one time, be fairly specialized in its<br />
feeding habits, it is temporally (as well as morphdo-
CHAPTER 5: PREDATION 125<br />
gically) a generalist; <strong>and</strong>, unlike the parasite, its<br />
population dynamics are not strongly dependent on<br />
the availability <strong>of</strong> any one type <strong>of</strong> prey.<br />
Related to the effects <strong>of</strong> temporal coincidence are<br />
the effects <strong>of</strong> differing lengths <strong>of</strong> life cycle amongst<br />
predators <strong>and</strong> their prey. Aphids, for instance, generally<br />
pass through several generations for each time<br />
their host plant passes through a seasonal cycle (never<br />
mind a generation). They can, therefore, be expected<br />
to react quickly towards, <strong>and</strong> fairly accurately reflect,<br />
the quantity <strong>and</strong> quality <strong>of</strong> their food. Conversely, the<br />
dynamics <strong>of</strong> a sycamore population is unlikely to be<br />
greatly influenced by the intraseasonal fluctuations in<br />
the abundance <strong>of</strong> its aphids. Similarly, small mammals,<br />
with a fairly high intrinsic rate <strong>of</strong> increase <strong>and</strong> a<br />
life span never exceeding a year, exhibit a pattern <strong>of</strong><br />
abundance that reflects the yearly changes in environmental<br />
quality; while tawny owls in the same habitat,<br />
<strong>of</strong>ten living 6 years <strong>and</strong> failing to breed when food is<br />
scarce, maintain a comparative constancy <strong>of</strong> abundance<br />
irrespective <strong>of</strong> these environmental fluctuations<br />
(Southern, 1 970).<br />
Iin part such 'discrepancies' are the result <strong>of</strong> making<br />
connparisons on an artificial, yearly basis, when it<br />
might be more appropriate to consider the fluctuations<br />
from generation to generation. Nevertheless, it is<br />
quite clear that generation times, <strong>and</strong> in particular the<br />
relative generation times <strong>of</strong> a 'predator' <strong>and</strong> its 'prey',<br />
can have important effects on predator-prey dynamics<br />
through their influence on the speeds at which<br />
species respond to changes in the environment.<br />
Another aspect <strong>of</strong> timing relevant to predator-prey<br />
dynamics is the effect <strong>of</strong> time-lags. We have already<br />
seen (in section 3.4.1) that time-lags tend to cause<br />
increased levels <strong>of</strong> fluctuation in dynamic systems (i.e.<br />
they tend to destabilize systems), <strong>and</strong> we can expect<br />
this to apply to populations <strong>of</strong> predators <strong>and</strong> their<br />
prey. Once again, populations with discrete generations<br />
will tend to oscillate in numbers more than<br />
populations breeding continuously; but there is, in a<br />
sense, an additional reinforcement <strong>of</strong> such time-lags<br />
in predator-prey systems. In section 3.4.1 we were<br />
considering systems in which the food resource remains<br />
constant in size (as evidenced by the constancy<br />
<strong>of</strong> the single species' carrying capacity). Now we are<br />
dealing with systems in which both consumer <strong>and</strong> food<br />
contribute to the effects <strong>of</strong> any time-lags. There is,<br />
consequently, a tendency for populations <strong>of</strong> predators<br />
<strong>and</strong> their prey to fluctuate out <strong>of</strong> phase with one<br />
another, <strong>and</strong> it is essentially this that leads to the<br />
'naive expectation' <strong>of</strong> coupled predator-prey oscillations<br />
outlined in section 5 .l. Varley (1947) coined a<br />
special term-delayed density-dependence-to describe<br />
such a relationship between predation-rate <strong>and</strong><br />
prey density.<br />
5.5 Effects on prey fitness<br />
Turning to this next component, we can note that<br />
when predators <strong>and</strong> prey interact, the fitness <strong>of</strong> prey<br />
individuals is obviously affected by the predators, but<br />
it is also influenced by the prey themselves through<br />
the density-dependent process <strong>of</strong> intraspecific competition.<br />
As Chapters 1-3 made clear, this will tend to<br />
regulate the size <strong>of</strong> a single-species prey population,<br />
but in so doing it will also tend to stabilize the<br />
interaction between the prey <strong>and</strong> their predators. Prey<br />
populations reduced by their predators will experience<br />
a compensatory decline in the depressant effects <strong>of</strong><br />
intraspecific competition; while those that grow large<br />
through the rarity <strong>of</strong> predators will suffer the consequences<br />
<strong>of</strong> intraspecific competition all the more<br />
intensely.<br />
The most important effects on prey fitness in the<br />
present context, however, are attributable to predators.<br />
These can be most easily described in the case <strong>of</strong><br />
parasitoids <strong>and</strong> their hosts: a host which is successfully<br />
attacked dies-its fitness is reduced to zero. It<br />
might appear, moreover, that the effects <strong>of</strong> true<br />
predators on their prey are equally straightforward<strong>and</strong><br />
they <strong>of</strong>ten are. But consider, by contrast, the work<br />
<strong>of</strong> Errington (1946). Errington made a long <strong>and</strong><br />
intensive study <strong>of</strong> populations <strong>of</strong> the musk-rat (Ondatra<br />
zibethicus) in the north-central USA. He took<br />
censuses, recorded mortalities <strong>and</strong> movements, followed<br />
the fates <strong>of</strong> individual litters, <strong>and</strong> was particularly<br />
concerned with predation on the musk-rat by the<br />
mink (Mustela vison). He found that adult musk-rats<br />
that were well established in a breeding territory were<br />
largely free from mink predation; but those that were
126 PART 2: INTERSPECIFIC INTERACTIONS<br />
Fig. 5.7 The relationship between the rate <strong>of</strong> infection <strong>of</strong><br />
the water bug Hydrometra myrae (host) with the mite<br />
Hydrgphantes tenuabilis (parasite) <strong>and</strong> (a) host survival,<br />
(b) host life expectancy, (c) host maturity, (d) host fecundity,<br />
<strong>and</strong> (e) host rate <strong>of</strong> increase. (After Lanciani, 1975.)<br />
w<strong>and</strong>ering without a territory, or were exposed by<br />
drought, or injured in intraspecific fights were very<br />
frequently preyed upon. Certainly, those that were<br />
killed had their fitness reduced to zero. Yet, because<br />
these were individuals that were unlikely to ever<br />
produce <strong>of</strong>fspring, they had low or zero fitnesses<br />
anyway. Similar results have been obtained, in fact,<br />
for predation on other vertebrates. Those most likely<br />
to succumb are the young, the homeless, the sick <strong>and</strong><br />
the decrepit-the very individuals whose immediate<br />
prospects <strong>of</strong> producing <strong>of</strong>fspring are worst. The hannful<br />
effects on the prey population are clearly not as<br />
drastic as they might be; <strong>and</strong> while the effects <strong>of</strong> true<br />
predators on their prey are <strong>of</strong>ten straightforward,<br />
there are obviously cases, particularly amongst vertebrates,<br />
in which the superficial simplicity can be<br />
misleading. In particular, a predator that effectively<br />
ignores the potential contributors to the next prey<br />
generation will have very little effect on prey abundance.<br />
Nevertheless, it is possible in both true predators<br />
<strong>and</strong> parasitoids to equate the predation-rate in a<br />
population with the prey death-rate; the difficulty is<br />
that prey death does not always lead to simple<br />
reductions in the overall vitality <strong>of</strong> the prey popula-<br />
tion. Conversely with parasites it is well known that<br />
the effects on the host are <strong>of</strong>ten not drastic (though, <strong>of</strong><br />
course, to conform with the definition in section 5 .l,<br />
<strong>and</strong> thus warrant inclusion in this chapter, the parasite<br />
must have some adverse effect on its host's<br />
fitness). 'Predation-rate' in parasites, therefore, cannot<br />
be equated with host death-rate. Instead, it can be<br />
taken as the rate at which host tissue <strong>and</strong> energy is<br />
diverted from hosts to parasites.<br />
Predation-rate in parasites, then, is obviously lilkely<br />
to increase with increases in the mean number <strong>of</strong><br />
parasites per host; <strong>and</strong> the effect this can have on host<br />
fitness is depicted in Fig. 5.7, illustrating the work <strong>of</strong><br />
Lanciani (1975) on the ectoparasitic mite, Hydryphantes<br />
tenuabilis, <strong>and</strong> its host, the water bug Hydrometra<br />
myrae. It is clear from Fig. 5.7a & 5.7b that<br />
the mite affects the survival <strong>of</strong> its host, <strong>and</strong> from<br />
Fig. 5.7~ & 5.7d that it affects its host's fecundity.<br />
Taken all in all, therefore, the mite affects the host's<br />
reproductive potential (Fig. 5.7e), <strong>and</strong> this effect increases<br />
with increasing intensity <strong>of</strong> infection. In other<br />
words, the greater the proportion <strong>of</strong> parasites to hosts,<br />
the greater their depressant effect will be; there is<br />
inverse density-dependence tending to destabilize the<br />
host-parasite interaction.<br />
5.5.1 The effects <strong>of</strong> herbivores on plant fitness<br />
Being primary producers, plants provide food resources<br />
<strong>and</strong> are prey to the attentions <strong>of</strong> herbivores.<br />
Careful examination <strong>of</strong> natural populations <strong>of</strong> plants
CHAPTER 5: PREDATION 127<br />
frequently reveals individuals bearing leaves or stems<br />
that have been trimmed <strong>and</strong> seeds that are bored or<br />
cracked open. Such evidence, moreover, may only be<br />
conspicuous at particular phases in the life cycle <strong>of</strong> a<br />
plant species. In considering the effects on plants <strong>of</strong><br />
animals that eat them it is useful to recognize a<br />
continuum. At one end, the effect may be the immediate<br />
death <strong>of</strong> the individual plant or seed because <strong>of</strong><br />
(almost) entire consumption; whilst at the other the<br />
effect may be the removal <strong>of</strong> plant parts with the<br />
donor remaining alive <strong>and</strong> apparently unaffected in<br />
terms <strong>of</strong> its sgrvival <strong>and</strong> fecundity. In a simple<br />
classification we can thus distinguish between, on the<br />
one h<strong>and</strong>, true predators such as granivorous ants<br />
(Chapter 2) <strong>and</strong> frugivorous bats, <strong>and</strong> on the other<br />
h<strong>and</strong> grazers such as caterpillars that characteristically<br />
tend to leave plant meristems from which plant<br />
regrowth can occur. Between these end-points lies an<br />
array <strong>of</strong> herbivore effects that may precipitate the<br />
earlier death <strong>of</strong> an individual than would otherwise<br />
occur. We might, for instance envisage a plant pathogen<br />
reducing the photosynthetic area <strong>of</strong> an individual<br />
to such a degree that its ability to compete with<br />
neighbours is lowered <strong>and</strong> its death hastened.<br />
To seed-eating animals, the crops <strong>of</strong> seed represent<br />
a source <strong>of</strong> highly nutritious food, which is packaged<br />
in a discrete, compact way; <strong>and</strong> it would be easy to<br />
argue that each seed eaten represents a measurable<br />
reduction in fitness, since it constitutes the death <strong>of</strong> a<br />
whole individual. It is perhaps more valid, however, to<br />
consider not the fitness <strong>of</strong> the seeds themselves, but<br />
the fitness <strong>of</strong> the parent that produced them. We can<br />
see, for instance, in the related case <strong>of</strong> fruit-eating<br />
herbivores, that although a significant quantity <strong>of</strong><br />
plant material is lost with every fruit eaten, <strong>and</strong> many<br />
seeds (i.e. individuals) are destroyed in the process, the<br />
herbivore by acting as an essential agent <strong>of</strong> seed<br />
digpersal is, from them parent plant's point <strong>of</strong> view, a<br />
net contributor to fitness. (Similar comments apply to<br />
animal pollinators.) And while the situation is not<br />
quite so clear-cut in the case <strong>of</strong> specialist seed-eaters,<br />
there is certainly some evidence to suggest that a<br />
parent plant's fitness is not incrementally reduced<br />
each time one <strong>of</strong> its seeds is eaten.<br />
Lawrence <strong>and</strong> Rediske (1962). for instance. moni-<br />
tored the fates <strong>of</strong> experimentally sown Douglas fir<br />
seeds, both in open plots <strong>and</strong> in plots supposedly<br />
screened from the attacks <strong>of</strong> vertebrate herbivores.<br />
Their results (Table 5.3) indicate that their screening<br />
was effective in that vertebrate granivores were largely<br />
excluded; but they also illustrate two further points.<br />
The first is that these herbivores do, indeed, appear to<br />
have an effect on parental output, since the recruitment<br />
<strong>of</strong> seedlings, 1 year after germination, was<br />
significantly increased in their absence. The second<br />
point, however, is that this effect is rather less than<br />
might be expected from a consideration <strong>of</strong> vertebrate<br />
granivores alone. Other sources <strong>of</strong> mortality, particularly<br />
fungal attack at various stages, appear to act in a<br />
density-dependent, compensatory fashion. Thus the<br />
Table 5.3 Compensatory mortality when predation is<br />
prevented. The fates, in percentage terms, <strong>of</strong> Douglas fir<br />
seeds sown in open <strong>and</strong> screened plots. (After Lawrence &<br />
Rediske, 1962.)
128 PART 2: INTERSPECIFIC INTERACTIONS<br />
herbivores, like the minks preying on Errington's<br />
musk-rats, are, to some extent, removing individuals<br />
that are already doomed.<br />
We have, <strong>of</strong> course, already met a similar example<br />
<strong>of</strong> granivory in section 4.3: Brown <strong>and</strong> Davidson's<br />
(1977) granivorous ants tended to consume seeds that<br />
would otherwise have been taken by rodents, <strong>and</strong> vice<br />
versa. Yet the two guilds, together, caused a measurable<br />
reduction in the size <strong>of</strong> the seed population; <strong>and</strong><br />
since germination <strong>and</strong> subsequent establishment depends<br />
on the occupation <strong>of</strong> a favourable microsite<br />
(which is largely a matter <strong>of</strong> chance), this, in turn,<br />
must have caused a reduction in the size <strong>of</strong> the<br />
populations <strong>of</strong> adult plants in subsequent generations.<br />
Granivores seem, therefore, to adversely affect plants,<br />
but not necessarily to the extent suggested by superficial<br />
examination. The attractive hypothesis that dispersal<br />
<strong>of</strong> seeds by ants to improved soil close to ant<br />
nests has little support from field studies (Rice &<br />
Westoby, 1988).<br />
When we turn from seeds <strong>and</strong> fruits to seedlings<br />
<strong>and</strong> adult plants, the assessment <strong>of</strong> herbivore damage<br />
becomes, if anything, more difficult. The range <strong>of</strong><br />
responses <strong>of</strong> growing plants (Table 5.4) in general to<br />
the effects <strong>of</strong> herbivores is considerable <strong>and</strong> has been<br />
the subject <strong>of</strong> substantial research interest not least for<br />
weed biocontrol (Crawley, 1989).<br />
At first sight it might be argued that all <strong>of</strong> the<br />
responses illustrated in Table 5.4 will automatically<br />
lead to fitness reductions. For instance metabolic<br />
energy <strong>and</strong> resources diverted towards chemical or<br />
mechanical defence might otherwise be used for<br />
growth <strong>and</strong> enhanced survival, <strong>and</strong> changes in rate <strong>of</strong><br />
development <strong>and</strong> re-allocation <strong>of</strong> resources may lead<br />
to reduced fecundity. However, we need to view such<br />
responses in context <strong>of</strong> (i) the coevolution <strong>of</strong> a plant<br />
species <strong>and</strong> its herbivores; <strong>and</strong> (ii) knowledge <strong>of</strong> the<br />
key factors acting at each stage in the plant's life cycle<br />
that operate in a density-dependent, regulatory manner.<br />
Coevolution might be expected to select for more<br />
tolerant plants, less damaging herbivores <strong>and</strong> more<br />
specialist relationships. McNaughton (1983) has proposed<br />
that the long-term evolution <strong>of</strong> plants <strong>and</strong><br />
herbivores has led to two major groups <strong>of</strong> terrestrial<br />
Table 5.4 Some examples <strong>of</strong> plant responses to herbivory<br />
plants classified according to 'fundamental botanical<br />
attributes, the nature <strong>of</strong> their present herbivore fauna,<br />
<strong>and</strong> the apparent nature <strong>of</strong> their long-term coevolutionary<br />
relationships with herbivores'. One group,<br />
comprising mainly the monocotyledons exhibit<br />
growth forms that are likely evolutionary responses to<br />
grazing by mammals <strong>and</strong> orthopterans; plant species<br />
may possess short-lived repeating modular units with<br />
basal meristems, have high capacity for clonal reproduction<br />
<strong>and</strong> possess general physical defence mechanisms.<br />
The other group (consisting <strong>of</strong> gymnosperms,<br />
dicotyledons <strong>and</strong> non-graminoid monocotyledons)<br />
possess more elaborate growth forms, develop from<br />
apical rather than basal meristems <strong>and</strong> commonly<br />
display toxic specialist chemical defences, recent evolution<br />
having been in association with herbivorous<br />
insect taxa. In evolutionary terms then, present<br />
observable plant responses may reflect fitness
CHAPTER 5: PREDATION 129<br />
advantages accrued in response to past selection by<br />
herbivores.<br />
On ecological time scales there is evidence for<br />
indisputable fitness reduction in some instances.<br />
Haines (1979, for instance, obtained frequency distributions<br />
<strong>of</strong> seedling populations in different areas<br />
whilst investigating the activities <strong>of</strong> leaf-cutting ants<br />
(Atta colombica tonsipes). (These ants cut leaf, flower<br />
<strong>and</strong> fmit material, which is then transported to their<br />
nests where the harvested plant material is decomposed<br />
by a fungus. The fungus is eaten by the ants,<br />
<strong>and</strong> the degraded plant remains dumped at 'refuse<br />
.tips1.) The survivorship <strong>and</strong> size <strong>of</strong> seedlings <strong>of</strong> forest<br />
plants are inversely related to the freqeuncy <strong>of</strong> visitation<br />
by the ants (Fig. 5.8). Seedlings in parts <strong>of</strong> the<br />
forest away from nests <strong>and</strong> dumps are present in all<br />
size-classes, but on the nests <strong>and</strong> dumps themselves<br />
most <strong>of</strong> the seedlings present are very small. Thus, the<br />
chance <strong>of</strong> a seedling maturing into the forest canopy<br />
appears to be zero if it arises in areas regularly<br />
frequented by ants. It is, however, unusual for insect<br />
herbivores to cause the death <strong>of</strong> perennial established<br />
plants except in the cases <strong>of</strong> the deliberate introduction<br />
<strong>of</strong> biological control (Crawley, 1989).<br />
Much more common than the destruction <strong>of</strong> whole<br />
plants is loss <strong>of</strong> stems or leaves. The consequences <strong>of</strong><br />
partial defoliation to the subsequent survivorship <strong>of</strong> a<br />
plant are generally difficult to unravel, while the<br />
demonstration <strong>of</strong> proximate death by defoliation is<br />
<strong>of</strong>ten elusive.<br />
This is because a frequent effect <strong>of</strong> partial defoliation<br />
is to disturb the integrated nature <strong>of</strong> the whole<br />
physiology <strong>of</strong> the plant. Loss <strong>of</strong> leaf means not only the<br />
loss <strong>of</strong> photosynthetic area, but also the mobilization<br />
<strong>of</strong> stored reserves for leaf replacement through bud<br />
growth; new growth dem<strong>and</strong>s protein, carbohydrate<br />
<strong>and</strong> minerals-the high quality components required<br />
by predators. Thus, persistent defoliation <strong>of</strong> young,<br />
actively growing leaves may constitute a rapid drain <strong>of</strong><br />
stored reserves. Moreover, such changes in physiology<br />
may result in an alteration in the rate <strong>of</strong> root growth, fig. 5.8 Seedhs do not survive to a large size in the<br />
presence <strong>of</strong> ants. The size-structure <strong>of</strong> seedling populations<br />
<strong>and</strong> in some cases in root dieback.<br />
in tropical rainforests on nests <strong>and</strong> refuse dumps <strong>of</strong> leaf-<br />
* particular feature <strong>of</strong> 'pecies that grazing cutting - ants Atta colombica fonsipes <strong>and</strong> on forest soil. The<br />
is the ability to quickly restore the root to shoot ratios density <strong>of</strong> seedling height classes are presented. (Data from<br />
(in biomass) present before grazing started (Piper & Haines, 1975.)
130 PART 2: INTERSPECIFIC INTERACTIONS<br />
Weiss, 1993). Some species are able to increase<br />
photosynthesis in the remaining plant in response to<br />
defoliation (Gold & Caldwell, 1989) <strong>and</strong> defoliated<br />
plants therefore show a higher relative growth-rate<br />
than undefoliated ones. In some cases the increased<br />
net primary production can exceed that <strong>of</strong> control<br />
plants, in which case the response has been described<br />
as 'overcompensatory', in contrast to those where the<br />
net rate is decreased ('undercompensatory'-Archer &<br />
Tieszen, 1983). When such production results in the<br />
development <strong>of</strong> new potentially autonomous plants<br />
(e.g. shoots in perennials) or overall larger plant size<br />
the response has been described as 'herbivore increased<br />
fitness'. However there is (i) no clear consensus<br />
on the spectrum <strong>of</strong> plant regrowth patterns that<br />
may occur in response to grazing <strong>and</strong> certainly such<br />
responses are dependent on both defoliation history<br />
<strong>and</strong> environment; <strong>and</strong> (ii) whilst there has been<br />
considerable debate that herbivory in principle could<br />
increase plant fitness the available evidence suggests<br />
that it does not (Belsky, 1986). What is clear is that<br />
reductions in photosynthetic area, root volume <strong>and</strong><br />
stored reserves necessarily place a defoliated individual<br />
at a disadvantage in any competitive struggle-a<br />
disadvantage that would obviously be intensified still<br />
further if buds, the regenerative organs, were subject<br />
to predation as well. Competitive disadvantage will<br />
result in reduced plant size (see below) which in<br />
return will be reflected in fecundity (Rees & Crawley,<br />
1989). The low levels <strong>of</strong> defoliation that have been<br />
observed in natural woodl<strong>and</strong>s has <strong>of</strong>ten been assumed<br />
to have negligible effects on plant fecundity<br />
because <strong>of</strong> plant compensatory growth processes. To<br />
test this, Crawley (1985) examined matched pairs <strong>of</strong><br />
oak (Quercus robur) trees over 4 years; in each pair one<br />
tree was regularly sprayed with insecticide to kill all<br />
defoliating <strong>and</strong> sap-sucking insects <strong>and</strong> the other was<br />
sprayed with water. He showed that whilst tree<br />
growth (girth) was unaffected by insect exclusion <strong>and</strong><br />
unsprayed trees lost only 8-12% <strong>of</strong> their leaf area,<br />
sprayed trees consistently produced more seeds (2.5-<br />
4.5-fold) than unsprayed ones.<br />
Defoliation may thus have important repercussions<br />
on seed production but the time <strong>and</strong> frequency at<br />
which it occurs is also important. Regular removal <strong>of</strong><br />
vegetative growth in perennial plants tends to reduce<br />
flowering, but the time at which defoliation occurs is<br />
critical in determining the actual response <strong>of</strong> the<br />
plant. If the inflorescence is formed prior to defoliation,<br />
the response to leaf removal is seed abortion, or<br />
for individual seeds to be smaller; whereas defoliation<br />
before inflorescence production is likely to halt or<br />
severely constrain flower formation. Flower loss itself<br />
by insect attack or very high aphid infestations may<br />
severely reduce seed production.<br />
Some plant predators do not defoliate their host, but<br />
extract food requirements from within the plant. The<br />
detailed work <strong>of</strong> Dion (1971a, b), for instance, has<br />
clearly demonstrated that aphid infestations on lime<br />
saplings cause at least a 10-fold reduction in the rate<br />
<strong>of</strong> total dry weight increase (from 7.7 down to 0.6 g<br />
week-'), even though average <strong>and</strong> total leaf area per<br />
sapling remained unaltered. Yet, examination <strong>of</strong> the<br />
root systems <strong>of</strong> the infested plants revealed that no<br />
growth had occurred below ground subsequent to<br />
infestation; <strong>and</strong> the energetics <strong>of</strong> this interaction<br />
suggest that, on average, 30 aphids per leaf during the<br />
growing season is sufficient to completely drain the<br />
annual net production <strong>of</strong> the tree. This average is<br />
obviously an oversimplification, but the figure agrees<br />
reasonably well with observed natural aphid densities<br />
(Dixon, 1971b), implying that although they cause no<br />
immediate visual damage, aphids may substantially<br />
limit the growth <strong>of</strong> lime trees, <strong>and</strong> they may, in<br />
consequence, affect survivorship.<br />
Evidence from exclusion experiments point strongly<br />
to the indirect effects <strong>of</strong> herbivory leading to altered<br />
competitive abilities in plant communities. From a<br />
range <strong>of</strong> field studies Crawley (1989) concluded that in<br />
almost all cases the dominant plant species in a<br />
natural community was changed after the deliberate<br />
exclusion <strong>of</strong> vertebrate herbivores accompaniedl by<br />
detectable changes in relative plant abundance; but<br />
much less so in studies <strong>of</strong> insect exclusion.<br />
However, very few critical experiments have been<br />
conducted to examine the change in competitive<br />
interactions amongst plants experiencing herbivory.<br />
In one such study Weiner (1993) deliberately manipulated<br />
both herbivore (the snail, Helix aspersa) <strong>and</strong><br />
plant (Hypocharis radicata) density in an experimental
CHAPTER 5: PREDATION 131<br />
system. Predictably, mean plant size diminished with<br />
increasing plant density in the absence <strong>of</strong> herbivory,<br />
indicating intraspecific competition in the plant population.<br />
Moreover, mean plant size was further reduced<br />
by snail herbivory, the more so the higher the density<br />
<strong>of</strong> snails, but to the same proportional extent at each<br />
plant density (i.e. there was no interaction between<br />
herbivore <strong>and</strong> plant population density). Increasing<br />
herbivore density did, however, reduce the number <strong>of</strong><br />
plants surviving to the end <strong>of</strong> the experiment, mortality<br />
being most marked at high herbivore <strong>and</strong> plant<br />
densities. The most conspicuous effects were, however,<br />
seen in the size distribution <strong>of</strong> plants. At low<br />
plant density, herbivory reduced the size <strong>of</strong> many<br />
individuals without influencing the larger plants,<br />
causing an increase in the inequality <strong>of</strong> plant sizes in<br />
the population. But at high plant density, the main<br />
effect <strong>of</strong> snails was a reduction in surviving plant<br />
density with relatively little effect on plant size variation.<br />
This one example illustrates some <strong>of</strong> the subtle<br />
effects <strong>of</strong> herbivory on plants competing in monocultures.<br />
If intraplant competition is intense <strong>and</strong> asymmetric<br />
(Chapter 2) herbivory may reduce competition<br />
<strong>and</strong> restrict (or decrease) the resulting size variability<br />
that asymmetric competition generates. However, if<br />
herbivore attack is size-dependent, then it may amplify<br />
asymmetric competitive interactions amongst<br />
plants surviving herbivory. (Weiner observed that<br />
snails did not feed on large plants grown in isolation<br />
reflecting their aversion to feeding in a low cover<br />
environment .)<br />
At the present time it remains impossible to generalize<br />
on the effects <strong>of</strong> herbivores on competitive<br />
interactions in plant populations due to the lack <strong>of</strong><br />
detailed experimental study; empirical observations<br />
on community changes (Harper, 1977) <strong>and</strong> theoretical<br />
studies (Crawley & Pacala, 1991) strongly suggest that<br />
changes in competitive ability may well be mediated<br />
by herbivores but the precise processes remain hidden.<br />
Overall, therefore, we can see that there is ample<br />
evidence to suggest that the effects <strong>of</strong> herbivores on<br />
both seeds <strong>and</strong> growing plants may be substantial.<br />
The extent to which plant fitness is altered by herbivores,<br />
<strong>and</strong> in turn herbivory, acts as a regulating<br />
factor in plant population dynamics remains to be<br />
unequivocally demonstrated.<br />
5.6 The effects <strong>of</strong> predation-rate on<br />
predator fitness<br />
5.6.1 Thresholds<br />
The effects <strong>of</strong> predation-rate on predator fitness-like<br />
the effects <strong>of</strong> predation-rate on prey fitness-appear,<br />
superficially, to be straightforward; <strong>and</strong> in the case <strong>of</strong><br />
parasitoids they certainly are: every host successfully<br />
attacked by a parasitoid represents an incremental<br />
increase in parasitoid fitness. In all other cases,<br />
however, there is an added complication. Predators,<br />
herbivores <strong>and</strong> parasites all require a certain quantity<br />
<strong>of</strong> 'prey' tissue for basic maintenance; <strong>and</strong> it is only<br />
when their intake exceeds this threshold that increases<br />
in predation-rate lead to measurably increased<br />
benefits to the predator. This is illustrated with typical<br />
examples in Fig. 5.9a (predator growth-rate) <strong>and</strong><br />
Fig. 5.9b (predator fecundity). The consequences <strong>of</strong><br />
this threshold for the stability <strong>of</strong> predator-prey interactions<br />
are fairly obvious. There is a tendency at low<br />
prey densities for predation-rate to fall below the<br />
threshold, causing predator fitness to slump to zero.<br />
The adverse effects <strong>of</strong> low prey density on predator<br />
Fig. 5.9 Prey thresholds for predators. (a) Growth in the<br />
spider Linyphia triangularis (Turnbull, 1962).<br />
(b) Reproduction in the water flea Daphnia pulex var.<br />
pulicaria (Richman, 1958). (After Hassell, 1978.) 1 calorie<br />
(non-SI unit) = 4.186 joules.
132 PART 2: INTERSPECIFIC INTERACTIONS<br />
fitness are, therefore, exaggerated, <strong>and</strong> the interaction<br />
generally is destabilized.<br />
5.6.2 Food quality<br />
There is another factor complicating the relationship<br />
between predation-rate <strong>and</strong> the fecundity <strong>and</strong> survivorship<br />
<strong>of</strong> predators, however, which itself is <strong>of</strong><br />
greater importance, namely food quality. It is not the<br />
case that each item (or even each gram) <strong>of</strong> food<br />
consumed by a predator or herbivore is equivalent.<br />
The chemical composition <strong>of</strong> food, <strong>and</strong> its accessibility<br />
via digestion to the predator, both have a considerable<br />
bearing on the way in which food consumption affects<br />
predators. This is particularly apparent amongst herbivores<br />
(see White, 1978; Lawton & McNeill, 1979).<br />
In particular, herbivores are greatly affected by the<br />
nitrogen content <strong>of</strong> their food. One has only to<br />
consider the honeydew (excess carbohydrate) excreted<br />
by aphids, to realize that many herbivores must ingest<br />
vast quantities <strong>of</strong> plant tissue in order to consume<br />
sufficient amounts <strong>of</strong> amino acids. Moreover, there is<br />
good evidence that herbivore abundance can be limited<br />
by nitrogen content (i.e. food quality). Many<br />
herbivores only have access to low quality food, <strong>and</strong><br />
they have insufficient time <strong>and</strong> energy to digest<br />
enough <strong>of</strong> this to provide them with protein for<br />
maintenance, let alone growth <strong>and</strong> reproduction. This<br />
was shown, for instance, by Sinclair (1975) who noted<br />
the protein content <strong>of</strong> the food available to the<br />
wildebeest in Serengeti (Tanzania) during 1971, <strong>and</strong><br />
compared this with the protein content <strong>of</strong> the food<br />
they ate (Fig. 5.10a). He also monitored (Fig. 5 .lob)<br />
the fat reserves in the bone marrow <strong>of</strong> live males, <strong>and</strong><br />
<strong>of</strong> males that died <strong>of</strong> natural causes (these reserves<br />
being the last to be utilized).<br />
It is clear from Sinclair's results that, despite selecting<br />
nitrogen-rich plants <strong>and</strong> plant-parts, the wildebeests<br />
consumed food in the dry season which was<br />
below the level necessary even for maintenance (5-6%<br />
crude protein); <strong>and</strong>, to judge by the depleted fat<br />
reserves <strong>of</strong> dead males, this was an important cause <strong>of</strong><br />
mortality. Moreover, when we consider that during<br />
late-pregnancy <strong>and</strong> lactation (December-May in the<br />
wildebeest) the food requirements <strong>of</strong> females are three<br />
Fig. 5.10 (a) The quality <strong>of</strong> food measured as crude protein<br />
available to (0) <strong>and</strong> eaten by (0) wildebeest in the Serengeti<br />
during 1971. During the dry season, food quality fell below<br />
the level for nitrogen balance (5-6% crude protein) despite<br />
selection. (b) The fat content <strong>of</strong> the bone marrow <strong>of</strong> the live<br />
male population (0) <strong>and</strong> those found dead from natural<br />
cases (a). Vertical lines, where present, are 95% confidence<br />
limits. (After Sinclair, 1975 .)<br />
or four times the normal (Agricultural Research Council,<br />
1965), it becomes obvious that shortage <strong>of</strong> high<br />
quality food can have drastic effects on herbivores.<br />
A similar conclusion can be drawn from the work <strong>of</strong><br />
McNeill (in McNeill & Southwood, 1978). As Fig. 5 .l 1<br />
shows, seasonal peaks in the densities <strong>of</strong> insects<br />
feeding on the grass Hotcus mollis are related to peaks<br />
in food quality (measured as soluble nitrogen) in the<br />
leaves <strong>and</strong> stems-the latter approximating phloem<br />
flows to the flowers <strong>and</strong> developing seeds in the<br />
middle <strong>of</strong> the summer. Once again, food quality
CHAPTER 5: PREDATION 133<br />
Fig. 5.11 Seasonal changes in the mean numbers <strong>of</strong> insects<br />
on the grass Hobs mollis related to changes in food quality<br />
in the leaves <strong>and</strong> stems (McNeill & Southwood, 1978).<br />
(After Lawton & McNeill, 1979.)<br />
appears to be having an extremely important effect on<br />
predators.<br />
Moreover, plant quality does not only affect herbivores<br />
because <strong>of</strong> what plants lack (in terms <strong>of</strong> nutrients),<br />
but also because <strong>of</strong> the toxic or digestibilityreducing<br />
compounds~ that many plants<br />
contain by way <strong>of</strong> protection. However, while this may<br />
have an imp<strong>of</strong>imt evolutionaly effect on herbivores,<br />
causing them to specialize, it presumably has relatively<br />
little effect on those herbivores that are specificalky<br />
adapted to feed on the plants producing these<br />
compounds (Lawton & McNeill, 1979).<br />
Fig. 5.12 The functional response <strong>of</strong> tenth-instar damselfly<br />
larvae to Daphnia <strong>of</strong> approximately constant size. (After<br />
Thompson, 1975.)<br />
tenth-instar larvae <strong>of</strong> the damselfly Ischnura elegans<br />
(Thompson, 1975). Figure 5.12 clearly shows that, as<br />
prey density increases, the predation-rate responds<br />
less <strong>and</strong> less <strong>and</strong> approaches a plateau (approximately<br />
16 Daphnia per 24-hour period). A similar result is<br />
show" in Fig. 5.13 for a herbivore: slugs feeding on<br />
L0liurn Perenne (Hatto & Harper* 1969). Such functional<br />
<strong>of</strong> predators to changes in Prey<br />
density were described first by Sobmon (1949), but<br />
discussed more extensively by Holling (l959)~ who<br />
attributed the form taken by curves like the ones in<br />
5.7 The functional response <strong>of</strong> predators<br />
to prey availability<br />
5.7,l The 'type 2' response<br />
We now turn, for our next component, to the way in<br />
which the predation-rate <strong>of</strong> predators, herbivores or<br />
parasitoids is influenced by prey availability, <strong>and</strong> we<br />
begin with the simplest aspect <strong>of</strong> availability: prey<br />
A is in Fig. 5-13 The functional response <strong>of</strong> single slugs to changes<br />
Fig" 5-12, which depicts the numbers <strong>of</strong> Da~hnia (<strong>of</strong> a in the amounts <strong>of</strong> the grass Lolium perenne available to be<br />
particular size) eaten during a 24-hour period by eaten. (Data from Hatto & Harper, 1969.)
134 PART 2: INTERSPECIFIC INTERACTIONS<br />
Figs 5.12 <strong>and</strong> 5.13 (which he called 'type 2' responses)<br />
to the existence <strong>of</strong> the predator's h<strong>and</strong>ling time. (This, as<br />
we have seen, is the time the predator spends pursuing,<br />
subduing <strong>and</strong> consuming each prey item it finds, <strong>and</strong><br />
then preparing itself for further search.) Holling argued<br />
that as prey density increases, search becomes trivial,<br />
<strong>and</strong> h<strong>and</strong>ling takes up an increasing proportion <strong>of</strong> the<br />
predator's time. Thus, at high densities the predator<br />
effectively spends all <strong>of</strong> its time h<strong>and</strong>ling prey, <strong>and</strong> the<br />
predation-rate reaches a maximum, determined by the<br />
maximum number <strong>of</strong> h<strong>and</strong>ling times that can be fitted<br />
into the total time available.<br />
This view <strong>of</strong> the type 2 functional response is<br />
confirmed <strong>and</strong> illustrated in Fig. 5.14, which summa-<br />
Fig. 5.14 The functional responses <strong>of</strong> the ichneumonid<br />
parasitoid Pleolophus basizonus to changes in the density <strong>of</strong><br />
its host Neodiprion sertifer; arrows indicate maxima observed<br />
in the presence <strong>of</strong> excess hosts. (a) Parasitoids on their third<br />
day, <strong>and</strong> (b) parasitoids on their seventh day. (After<br />
Griffiths, 1969.)<br />
rizes some <strong>of</strong> the results obtained by Griffiths (1969) in<br />
his work on the ichneumonid Pleolophus basizonus<br />
parasitizing the cocoons <strong>of</strong> the European pine savvfly,<br />
Neodiprion sertifer. Taking parasitoids <strong>of</strong> different ages,<br />
GrifFiths plotted the number <strong>of</strong> ovipositions per parasitoid<br />
over a range <strong>of</strong> host densities, but he also<br />
calculated the actual maximum oviposition-rate by<br />
presenting other parasitoids <strong>of</strong> the same ages with a<br />
superabundant supply <strong>of</strong> host cocoons. It is clear from<br />
Fig. 5.14 that the type 2 functional response curves<br />
did indeed approach their appropriate maxima. Yet,<br />
while these maxima (<strong>of</strong> around 3.5 ovipositions day-')<br />
suggest a h<strong>and</strong>ling time <strong>of</strong> around 7 hours, further<br />
direct observation indicated that oviposition takes, on<br />
average, only 0.36 hours. The discrepancy is accounted<br />
for, however, by the existence <strong>of</strong> a 'refractory<br />
period' following oviposition during which there are<br />
no eggs ready to be laid. 'H<strong>and</strong>ling time', therefore,<br />
includes not only the time actually taken in oviposition,<br />
but also the time taken 'preparing' for the next<br />
oviposition. Similarly, the h<strong>and</strong>ling times suggested by<br />
the plateaux in Figs 5.12 <strong>and</strong> 5 .l 3 will almost certainly<br />
include time devoted to activities, peculiar to the<br />
darnselflies <strong>and</strong> slugs, other than the direct manipulation<br />
<strong>of</strong> food items. It is in this (non-literal) sense that<br />
h<strong>and</strong>ling time must be understood.<br />
A further point to note from-Fig. 5.14 is that, while<br />
the plateau level (<strong>and</strong> thus the h<strong>and</strong>ling time) remains<br />
approximately constant with increasing age, the rate<br />
<strong>of</strong> approach to that plateau is much more gradual in<br />
the younger parasitoids. In other words, it is apparent<br />
that the younger parasitoids search less efficiently, or<br />
attack at a slower rate. Thus, at low host densities<br />
they oviposit less <strong>of</strong>ten than their older conspecifics;<br />
but at high densities there is such. a ready supply <strong>of</strong><br />
hosts that even they are limited only by their h<strong>and</strong>ling<br />
time. Hence, the form taken by a type 2 functional<br />
response curve can be characterized simply in terns<br />
<strong>of</strong> a h<strong>and</strong>ling time <strong>and</strong> a searching efficiency (or attack<br />
rate); <strong>and</strong> Hassell (1978) discusses the methods by<br />
which these parameters can be obtained from the<br />
data. The value <strong>of</strong> estimating these parameters is<br />
illustrated by the work <strong>of</strong> Thompson (1975) who fed<br />
Daphnia <strong>of</strong> a variety <strong>of</strong> sizes to tenth-instar damselfly<br />
larvae (Fig. 5.15). Figure 5.15b shows that the various
CHAPTER 5: PREDATION 135<br />
Fig. 5.16 The functional response <strong>of</strong> Daphnia magna to<br />
different concentrations <strong>of</strong> the yeast Saccharomyces<br />
cerevisiae. (After Rigler, 1961 .)<br />
Fig. 5.15 (a) Functional responses <strong>of</strong> tenth-instar damselfly<br />
larvae to Daphnia <strong>of</strong> various sizes. Size A prey (0); B (0); C<br />
(H); ID (0); E (A). St<strong>and</strong>ard errors are fitted to the top line.<br />
(b) The attack-rates <strong>and</strong> h<strong>and</strong>ling times <strong>of</strong> these functional<br />
responses. (After Thompson, 1975.)<br />
functional responses in Fig. 5 .l 5a are the result <strong>of</strong> the<br />
ways in which both h<strong>and</strong>ling time <strong>and</strong> attack-rate<br />
change with prey size. It appears, quite reasonably,<br />
that damselfly larvae need more time to h<strong>and</strong>le larger<br />
prey, <strong>and</strong> that they are most efficient <strong>and</strong> effective at<br />
catching Daphnia <strong>of</strong> size D, with attack-rate declining<br />
rapidly as prey size increases.<br />
5.7.2 The 'type 1' response<br />
A Holling 'type 2' functional response is commonly<br />
observed in herbivore-plant, predator-prey <strong>and</strong><br />
parasitoid-host interactions. Much less common, by<br />
comparison, is his 'type 1' response, an example <strong>of</strong><br />
which is shown in Fig. 5.16. This figure describes<br />
work carried out by Rigler (1961) on the feeding-rate<br />
<strong>of</strong> Daphnia magna with the yeast Saccharomyces cerevisiae<br />
as it 'prey'. Daphnia magna is a filter feeder,<br />
extracting yeast cells at low density from a constant<br />
volume <strong>of</strong> water washed over its filtering apparatus.<br />
Below 105 yeast cells ml-l the predation-rate is<br />
directly proportional to the food concentration. But<br />
the Daphnia must also swallow (i.e. h<strong>and</strong>le) their food.<br />
At low concentrations this does not interfere with the<br />
predation-rate, because it happens sufficiently quickly<br />
to remove all the food accumulated by filtration.<br />
Above 105 cells ml-l however, the Daphnia are unable<br />
to swallow all the food they filter. At all such concentrations,<br />
therefore, they ingest food at a maximal rate,<br />
limited by their 'h<strong>and</strong>ling' time. The type 1 response<br />
is, therefore, an extreme form <strong>of</strong> the type 2 response in<br />
which the h<strong>and</strong>ling time exerts its effect not gradually<br />
but suddenly.<br />
It is important to note, in both the type 1 <strong>and</strong><br />
particularly the type 2 response, that the rate <strong>of</strong><br />
predation on the prey declines as prey density increases.<br />
This is, in other words, a case <strong>of</strong> inverse<br />
density-dependence (section 2.6), in which large prey<br />
populations suffer proportionately less mortality than<br />
small. The consequent effect on the predator-prey<br />
interaction is clearly destabilizing.
136 PART 2:\INTERSPECIFIC INTERACTIONS<br />
5.7.3 Variation in h<strong>and</strong>ling time <strong>and</strong> searching<br />
efficiency: 'type 3' responses<br />
It is instructive, at this point, to note explicitly the<br />
various components <strong>of</strong> the h<strong>and</strong>ling time <strong>and</strong> searching<br />
efficiency (following Holling, 1965, 1966). H<strong>and</strong>ling<br />
time is determined by:<br />
1 the time spent pursuing <strong>and</strong> subduing an individual<br />
prey;<br />
2 the time spent eating (or ovipositing in) each prey;<br />
<strong>and</strong><br />
3 the time spent resting or cleaning or fulfilling any<br />
other essential function (like digestion) prior to the act<br />
<strong>of</strong> predation itself.<br />
Searching efficiency (attack-rate) will depend on:<br />
1 the maximum distance at which a predator can<br />
initiate an attack on a prey;<br />
2 the proportion <strong>of</strong> these attacks that are successful;<br />
3 the speed <strong>of</strong> movement <strong>of</strong> the predator <strong>and</strong> prey<br />
(<strong>and</strong> thus their rate <strong>of</strong> encounter); <strong>and</strong><br />
4 the 'interest' taken by a predator in obtaining prey<br />
as opposed to fulfilling other essential activities.<br />
We have already seen that at least some <strong>of</strong> these<br />
components are likely to change with predator age<br />
(Griffiths, 1969; see Fig. 5.14) <strong>and</strong> prey size (Thompson,<br />
1975; see Fig. 5.15); <strong>and</strong> the length <strong>of</strong> time since<br />
the predator's last meal (its hunger) is also likely to<br />
modify its response (i.e. its 'interest' in food, <strong>and</strong> thus<br />
its attack-rate, will be altered). Of particular importance,<br />
however, is the way in which these components<br />
vary with prey density, or, more generally, relative<br />
<strong>and</strong> absolute prey availability.<br />
An example which effectively shows attack-rate<br />
varying with prey density is illustrated in Fig. 5 .l7a<br />
(Hassell et al., 1977): when host densities are low, the<br />
parasitoid Venturia canescens spends a relatively large<br />
proportion <strong>of</strong> its time in activities other than probing<br />
for larvae (see component 4 above). The consequence<br />
<strong>of</strong> this is shown in Fig. 5.17b (Takahashi, 1968). At<br />
low host densities, there is an upward sweep in the<br />
functional response curve (Fig. 5.17b, region A), because<br />
an increase in density elicits an increased<br />
amount <strong>of</strong> probing <strong>and</strong> thus an increased effective rate<br />
(Fig. 5.1 7a). Conversely, at higher host densities the<br />
attack-rate (as well as the h<strong>and</strong>ling time) is relatively<br />
Fig. 5.17 (a) The relationship between the time spent<br />
probing by Venturia canescens (as a percentage <strong>of</strong> total<br />
observation time) <strong>and</strong> the density <strong>of</strong> its host larvae Plodia<br />
interpunctella. (b) The sigmoid functional responses <strong>of</strong><br />
Venturia canescens parasitizing Cadra larvae <strong>of</strong> second (a),<br />
third (0) <strong>and</strong> fourth (A) instars (Takahashi, 1968). (After<br />
Hassell et al., 1977.) For further discussion, see text.<br />
constant, leading to the decrease in slope (region B)<br />
which is typical <strong>of</strong> a type 2 response. Overall, the<br />
resulting functional response is S-shaped or sigmoitdal,<br />
<strong>and</strong> is, in Holling's (1959) terminology, 'type 3'.<br />
Clearly it will occur whenever attack-rate increases or<br />
h<strong>and</strong>ling time decreases with increasing prey density.<br />
5.7.4 Switching <strong>and</strong> 'type 3' responses<br />
There are other (related) circumstances, however,
CHAPTER 5: PREDATION 137<br />
which will also lead to a type 3 functional response.<br />
These are the cases <strong>of</strong> predator switching considered<br />
in section 5.3 -2. The resemblance between Fig. 5 .l 7b<br />
<strong>and</strong> Fig. 5.4a <strong>and</strong> 5.5a is obvious. The major difference<br />
is that in the latter case there were two types <strong>of</strong><br />
prey (rather than one), so that the numbers <strong>of</strong> prey<br />
eaten varied with relative prey availability; we cannot<br />
be sure that a type 3 functional response would have<br />
resulted had the alternative prey been absent. Nevertheless,<br />
the effective result <strong>of</strong> predator switching is a<br />
type 3 functional response: the numbres <strong>of</strong> prey<br />
consumed varies with prey density in a sigmoidal<br />
fashion.<br />
Type 3 functional responses, then, resulting from<br />
switching or from changes in h<strong>and</strong>ling time or attacking<br />
efficiency, can occur in predators, parasitoids or<br />
herbivores; althogh it remains to be seen how common<br />
<strong>and</strong> widespread they are. Whenever <strong>and</strong> for<br />
whatever reason they occur, however, the effect on<br />
the stability <strong>of</strong> the interaction will be essentially the<br />
same. Throughout region A (Fig. 5.17btthe upwardsweeping<br />
part <strong>of</strong> the curve-increases in prey density<br />
lead to increases in the predation-pressure on the prey:<br />
the process is density-dependent. It can, therefore, have<br />
a potentially important stabilizing effect on the inter-<br />
action. The actual importance, however, depends on:<br />
1 the concavity <strong>of</strong> the curve in region A; <strong>and</strong><br />
2 the relevance <strong>of</strong> the prey densities in region A to a<br />
particular field (or laboratory) situation.<br />
5.8 Aggregated effects<br />
5.8.1 Parasite-host distributions<br />
It was established in section 5.3.2 that polyphagous<br />
predators, by exhibiting preferences, distribute their<br />
ill-effects unevenly between prey species. We turn<br />
now to the distribution <strong>of</strong> these ill-effects within a<br />
single species <strong>of</strong> prey. Consider, to begin with the<br />
distributions <strong>of</strong> parasites on their hosts shown in<br />
Fig. 5.18. In both examples, the observed patterns<br />
have been compared with the patterns that would<br />
have arisen if the parasites had been distributed at<br />
r<strong>and</strong>om. R<strong>and</strong>om distributions are the simplest imaginable<br />
arrangements in that they occur when all hosts<br />
<strong>and</strong> all parasites are equivalent <strong>and</strong> independent. (An<br />
'even' distribution would only occur if the parasites<br />
positively avoided one another.) Yet the observed<br />
patterns are far from r<strong>and</strong>om. Instead they are distinctly<br />
'clumped'. There are more hosts than expected<br />
Fig. 5.18 The aggregated<br />
distributions <strong>of</strong> parasites on hosts<br />
(points <strong>and</strong> curve), compared to a<br />
r<strong>and</strong>om distribution (histograms).<br />
(a) Ticks lxodes trianguliceps on the<br />
wood mouse Apodemus sylvaticus<br />
(data from R<strong>and</strong>olph, 1975).<br />
(b) Tapeworms Caryophyllaeus<br />
laticeps in the bream Abramis brama.<br />
(Data from Anderson, 1974.)
138 PART 2: INTERSPECIFIC INTERACTIONS<br />
supporting large numbers <strong>of</strong> parasites, but also more<br />
than expected with no parasites at all. In effect, there<br />
is a partial refuge for the host: the pattern <strong>of</strong> distribution<br />
ensures that an 'unexpectedly' large number <strong>of</strong><br />
hosts escape parasitization.<br />
Such patterns are extremely common amongst<br />
parasites, <strong>and</strong>, although proposals for underlying<br />
mechanisms are usually speculative (Anderson & May,<br />
1978), the effects these patterns have on host-parasite<br />
dynamics are fairly obvious. By leaving a large number<br />
<strong>of</strong> hosts unparasitized, even at high levels <strong>of</strong><br />
infection, the distributions ensure that the host population~<br />
are buffered from the most drastic effects <strong>of</strong> the<br />
parasites. This, in turn, tends to ensure that the<br />
parasite population has a population <strong>of</strong> hosts to live<br />
on. The basic effect <strong>of</strong> this partial refuge, then, is to<br />
stabilize the interaction.<br />
5.8.2 Refuges<br />
Partial refuges, as we shall see, are <strong>of</strong> considerable<br />
importance in a wide variety <strong>of</strong> predator-prey interactions.<br />
Yet there are, in some cases, not partial but<br />
total refuges, <strong>and</strong> these can be <strong>of</strong> two types.<br />
The first is a refuge for afixed proportion <strong>of</strong> prey. The<br />
parasitoid Venturia canescens, for instance, when attacking<br />
caterpillars <strong>of</strong> flour moths (Ephestia spp.) can<br />
only extend its ovipositor a certain distance into the<br />
flour medium. A proportion <strong>of</strong> the caterpillars-those<br />
lying deeply enough to be beyond the ovipositor's<br />
reach-are therefore protected in an effective refuge<br />
(Hassell, 1978).<br />
In the second type <strong>of</strong> total refuge, by contrast, afixed<br />
number <strong>of</strong> prey are protected. This is illustrated by<br />
Connell's (1970) work on the barnacle, Balanus gl<strong>and</strong>ula,<br />
in which he found that adults are restricted to<br />
the upper zones <strong>of</strong> the shore, while juveniles are<br />
distributed throughout a much broader region<br />
(Fig. 5.19). This occurs because in the upper zones<br />
there are two exposures to the air at low tide alrnost<br />
every day, which means that the whelks that consume<br />
the juvenile barnacles in the lower regions-even Thais<br />
emarginata (Fig. 5.19thave only two short, high-tide<br />
periods to feed (as opposed to a single long one at<br />
lower levels). And this is never -long enough to find<br />
<strong>and</strong> eat an adult Balanus gl<strong>and</strong>ula in the upper regions.<br />
Thus, the B. gl<strong>and</strong>ula individuals which the upper<br />
zones can support are protected from predation,<br />
irrespective <strong>of</strong> Thais numbers. There is a fixed-number<br />
refuge.<br />
From<br />
refuges,<br />
stabilize<br />
equally<br />
what has already been noted about partial<br />
it is clear that total refuges will tend to<br />
predator-prey interactions; but it should be<br />
clear that the (density-independent) fixed-<br />
Fig. 5.19 Vertical distributions <strong>of</strong> barnacle<br />
prey (Balanus gl<strong>and</strong>ula) <strong>and</strong> whelk<br />
predators (Thais emarginata, Th. canaliculata<br />
<strong>and</strong> Th. lamellosa) in relation to typical tidal<br />
fluctuations <strong>of</strong> large <strong>and</strong> small amplitude.<br />
(After Connell, 1970.) For further<br />
discussion, see text.
CHAPTER 5: PREDATION 139<br />
proportion refuge will be much less potent than the<br />
(density-dependent) fixed-number refuge, since in the<br />
latter case the proportion protected increases as prey<br />
density decreases.<br />
5.8.3 Partial refuges: aggregative responses<br />
In the living world as a whole, total refuges are<br />
probably rather rare. Considerably more common,<br />
however, is a tendency for prey to be affected by their<br />
herbivores, parasitoids or predators in much the same<br />
way as hosts are affected by their parasites (see<br />
Fig. 5.18): the ill-effects are aggregated so that the<br />
prey have a partial refuge. We can illustrate this,<br />
initially, in a herbivore-the cabbage aphid, Brevicogne<br />
brassicae. This species, an important pest <strong>of</strong><br />
cabbage <strong>and</strong> its relatives, has a marked tendency to<br />
form aggregates at two separate levels: nymphs, when<br />
isolated experimentally on the surface <strong>of</strong> a single leaf,<br />
quickly form large groups; while populations on a<br />
single plant tend to be restricted to particular leaves<br />
(Way & Cammell, 1970). The effects are illustrated by<br />
an experiment (Way& Cammell, 1970) in which eight<br />
small cabbage plants were each artificially infested by<br />
16 ;aphid nymphs. Four <strong>of</strong> the eight plants had all 16<br />
nymphs on a single leaf (the normal situation), while<br />
the other four had four nymphs on each <strong>of</strong> the four<br />
leaves. Aphid-free leaves were protected from crossinfestation,<br />
<strong>and</strong> colonization by 'outside' aphids was<br />
prevented. Productivity was measured by the numbers<br />
<strong>and</strong> weights <strong>of</strong> adult aphids subsequently produced.<br />
Although the differences are small (Table 5.5)<br />
it is clear that the normal, aggregated situation, ~ ta<br />
h<br />
single leaf colonized, is the more productive in terms<br />
Table 5.5 Weights <strong>of</strong> winged adult cabbage aphids<br />
produced on small cabbage plants. (From Way & Cammell,<br />
1970.)<br />
<strong>of</strong> aphids. Moreover, the uninfested leaves <strong>of</strong> the<br />
'one-leaf colonized plants' were healthy at the end <strong>of</strong><br />
the experiment, while the 'four-leaf colonized plants'<br />
were virtually dead. The aphids' behaviour, therefore,<br />
does more than increase their own productivity: it also<br />
provides a partial refuge for the cabbages. Thus, as a<br />
by-product <strong>of</strong> the aphids' behaviour, many more<br />
leaves escape destruction than would do so if the<br />
aphids were r<strong>and</strong>omly distributed. The cabbage population<br />
is partially buffered from the aphids' ill-effects,<br />
<strong>and</strong> the interaction is (relatively) stabilized.<br />
Of course, the aggregated cabbage aphids are themselves<br />
the prey <strong>of</strong> other animals <strong>and</strong>, indeed, their<br />
distribution is typical <strong>of</strong> the 'patchiness' <strong>of</strong> prey<br />
animals generally. The responses <strong>of</strong> a predator <strong>and</strong> a<br />
parasitoid to their distribution are shown in Fig. 5.20.<br />
In both cases (over at least part <strong>of</strong> the density range)<br />
the time spent on a leaf increases with the density <strong>of</strong><br />
aphids on that leaf. Thus, if we make the reasonable<br />
assumption that an increased searching time leads to<br />
an increased proportion <strong>of</strong> the leaf being searched,<br />
which leads to an increase in the proportion <strong>of</strong> aphids<br />
attacked, then clearly the aphids at the lower densities<br />
have a smaller probability <strong>of</strong> being attacked. Once<br />
again, therefore, there is a partial refuge, but this time<br />
it is the aphids themselves that are protected: aphids<br />
in low-density aggregates are most likely to be ignored.<br />
(It is important to note, however, that such<br />
effects apply only to those parts <strong>of</strong> the density axis in<br />
which 'time spent' increases. The importance <strong>of</strong> the<br />
effects depends on the relevance <strong>of</strong> these densities in<br />
nature .)<br />
Most herbivores, predators <strong>and</strong> parasitoids appear<br />
capable <strong>of</strong> exhibiting an 'aggregative response', concentrating<br />
their ill-effects on a particular portion or<br />
patch <strong>of</strong> their prey population; <strong>and</strong> by providing a<br />
partial refuge for the prey this tends to stabilize the<br />
interaction. But it must be realized that in each case<br />
this is essentially a by-product <strong>of</strong> the response (albeit<br />
an extremely important one): there is no question <strong>of</strong><br />
evolution favouring stable populations. This fundamental<br />
point is illustrated in Table 5.5 <strong>and</strong> Fig. 5.20.<br />
The predator <strong>and</strong> the parasitoid concentrate on particular<br />
patches (leaves) <strong>and</strong> make their individual<br />
search more pr<strong>of</strong>itable; the aphids aggregate in
140 PART 2: INTERSPECIFIC INTERACTIONS<br />
Fig. 5.20 Aggregative responses by<br />
a parasitoid <strong>and</strong> a predator <strong>of</strong> the<br />
cabbage aphid Brevicoryne brassicae.<br />
(a) Searching time <strong>of</strong> the braconid<br />
Diaeretielh rapae at different densites<br />
<strong>of</strong> its host (Akinlosotu, 1973). (b) As<br />
(a) but using coccinellid larvae<br />
CoccineIIa septempunctata. (After<br />
Hassell, 1978.)<br />
patches supporting other aphids <strong>and</strong> increase their<br />
individual productivity. In all cases, the aggregative<br />
behaviour is advantageous to the consumer.<br />
These data also provide further support for the<br />
assertion that predators choose pr<strong>of</strong>itable prey (in this<br />
case, pr<strong>of</strong>itable patches). Experimental illustration <strong>of</strong><br />
this is provided for a two-patch situation by the work<br />
<strong>of</strong> Krebs et al. (1978). Great tits were <strong>of</strong>fered rewards<br />
(food) at two different perches (patches), but the<br />
pr<strong>of</strong>itabilities <strong>of</strong> the two perches were unequal. After a<br />
period <strong>of</strong> learning, the birds concentrated (almost<br />
exclusively) on the more pr<strong>of</strong>itable patch (Fig. 5.21).<br />
live at an apparently stable low level <strong>of</strong> abundance,<br />
which can be explained in terms <strong>of</strong> aggregation by<br />
considering some <strong>of</strong> the results obtained by Monro<br />
(1967) for C. cactorum <strong>and</strong> Opuntia inermis (Table 5.6).<br />
The distribution <strong>of</strong> Cactoblastis cactorum egg-sticks<br />
(each containing 70-90 eggs) on prickly pears is<br />
distinctly clumped, <strong>and</strong> the very limited mobility <strong>of</strong> the<br />
larvae means that the 'unexpectedly' high number <strong>of</strong><br />
Of course, by bl<strong>and</strong>ly asserting that consumers concentrate<br />
on pr<strong>of</strong>itable patches we beg the question <strong>of</strong><br />
what actually constitutes a patch. In the examples<br />
shown in Fig. 5.20, for instance, the aphids' predators<br />
<strong>and</strong> parasitoids appear to treat each leaf as a patch;<br />
while in the further examples in Fig. 5.22 (which once<br />
again show concentration on pr<strong>of</strong>itable 'patches') the<br />
term 'patch' applies to a whole plant in the case <strong>of</strong> the<br />
braconid Apanteles glomeratus (Fig. 5.22a), <strong>and</strong> simply<br />
to a unit area in the case <strong>of</strong> the ichneumonid<br />
Dial -romus pulchellus (Fig. 5.22b). Similarly, while the<br />
cabbage aphid appears to treat a leaf (or part <strong>of</strong> a leaf) Fig. 5.21 When great tits are faced with a choice <strong>of</strong> two!<br />
as a patch, the appropriate scale for many herbivores perches to obtain food, they go for the one with the higher<br />
is the whole plant. One example <strong>of</strong> this is the moth<br />
reward rate. The ''dinate shows the percentage <strong>of</strong><br />
responses on one <strong>of</strong> the perches, <strong>and</strong> the abscissa is the<br />
Cactob'astis cactorum' which has been used in<br />
percentage <strong>of</strong> rewards available (Krebs et al., 1978). (After<br />
lia to control the prickly pear cacti O~untia inermis <strong>and</strong> Krebs, 1978.) (Geometric means <strong>and</strong> 95010 confidence limits<br />
0. stricta. Cactoblastis cactorurn <strong>and</strong> its food plants now are shown.)
CHAPTER 5: PREDATION 141<br />
therefore, is an extreme example <strong>of</strong> a widespread<br />
phenomenon: the predators' ill-effects are aggregated,<br />
tending to stabilize the interactions between them <strong>and</strong><br />
their prey.<br />
5.8.5 'Even' distributions<br />
Fig. 5.22 Aggregative responses <strong>of</strong> (a) the braconid<br />
Apanteles glomeratus to plants <strong>of</strong> different Pieris brassicae<br />
density (Hubbard, 1977), <strong>and</strong> (b) the ichneumonid<br />
Diadromas pulchellus to different densities <strong>of</strong> leek moth<br />
pupae per unit area (Noyes, 1974). (After Hassell, 1978.)<br />
plants without eggs are indeed protected. Moreover,<br />
the interaction is also stabilized by the death <strong>of</strong> larvae<br />
on plants with too many egg-sticks (roughly more than<br />
two per plant). These plants become 'overloaded': they<br />
are completely destroyed by the dense aggregation <strong>of</strong><br />
sedentary larvae, but the larvae themselves then have<br />
insufficient food to complete development. This,<br />
Parenthetically within this component <strong>of</strong> the interaction,<br />
it must be stressed that not all 'predator-prey'<br />
distributions are clumped. Indeed, Monro (1967) provides<br />
a striking example <strong>of</strong> a herbivore going to the<br />
other extreme. Figure 5.23 shows the distribution <strong>of</strong><br />
ovipositions by the trypetid fruitfly Dacus tvyoni in ripe<br />
loquat fruit, <strong>and</strong> also provides an 'expected' r<strong>and</strong>om<br />
distribution for comparison. It is obvious that the fly<br />
spreads its ill-effects much more evenly than expected,<br />
so that there are relatively few fruits that escape <strong>and</strong><br />
few that are overcrowded. Once again, however, as in<br />
most <strong>of</strong> the clumped examples, we can see that the<br />
fundamental basis <strong>of</strong> the pattern is that it is advantageous<br />
to the consumer-in this case as a result <strong>of</strong> the<br />
Table 5.6 Aggregation in a plant-herbivore interaction.<br />
Comparison <strong>of</strong> observed distributions <strong>of</strong> Cactoblastis eggsticks<br />
per Opuntia plant with corresponding Poisson<br />
distributions. (After Monro, l96 7 .)<br />
*Egg-sticks more clumped than expected for r<strong>and</strong>om<br />
oviposition.<br />
tEgg-sticks not distributed differently from r<strong>and</strong>om.<br />
Fig. 5.23 An 'even' distribution: the observed distributions<br />
<strong>of</strong> oviposition stings made by the fruitfly Dacus tryoni on<br />
loquat fruit (- - -) compared to an expected r<strong>and</strong>om<br />
distribution (-) (After Monro, 1967.)
142 PART 2: INTERSPECIFIC INTERACTIONS<br />
reduction in intraspecific competition experienced by<br />
each larva.<br />
5.8.6 Underlying behaviour<br />
There are various types <strong>of</strong> behaviour underlying the<br />
aggregative responses <strong>of</strong> predators, but they fall into<br />
two broad categories: those involved with the location<br />
<strong>of</strong> prey patches, <strong>and</strong> those that represent the response<br />
<strong>of</strong> a predator once within a prey patch. Within the first<br />
category we can include all examples <strong>of</strong> predators<br />
perceiving, at a distance, the existence <strong>of</strong> heterogeneity<br />
in the distribution <strong>of</strong> their prey. Rotheray (1979),<br />
for instance, found that the parasitoid Callaspidia<br />
defonscolombei was attracted to concentrations <strong>of</strong> its<br />
syrphid host by the odours produced by the syrphids'<br />
own prey: various species <strong>of</strong> aphid.<br />
Within the second category-responses <strong>of</strong> predators<br />
within prey patches-there are three distinct types <strong>of</strong><br />
behaviour. The first is illustrated in Fig. 5.24: a female<br />
predator <strong>of</strong> one generation tends to lay her eggs where<br />
there are high densities <strong>of</strong> prey so that her relatively<br />
immobile <strong>of</strong>fspring are concentrated in these pr<strong>of</strong>itable<br />
patches. This response, as far as the predatory<br />
individuals themselves are concerned, is essentially<br />
passive. By contrast, the second type <strong>of</strong> behaviour<br />
involves a change in a predator's searching pattern in<br />
response to encounters with prey items. In particular,<br />
there is <strong>of</strong>ten an increased rate <strong>of</strong> predator turning<br />
immediately following an intake <strong>of</strong> food, which leads<br />
to the predator remaining in the vicinity <strong>of</strong> its last food<br />
item. Increased turning causes predators to remain in<br />
high density patches <strong>of</strong> food (where the encounter<strong>and</strong><br />
turning-rates are high), <strong>and</strong> to leave low density<br />
patches (where the turning-rate is low). Such behaviour<br />
has been demonstrated in a number <strong>of</strong> predators,<br />
<strong>and</strong> is illustrated in Fig. 5.25 for coccinellid larvae<br />
feeding on aphids (Banks, 1957).<br />
The third type <strong>of</strong> behaviour is demonstrated by the<br />
data in Table 5.7 (Turnbull, 1964), referring to the<br />
web-spinning spider Archaearanea tepidariorum preying<br />
on fruit flies in a large experimental arena. The spiders<br />
tend, simply, to ab<strong>and</strong>on sites at which their capturerate<br />
is low, but remain at sites where it is high. In this<br />
case, therefore, the spiders modify their leaving-rate<br />
(rather than their turning-rate) in response to prey<br />
encounters, but the result, once again, is that predators<br />
congregate in patches <strong>of</strong> high prey density.<br />
Fig. 5.25 Search paths <strong>of</strong> hungry, fourth-instar coccinellid<br />
Fig. 5.24 Distribution <strong>of</strong> Syrphus eggs in relation to the larvae before <strong>and</strong> after capture <strong>of</strong> a prey (small circle on the<br />
number <strong>of</strong> tests <strong>of</strong> the psyllid Cardiaspina albitextura per leaf path). The rate <strong>of</strong> turning markedly increases after prey<br />
surface (Clark, 1963). (After Hassell, 1978.) capture (Banks, 1957). (After Curio, 1976.)
CHAPTER 5: PREDATION 143<br />
Table 5.7 Site occupation <strong>and</strong> feeding-rate <strong>of</strong> spiders<br />
feeding on Drosophila in an experimental arena with sites <strong>of</strong><br />
varying suitability for Drosophila. (After Turnbull, 1964.)<br />
5*8*7 'Hide-<strong>and</strong>-seek'<br />
We have seen, then, that the distributions <strong>of</strong> predators<br />
<strong>and</strong> prey can have important effects on predator-prey<br />
dynamics, because predators tend to concentrate on<br />
pr<strong>of</strong>itable patches <strong>of</strong> prey. There is, however, in some<br />
cases, another perspective from which this behaviour<br />
can be seen: predators <strong>and</strong> prey can appear, in effect,<br />
to play 'hide-<strong>and</strong>-seek'. The most famous <strong>and</strong> illustrative<br />
example <strong>of</strong> this is provided by the experimental<br />
work <strong>of</strong> HufTaker (1958) <strong>and</strong> Hdaker et al. (1963).<br />
Their laboratory microcosm varied, but basically consisted<br />
<strong>of</strong> a predatory mite, Typhlodromus occidentalis,<br />
feeding on a herbivorous mite, Eotetranychus sexmaculatus,<br />
feeding on oranges interspersed amongst rubber<br />
balls in a tray. In the absence <strong>of</strong> its predator, Eotetranychus<br />
maintained a fluctuating but persistent population<br />
(Fig. 5.26a); but if Typhlodromus was added during<br />
Fig. 5.26 Predator-prey interactions<br />
between the mite Eotetranychus<br />
sexmaculatus (a) <strong>and</strong> its predator<br />
Typhlodromus occidentatis (0).<br />
(a) Population fluctuations <strong>of</strong><br />
Eotetranychus without its predator,<br />
(b) a single oscillation <strong>of</strong> predator<br />
<strong>and</strong> prey in a simple system: <strong>and</strong><br />
(c) sustained oscillations in a more<br />
complex system (HufTaker, 1958).<br />
(After Hassell, 1978).
144 PART 2: INTERSPECIFIC INTERACTIONS<br />
the early stages <strong>of</strong> prey population growth, it rapidly<br />
increased its own population size, consumed all <strong>of</strong> its<br />
prey <strong>and</strong> became extinct itself (Fig. 5.26b). The interaction<br />
was exceedingly unstable, but it changed when<br />
HdTaker made his microcosm more 'patchy'. He<br />
greatly increased its size, but kept the total exposed<br />
area <strong>of</strong> orange the same; <strong>and</strong> he partially isolated each<br />
orange by placing a complex arrangement <strong>of</strong> Vaseline<br />
barriers in the tray which the mites could not cross.<br />
However, he facilitated the dispersal <strong>of</strong> Eotetranychus<br />
by inserting a number <strong>of</strong> upright sticks from which<br />
they could launch themselves on silken str<strong>and</strong>s carried<br />
by air currents. The overall result was a series <strong>of</strong><br />
sustained <strong>and</strong> relatively stable predator-prey oscillations<br />
(Fig. 5.26c), probably generated by the following<br />
mechanism. In a patch occupied by both Eotetranychus<br />
<strong>and</strong> Typhlodromus, the predators consume all the prey<br />
<strong>and</strong> then either disperse to a new patch or become<br />
extinct. In a patch occupied by the predators alone,<br />
there is usually death <strong>of</strong> the predators before their<br />
food arrives. But in patches occupied by the prey<br />
alone, there is rapid, unhampered growth accompanied<br />
by some dispersal to new patches. Dispersal,<br />
however, is much easier for the prey than it is for the<br />
predators. The global picture is, therefore, a mosaic <strong>of</strong><br />
unoccupied patches, prey-predator patches doomed<br />
to extinction, <strong>and</strong> thriving prey patches; with some<br />
prey <strong>and</strong> rather fewer predators dispersing between<br />
them. While each patch is ultimately unstable, the<br />
spatially heterogenous whole is much less so. Once<br />
again, therefore, patchiness has conferred stability;<br />
<strong>and</strong>, in the context <strong>of</strong> this section, we can see that this<br />
example illustrates the effect <strong>of</strong> temporary 'temporal<br />
refuges'.<br />
A rather similar, <strong>and</strong> ultimately more satisfying<br />
example (since it comes from the field), is provided by<br />
the work <strong>of</strong> L<strong>and</strong>enberger (1973; in Murdoch & Oaten,<br />
1975) who studied the predation by starfish <strong>of</strong> mussel<br />
clumps <strong>of</strong>f the coast <strong>of</strong> southern California. Clumps<br />
which are heavily preyed upon (or are simply too<br />
large) are liable to be dislodged by heavy seas so that<br />
the mussels die: the predators are continually driving<br />
patches <strong>of</strong> prey to extinction. Yet the mussels have<br />
planktonic larvae which are continually colonizing<br />
new locations <strong>and</strong> initiating new clumps. Conversely,<br />
the starfish disperse much less readily. They tend to<br />
stay wherever the clumps are, <strong>and</strong> there is a time-lag<br />
before they leave an area when the food is gone. The<br />
parallel with Huffaker's mites is quite clear: patches <strong>of</strong><br />
mussels are continually becoming extinct, but other<br />
clumps are growing prior to the arrival <strong>of</strong> starfish. 'The<br />
starfish show aggregative behaviour, concentrating on<br />
large, pr<strong>of</strong>itable clumps, <strong>and</strong> allowing the initially<br />
small, protected clumps to become large <strong>and</strong> pr<strong>of</strong>itable<br />
themselves. 'Hide-<strong>and</strong>-seek' <strong>and</strong> aggregative behaviour<br />
are, therefore, essentially indistinguishable,<br />
<strong>and</strong> both illustrate the important stabilizing effects <strong>of</strong><br />
aggregation on the predator-prey interaction.<br />
We have one further, important aspect <strong>of</strong> this<br />
'aggregative behaviour' component to consider, but<br />
before we do so it is necessary to examine another<br />
component: the interactions that occur between predators.<br />
5.9 Mutual interference<br />
amongst predators<br />
Predators commonly reserve particular aspects <strong>of</strong><br />
their behavioural repertoire for interactions with other<br />
predators <strong>of</strong> the same species: herbivorous (nectarfeeding)<br />
humming-birds, for instance, actively defend<br />
rich sources <strong>of</strong> food (Wolf, 1969); badgers patrol <strong>and</strong><br />
visit the 'latrines' around the boundaries between<br />
their territories <strong>and</strong> those <strong>of</strong> their neighbours; <strong>and</strong><br />
females <strong>of</strong> Rhyssa persuasoria, an ichneumonid parasitoid<br />
<strong>of</strong> wood wasp larvae, will threaten <strong>and</strong>, if need be,<br />
fiercely drive an intruding female from the same area<br />
<strong>of</strong> tree trunk (Spradbery, 1970). On a more quantitative<br />
level Kuchlein (1966) has shown that an increase<br />
in the density <strong>of</strong> the predatory mite Typhlodromus<br />
longipilus (<strong>and</strong> thus an increase in the number <strong>of</strong><br />
predator-predator encounters) leads to an increase in<br />
the rate <strong>of</strong> emigration from experimental leaf discs<br />
containing prey mites; <strong>and</strong> a similar situation is shown<br />
for a parasitoid <strong>of</strong> leek moth pupae in Fig. 5.27. In<br />
both qualitative <strong>and</strong> quantitative examples, then, the<br />
essential effect is the same: the time available to the<br />
predator (or herbivore or parasitoid) for 'prey'-seeking<br />
is reduced by encounters with other predators. And<br />
the importance <strong>of</strong> this effect increases with predator
CHAPTER 5: PREDATION 145<br />
Fig. 5.27 The effect <strong>of</strong> female parasitoid density on<br />
parasitoid emigration from an experimental cage; the<br />
ichneumonid Diadromus pulchellus (Noyes, 1974). (After<br />
Hassell, 1978.)<br />
density, because this increases the rate <strong>of</strong> predatorpredator<br />
encounters.<br />
The precise characteristics <strong>of</strong> such mutual intederence<br />
will vary from species to species, but all examples<br />
can be reduced to a common form in the following<br />
manner (Hassell & Varley, 1969; Hassell, 1978). The<br />
end-result <strong>of</strong> mutual interference is that each predator<br />
consumes less than it would otherwise do. Consumption-rate<br />
per predator will, therefore, decline with<br />
increasing predator density. Thus, if we ignore the fact<br />
that search time is reduced by mutual interference as<br />
predator density increases (i.e. assume that search<br />
time remains constant), it will appear as if searching (or<br />
attacking) eficiency is declining. Mutual interference<br />
can then be demonstrated by plotting apparent attacking<br />
efficiency (calculated from data on consumptionrates<br />
on the assumption <strong>of</strong> r<strong>and</strong>om search; see section<br />
5.10) against predator density. This has been done in<br />
Fig. 5.28, on logarithmic scales. As expected, the slope<br />
in all cases is negative, <strong>and</strong> may be denoted by - m,<br />
where m is termed the coeficient <strong>of</strong> interference. The<br />
general form <strong>of</strong> this relationship is probably represented<br />
by Fig. 5.28a & 5.28b, in which m remains<br />
constant at high <strong>and</strong> moderate predator densities, but<br />
decreases at low densities. This indicates that apparent<br />
attacking efficiency cannot continue to rise as<br />
predators become increasingly scarce (moving from<br />
right to left). As Fig. 5.28~-e shows, however, the<br />
coefficient <strong>of</strong> interference <strong>of</strong>ten remains constant<br />
throughout the range <strong>of</strong> densities actually examined.<br />
Fig. 5.28 Interference relationships between the searching Loxostege stricticalis (Ullyett, 1949a). (d) Coccinella<br />
efficiency (log scale) <strong>and</strong> density <strong>of</strong> searching parasitoids or septempunctata feeding on Brevicoryne brassicae (Michelakis,<br />
predators. (a) Encarsia formosa parasitizing the whitefly 1973). (e) Phytoseiulus persimilis feeding on deuteronymphs<br />
Trialeurodes vaporariorum (Burnett, 1958). (b) Chelonus <strong>of</strong> Tetranychus urticae (Fern<strong>and</strong>o, 1977). (After Hassell,<br />
texanus parasitizing eggs <strong>of</strong> Anagasta kiihniella (Ullyett, 1978.)<br />
1949b). (c) Cryptus inornatus parasitizing cocoons <strong>of</strong>
146 PART 2: INTERSPECIFIC INTERACTIONS<br />
This important observation will be utilized in section<br />
5.13.<br />
We have just seen that as a result <strong>of</strong> mutual<br />
interference amongst predators, attacking efficiency<br />
decreases as predator density increases. There is, in<br />
other words, a density-dependent reduction in the<br />
consumption-rate per individual, <strong>and</strong> thus a densitydependent<br />
reduction in predator fitness, which will<br />
have a stabilizing effect on the predator-prey interaction.<br />
The coefficient <strong>of</strong> interference, m, is a measure <strong>of</strong><br />
this stabilizing effect.<br />
5.9.1 A similar effect amongst parasites<br />
Interestingly, although parasites are not subject to the<br />
same sort <strong>of</strong> mutual interference as predators, herbivores<br />
<strong>and</strong> parasitoids, they are affected by another<br />
process which has a rather similar result. Immunological<br />
responses by hosts can play an important role in<br />
parasite mortality, <strong>and</strong> the strength <strong>of</strong> the response is<br />
<strong>of</strong>ten directly related to the size <strong>of</strong> the parasite burden.<br />
Thus, the probability <strong>of</strong> host-induced parasite mortality<br />
will increase with greater parasite density, as<br />
Fig. 5 .29 illustrates. There is no direct interference, <strong>of</strong><br />
course, but an individual parasite's fitness is reduced<br />
Fig. 5.29 The relationship between parasite death-rate <strong>and</strong><br />
parasite density within individual hosts for chickens<br />
infected with the fowl nematode Ascaridia lineata (Ackert<br />
et al., 193 1). (After Anderson & May, 1978.)<br />
by the presence <strong>of</strong> other parasites. Once again, therefore,<br />
the general effect is to stabilize the interaction<br />
(see Anderson & May, 1978).<br />
5.10 Interference <strong>and</strong> pseudointerference<br />
We can return now to aggregative behaviour, <strong>and</strong><br />
consider an important alternative approach to its<br />
effects. This was introduced in a mathematical way by<br />
Free et al. (1977); but for our purposes their ideas can<br />
be discussed verbally. By concentrating on pr<strong>of</strong>itable<br />
patches, a single predator increases the number <strong>of</strong><br />
prey it eats per unit time; the same predator searching<br />
r<strong>and</strong>omly would eat less. This means that the apparent<br />
attacking efficiency (calculated from consumptionrates<br />
on,the assumption <strong>of</strong> r<strong>and</strong>om search) is higher in<br />
the 'aggregated' predator. Yet the same predator, by<br />
removing prey from the pr<strong>of</strong>itable patches, will nnarginally<br />
reduce the pr<strong>of</strong>itability <strong>of</strong> those patches. This,<br />
in time, will make aggregated search more like r<strong>and</strong>om<br />
search, <strong>and</strong> the apparent attacking efficiency will<br />
decline. And if there are many predators, all concentrating<br />
on pr<strong>of</strong>itable patches, then this decline may be<br />
immediately perceptible. Thus, in general, we can<br />
expect the apparent attacking efficiency to decrease as<br />
predator density increases. Yet this is the very relationship<br />
that we saw resulting from mutual predator<br />
interference in the previous section. In the present<br />
case, therefore, this consequence <strong>of</strong> aggregative behaviour<br />
may be described as 'pseudo-interference' (Free et al.,<br />
1977).<br />
The importance <strong>of</strong> pseudo-interference, along with<br />
the nature <strong>of</strong> mutual interference itself, is amply<br />
illustrated in the following example (Hassell, 1971a, b,<br />
1978) in which larvae <strong>of</strong> the flour moth Ephestia<br />
cautella were parasitized by Venturia canescens. The<br />
larvae were confined in small containers at densities<br />
ranging from four to 128 per container, <strong>and</strong> exposed<br />
to one, two, four, eight, 16 or 32 parasitoids for 24<br />
hours. Line A in Fig. 5.30a was obtained in the<br />
manner <strong>of</strong> the previous section (by counting the total<br />
number <strong>of</strong> hosts parasitized <strong>and</strong> assuming there was<br />
r<strong>and</strong>om search): there was, apparently, a high degree<br />
<strong>of</strong> mutual parasitoid interference (m large). In fact,
CHAPTER 5: PREDATION 147<br />
Fig. 5.30 (a) Relationships between<br />
searching efficiency <strong>and</strong> density <strong>of</strong><br />
searching Venturia canescens;<br />
(b) relationship between (i) the<br />
proportion <strong>of</strong> time spent searching<br />
<strong>and</strong> Venturia density; <strong>and</strong> (ii) the<br />
percentage <strong>of</strong> time spent at different<br />
host densities with (c) one<br />
parasitoid, (d) two parasitoids, <strong>and</strong><br />
(e) four, eight, 16 <strong>and</strong> 32<br />
parasitoids. (After Hassell, 1978.)<br />
For further discussion, sex text.<br />
continuous observation showed explicitly that the time<br />
spent by parasitoids on host containers did decrease<br />
with increasing parasitoid density (Fig. 5.30b). In<br />
other words, mutual interference caused parasitoids<br />
to leave host patches, <strong>and</strong> thus spend less time<br />
searching. The true searching time, then, is not 24<br />
hours, but the proportion <strong>of</strong> 24 hours indicated by<br />
Fig. 5.30b; <strong>and</strong> taking this into account increases the<br />
apparent searching efficiency <strong>and</strong> yields line B in<br />
Fig. 5.30a. Yet there is clearly some interference<br />
remaining after these effects have been removed.<br />
A partial explanation <strong>of</strong> this is provided by the<br />
existence <strong>of</strong> an additional aspect <strong>of</strong> behavioural interference.<br />
Observation showed that parasitoidparasitoid<br />
encounters <strong>of</strong>ten led not to departure from<br />
a patch, but simply to an interruption <strong>of</strong> probing<br />
(lasting about 1 min). This, too, can be used to reduce<br />
the 'true' searching time appropriately, because the<br />
number <strong>of</strong> such encounters was observed <strong>and</strong> noted;<br />
<strong>and</strong> recalculating the apparent attacking efficiency<br />
this time yields line C in Fig. 5.30a.<br />
Lines A-C have negative slopes (i.e. coefficients <strong>of</strong><br />
interference) <strong>of</strong> 0.67, 0.45 <strong>and</strong> 0.27, respectively.<br />
Thus, 33% <strong>of</strong> the total interference [(0.67-0.45)/<br />
0.671~ 100 is accounted for by parasitoids leaving<br />
host patches, <strong>and</strong> a further 27% by parasitoids simply<br />
interrupting their searching. However, this leaves 40%<br />
<strong>of</strong> the total unaccounted for by actual mutual interference.<br />
The precedng argument (Free et al., 1977) would<br />
suggest that this is pseudo-interference, <strong>and</strong> the aggregative<br />
behaviour shown in Fig. 5.30~-e certainly<br />
supports this. Much more persuasive, however, is line<br />
D in Fig. 5.30a. This has been obtained by ab<strong>and</strong>oning<br />
the assumption <strong>of</strong> r<strong>and</strong>om search, <strong>and</strong> using instead<br />
the observed data on search pattern from Fig. 5.30~e.<br />
The slope, - 0.03, indicates that there is no longer
148 PART 2: INTERSPECIFIC INTERACTIONS<br />
any significant amount <strong>of</strong> interference. The interference<br />
<strong>of</strong> line C, in other words, was purely a consequence<br />
<strong>of</strong> the aggregative behaviour. It was, indeed,<br />
pseudo-interference.<br />
Perhaps the initial conclusion to be drawn from this<br />
work is that, in the absence <strong>of</strong> the detailed observational<br />
data, it would have been impossible to partition<br />
the total interference <strong>of</strong> line A into mutual interference<br />
<strong>and</strong> pseudo-interfence. This is not, however, as<br />
disappointing a conclusion as it might at first appear.<br />
In any natural situation, mutual interference (if it<br />
exists at all) is bound to increase with increased<br />
aggregation, since aggregation (by definition) leads to a<br />
higher probability <strong>of</strong> encounter. Yet the general effect<br />
<strong>of</strong> mutual interference will be to drive predators from<br />
dense aggregates (where encounters are most frequent).<br />
This will tend to reduce the level <strong>of</strong> aggregation,<br />
<strong>and</strong> ultimately reduce the mutual interference<br />
itself. There is, in short, a complex <strong>and</strong> dynamic<br />
interaction-which it might be extremely difficult to<br />
disentangle-between aggregation (leading to pseudointerference)<br />
<strong>and</strong> behavioural interference; <strong>and</strong> it<br />
may, therefore, be convenient to encapsulate the<br />
effects <strong>of</strong> both in a single parameter: the coefficient <strong>of</strong><br />
interference. Plots like the ones in Fig. 5.28 <strong>and</strong> line A<br />
in Fig. 5.30a, in other words, are able to capture the<br />
combined, density-dependent, stabilizing effects <strong>of</strong><br />
aggregative behaviour <strong>and</strong> mutual predator interference;<br />
<strong>and</strong> there will be many natural situations in<br />
which one or both <strong>of</strong> these effects are extremely<br />
significant. Both effects, <strong>of</strong> course, represent strategies<br />
adopted by the predators to increase their own fitness.<br />
5.1 1 Optimal foraging<br />
One further conclusion that can be drawn from this<br />
discussion, however, is that the movement <strong>of</strong> predators<br />
between patches is itself worthy <strong>of</strong> detailed study<br />
whether this movement is a consequence <strong>of</strong> interference,<br />
or <strong>of</strong> patch depletion, or is even a means <strong>of</strong> patch<br />
assessment. Such study would be closely related to<br />
investigations <strong>of</strong> diet width among predators (section<br />
5.3), <strong>and</strong> <strong>of</strong> the way in which predators distribute<br />
their effort amongst patches (section 5.7), because all<br />
three are concerned with the ways in which predators<br />
tend to maximize their 'pr<strong>of</strong>its'. They can be bracketed<br />
together as studies <strong>of</strong> 'optimal foraging'. This is a<br />
subject which is reviewed in some detail by Stephens<br />
<strong>and</strong> Krebs (1986), but we can underline the importance<br />
<strong>of</strong> optimal foraging between patches by means<br />
<strong>of</strong> the following example.<br />
Cook <strong>and</strong> Cockrell (1978) fed individual, fourthinstar<br />
mosquito larvae to adult water-boatmen, Notonecta<br />
glauca, <strong>and</strong> as Fig. 5.31a shows, the rate at<br />
which nutrients were extracted from a single prey<br />
item declined sharply with time. This occurred not<br />
because the water-boatmen were satiated, but because<br />
the food became increasingly difficult for them<br />
to extract. Without bending the rules too much, we<br />
can treat each prey item as a 'patch'. From this<br />
viewpoint we can see that the pr<strong>of</strong>itability <strong>of</strong> patches<br />
to water-boatmen declined rapidly the longer they<br />
stayed 'in' them. We can also see that to maxirnize<br />
their pr<strong>of</strong>its they would, at some time, have to leave<br />
depleted patches <strong>and</strong> find new, highly pr<strong>of</strong>itable ones,<br />
i.e they would have to drop the old prey <strong>and</strong> catch a<br />
new one. Yet this in itself is a costly process: the<br />
predators take in no food while they are expending<br />
energy searching for, capturing <strong>and</strong> subduing (i.e.<br />
h<strong>and</strong>ling) the next prey item. Obviously, if they are to<br />
forage optimally, the water-boatmen must maximize<br />
their pr<strong>of</strong>its when they set such costs against the<br />
eventual gain from the new patch, <strong>and</strong> the longer the<br />
h<strong>and</strong>ling time the greater these costs will be. We<br />
would, therefore, expect optimally foraging predators<br />
to spend relatively long periods at a patch (where the<br />
rate <strong>of</strong> pr<strong>of</strong>it, even if low, is at least positive) when the<br />
h<strong>and</strong>ling time is high; <strong>and</strong> this is precisely the result<br />
obtained by Cook <strong>and</strong> Cockrell (Fig. 5.3 lb). The waterboatmen's<br />
feeding times served to increase tlheir<br />
pr<strong>of</strong>its (Fig. 5.3 lc(i)). Prolonged stays (Fig. 5.3 lc(ii)) or<br />
repeated changes <strong>of</strong> patch (Fig. 5.3 lc(iii)) would<br />
clearly have been less pr<strong>of</strong>itable.<br />
It must not, <strong>of</strong> course, be imagined that the waterboatmen<br />
consciously weigh up pros <strong>and</strong> cons <strong>and</strong> act<br />
accordingly. Rather, it is natural selection that has<br />
favoured individuals that adopt a strategy appropriate<br />
for foraging in a patchy environment with marked<br />
patch depletion. Nor must it be imagined that animals<br />
always adopt the strategy which actually maximizes
Fig. 5.31 (a) The cumulative dry weight <strong>of</strong> food extracted<br />
from an individual mosquito larva by Notonecta as a<br />
function <strong>of</strong> time spent feeding: as time increases,<br />
diminishing returns set in. (b) The relationship between<br />
feeding time ( + SE) <strong>and</strong> h<strong>and</strong>ling time (intercatch interval).<br />
(After Cook & Cockrell, 1978.) (c) The foraging pr<strong>of</strong>it <strong>of</strong> (i)<br />
an optimal forager (660 arbitrary units), compared to one<br />
with a long stay-time (ii)(376 units) <strong>and</strong> one with a short<br />
stay-time (ii) (175 units).<br />
their foraging pr<strong>of</strong>its. As Comins <strong>and</strong> Hassell (1979)<br />
point out, animals must spend (i.e. 'waste') time<br />
sampling <strong>and</strong> learning about their environment; <strong>and</strong><br />
the strategies they adopt will be influenced not only by<br />
foraging itself, but also by predator avoidance, <strong>and</strong> so<br />
on. Nevertheless, we can expect natural selection to<br />
'exert evolutionary pressures towards an optimal foraging<br />
strategy; <strong>and</strong> the recognition <strong>of</strong> optimal foraging is<br />
bound to play an increasingly crucial role in our<br />
underst<strong>and</strong>ing <strong>of</strong> predator-prey interactions. Interestingly,<br />
Comins <strong>and</strong> Hassell (1979) suggested, from an<br />
analysis <strong>of</strong> models, that although optimal foraging has<br />
important consequences for predator fitness, its effects<br />
on predator-prey dynamics are rather similar to those<br />
resulting from a much simpler, fixed pattern <strong>of</strong> aggregation.<br />
burden all tend to have a stabilizing influence on the<br />
interaction; while time-lags, the increased effects <strong>of</strong><br />
multiple infections in parasites, the existence <strong>of</strong> 'maintenance<br />
thresholds' <strong>and</strong> 'type 1' <strong>and</strong> 'type 2' functional<br />
responses all tend to have a destabilizing<br />
influence. We have also seen that predators <strong>and</strong> prey<br />
exert a greater influence on the dynamics <strong>of</strong> one<br />
another's populations the more specific (less polyphagous)<br />
the predator is; that some prey have relatively<br />
little fitness to lose by their death; that the quality as<br />
well as the quantity <strong>of</strong> food can exert important<br />
influences on predator populations; <strong>and</strong> that, in many<br />
respects, predators tend to forage optimally.<br />
Nevertheless, having examined these components<br />
we remain essentially ignorant <strong>of</strong> their relative importance,<br />
<strong>and</strong> <strong>of</strong> the patterns <strong>of</strong> abundance that we might<br />
expect them to give rise to, either alone or in combination.<br />
In order to go some way towards dispelling<br />
this ignorance, we turn, once again, to mathematical<br />
models.<br />
Our view <strong>of</strong> the 'simplest, abstracted, two-species<br />
predator-prey system' is, by now, somewhat less<br />
naive than it was. We have seen that intraspecific<br />
competition amongst prey, 'type 3' functional re-<br />
5.13 Mathematical models<br />
sponses, aggregated distributions <strong>of</strong> ill-effects (<strong>and</strong>, as Of the models that we might consider, Lotka (1925)<br />
special cases, spatial <strong>and</strong> temporal refuges), mutual <strong>and</strong> Volterra (1926) constructed a classical, simple,<br />
interference amongst predators, <strong>and</strong> the increase in continuous-time predator-prey model, which Rosenhost<br />
immunological response with increased parasite zweig <strong>and</strong> MacArthur (1963) developed further in
150 PART 2: INTERSPECIFIC INTERACTIONS<br />
graphical form: Caughley <strong>and</strong> Lawton (1981) reviewed<br />
models <strong>of</strong> plant-herbivore systems; <strong>and</strong> Cr<strong>of</strong>ton (1 Wl), H,<br />
Anderson <strong>and</strong> May (1978) <strong>and</strong> May <strong>and</strong> Anderson<br />
(1978) constructed models <strong>of</strong> the host-parasite interaction<br />
(reviewed by Anderson, 1981). However, because<br />
<strong>of</strong> the range <strong>of</strong> factors which they explicitly <strong>and</strong><br />
successfully incorporate, we shall concentrate here on<br />
difference equation models <strong>of</strong> host-parasitoid systems<br />
(cf. section 3.2) These are described in much greater<br />
detail by Hassell (1978). Then, in section 5 .l3.3, we<br />
shall turn briefly to a model <strong>of</strong> grazing systems (Noy-<br />
Meir, 1975). The conclusions that we are able to draw<br />
throughout will throw important light on predatorprey<br />
interactions generally.<br />
5.13.1 Host-parasitoid models<br />
We begin by describing a very simple model, which<br />
can be used as a basis for further developments<br />
(Nicholson, 1933; Nicholson & Bailey, 1935). Let H, be<br />
the number <strong>of</strong> hosts, <strong>and</strong> P, the number <strong>of</strong> parasitoids<br />
(in generation t): r is the intrinsic rate <strong>of</strong> natural<br />
increase <strong>of</strong> the host, <strong>and</strong> c is the conversion rate <strong>of</strong><br />
hosts into parasitoids, i.e. the mean number <strong>of</strong> parasitoids<br />
emerging from each host. If H, is the number <strong>of</strong><br />
hosts actually attacked by parasitoids (in generation t),<br />
then, clearly:<br />
Et<br />
- = AP,<br />
(A can, alternatively, be thought <strong>of</strong> as the parasitoid's<br />
searching efficiency; or the probability that a given<br />
parasitoid will encounter a given host; or, indeed, the<br />
'area <strong>of</strong> discovery' <strong>of</strong> the parasitoid, within which it<br />
encounters all hosts.) Remember that we are dealing<br />
with parasitoids. This means that a single host can be<br />
encountered several times, but for the most part only<br />
the first encounter leads to successful parasitization;<br />
predators, by contrast, would physically remove their<br />
prey, <strong>and</strong> thus prevent re-encounters.<br />
If encounters occur in an essentially r<strong>and</strong>om fashion,<br />
then the proportions <strong>of</strong> hosts encountered zero,<br />
one, two, three or more times are given by the<br />
successive terms in the appropriate 'Poisson distribution'<br />
(described in any basic textbook on statistics).<br />
The proportion not encountered at all, p,, is given by:<br />
where em(- E,/&) is another way <strong>of</strong> writing e-"~'~'.<br />
Thus the proportion that is encountered (one or more<br />
times) is l -p,, <strong>and</strong> the number encountered (or<br />
attacked) is:<br />
r<br />
H,=Ht(l-po)=Ht l-exp --<br />
( :,)l<br />
In other words, ignoring intraspecific competition, the<br />
hosts that are not attacked reproduce, <strong>and</strong> those that<br />
are attacked yield not hosts but parasitoids. For<br />
simplicity we shall assume that each host can support<br />
only one parasitoid (c = 1). Thus, the number <strong>of</strong> hosts<br />
attacked in one generation defines the number <strong>of</strong><br />
parasitoids produced in the next (P, + , = H,).<br />
To derive a simple formulation for H, we proceed as<br />
follows. Let E, be the number <strong>of</strong> host-parasitoid<br />
encounters (or interactions) in generation t. Then if A<br />
is the proportion <strong>of</strong> the hosts encountered by any one<br />
parasitoid:<br />
<strong>and</strong><br />
And substituting this expression for H, into equation<br />
5.1 gives us:<br />
This is the Nicholson-Bailey model <strong>of</strong> the hostparasitoid<br />
interaction. Its simplicity rests on two<br />
assumptions:<br />
1 that parasitoid numbers are determined solely by<br />
the rate <strong>of</strong> r<strong>and</strong>om encounters with hosts; <strong>and</strong><br />
2 that host numbers would grow exponentially but<br />
for the removal <strong>of</strong> individuals by r<strong>and</strong>om encounter<br />
with parasitoids.
CHAPTER 5: PREDATION 151<br />
As Hassell (1978) makes clear, an equilibrium<br />
combination <strong>of</strong> these two populations is a possibility,<br />
but even the slightest disturbance from this equilibrium<br />
leads to divergent oscillations (Fig. 5.3 2). Thus,<br />
our simple model, although it produces coupled oscillations,<br />
is highly unstable. Nevertheless, it is clearly a<br />
formal restatement <strong>of</strong> the naive expectation expressed<br />
in section 5.1: when a single predator <strong>and</strong> a single<br />
prey interact in the simplest imaginable way, coupled<br />
oscillations are the result.<br />
Since most observed patterns <strong>of</strong> abundance are<br />
considerably more stable than those produced by the<br />
Nicholson-Bailey model, we must be particularly<br />
interested in modifications to it which enhance stability.<br />
The most obvious modification we can make is to<br />
replace the exponential growth <strong>of</strong> hosts with densitydependent<br />
growth resulting from intraspecific competition<br />
(section 5.5). Following Beddington et al. (1975),<br />
this is done by incorporating a term like the one used<br />
in the logistic equation (section 3.3), giving<br />
where K is the carrying-capacity <strong>of</strong> the host popula-<br />
tion in the absence <strong>of</strong> parasitoids. Figure 5.33 illustrates<br />
the patterns <strong>of</strong> abundance resulting from this<br />
revised model in terms <strong>of</strong> r <strong>and</strong> a new parameter, q<br />
( = H*/K) where H* is the equilibrium size <strong>of</strong> the host<br />
population in the presence <strong>of</strong> parasitoids. For a given<br />
value <strong>of</strong> r <strong>and</strong> K, q depends solely on the parasitoids'<br />
efficiency, A. When A is low, q is almost 1 (H* = K), but<br />
at higher efficiencies q approaches zero (H* c< K).<br />
It is clear from Fig. 5.33 that intraspecific competition<br />
amongst hosts can lead to a range <strong>of</strong> abundance<br />
patterns. Moreover, intraspecific competition is obviously<br />
a potentially important stabilizing factor in<br />
host-parasitoid systems. This is particularly so for low<br />
<strong>and</strong> moderate values <strong>of</strong> r, <strong>and</strong> high <strong>and</strong> moderate<br />
values <strong>of</strong> q; but even with low values <strong>of</strong> q (high<br />
parasitoid efficiency), the fluctuations are not altogether<br />
unlike those observed in natural populations.<br />
Note, however, that with high reproductive-rates <strong>and</strong><br />
low parasitoid efficiencies we return to the chaotic<br />
behaviour characteristic <strong>of</strong> the single-species populations<br />
in section 3.4.1.<br />
The next modification we can make to the<br />
Nicholson-Bailey model is to consider explicitly the<br />
parasitoids' functional response to host density (section<br />
5.7). In the present context, this is described by<br />
Fig. 5.32 Population fluctuations<br />
from an interaction between the<br />
greenhouse whitefly Trialeurodes<br />
vaporariorum (0) <strong>and</strong> its chalcid<br />
parasitoid Encarsia forrnosa (0). The<br />
thin lines show the estimated<br />
outcome from a Nicholson-Bailey<br />
model (Burnett, 1958). (After<br />
Hassell, 1978.)
152 PART 2: INTERSPECIFIC INTERACTIONS<br />
Fig. 5.34 Type 2 functional responses generated by<br />
equations 5.7. (a) Nasonia vitripennis parasitizing Musca<br />
domestica pupae (DeBach & Smith, 1941) a = 0.027;<br />
T, = 0.52. (b) Dahlbominus fuscipennis parasitizing Neodiprion<br />
sertifer cocoons (Burnett, 1956; a = 0.252; T,, = 0.037. (After<br />
Hassell, 1978.)<br />
Fig. 5.33 Stability boundaries for the parasitoid-host model<br />
with intraspecific host competition, as in equation 5.6.<br />
(After Beddington et al., 1975.) For further discussion, see<br />
text.<br />
the relationship between Ha/P, (the mean number <strong>of</strong><br />
hosts attacked per parasitoid) <strong>and</strong> H, ; i.e. the relationship<br />
between the number <strong>of</strong> hosts attacked by a<br />
constant number <strong>of</strong> parasitoids (Ha with P, constant)<br />
<strong>and</strong> H,. Until now we have been assuming that this<br />
relationship is linear (equation 5.4):<br />
Ha = H, {l - exp ( - AP,)).<br />
In other words, it is implicit in the Nicholson-Bailey<br />
model that the 'predation'-rate <strong>of</strong> the parasitoids<br />
continues to rise indefinitely with increasing host<br />
density, i.e. h<strong>and</strong>ling time is zero. This is clearly at<br />
variance with the data examined in section 5.7, <strong>and</strong> is,<br />
in any case, impossible. Obviously it is important to<br />
replace this linear relationship with the types 2 <strong>and</strong> 3<br />
functional responses which are actually observed.<br />
Dealing first with the type 2 response, we saw in<br />
section 5.7.1 that the essential feature underlying it is<br />
the existence <strong>of</strong> a finite 'h<strong>and</strong>ling time'. Thus, we shall<br />
let T be the total amount <strong>of</strong> time available to each<br />
parasitoid, Th the time it takes to deal with each host<br />
(h<strong>and</strong>ling time), T, the total amount <strong>of</strong> time available<br />
to each parasitoid for host seeking, <strong>and</strong> a the parasitoids'<br />
instantaneous rate <strong>of</strong> search (or attack-rate, see<br />
section 5.7). Then, by definition:<br />
So that the total number <strong>of</strong> hosts h<strong>and</strong>led in generation<br />
t by each parasitoid is now aTsHt. If we consider<br />
that 'total available search time' is equal to 'total time'<br />
minus 'total h<strong>and</strong>ling time', then:<br />
T, = T - ThaTSH,,<br />
which, by rearrangement, gives:<br />
T<br />
T, =<br />
1 + aThHt '<br />
so that:<br />
Substituting this into equations 5.4 <strong>and</strong> 5.5 gives:<br />
As Fig. 5.34 shows, equation 5.7 generates a type 2<br />
functional response, in which the maximum possible<br />
number <strong>of</strong> hosts attacked is determined (as expected)<br />
by T,,/T, <strong>and</strong> the rate <strong>of</strong> approach to this asymptote is<br />
determined by a (the instantaneous search-rate).<br />
Equation 5.8, therefore, represent the Nicholson-
CHAPTER 5: PREDATION 153<br />
Bailey model with a type 2 functional response incorporated<br />
into it. Their dynamic properties were<br />
examined by Hassell <strong>and</strong> May (1973) <strong>and</strong>, as expected,<br />
the inverse density-dependence makes this model less<br />
stable than the Nicholson-Bailey (recovered from this<br />
model when Th = 0). However, increased instability is<br />
relatively slight as long as Th IT
154 PART 2: INTERSPECIFIC INTERACTIONS<br />
Fig. 5.35 Stability boundaries for the parasitoid-host model<br />
with constant parasitoid density (parasitoid switching)<br />
<strong>and</strong> the host as described in equation 5.10a. (a) y = 0;<br />
(b) g = 2m).<br />
(After Hassell & Comins, 1978.)<br />
Overall, therefore, these models make it clear that<br />
the apparently simple consequences <strong>of</strong> the different<br />
'predator' functional responses are subject to significant<br />
qualifications.<br />
We turn now to the important question <strong>of</strong> heterogeneity<br />
(section 5.8), <strong>and</strong> consider first the special,<br />
extreme case <strong>of</strong> a host 'refuge'. If there is a constant<br />
proportion refuge such that only a proportion <strong>of</strong> the<br />
hosts, y, are available to the parasitoids, then equations<br />
5.5 can be replaced simply by:<br />
Conversely, if there is a constant number refuge in<br />
which H, hosts are always protected, the appropriate<br />
modification is:<br />
H, + = Hoer + (H, - H,) exp{r - M,)<br />
Pt+1 =(H,-Ho)(l -em-M,)).<br />
(5.12)<br />
The results <strong>of</strong> these modifications are summarized in<br />
Fig. 5.36 (following Hassell & May, 1973). It is clear<br />
that, while both modifications have a stabilizing effect<br />
on the interaction, the constant number refuge is by far<br />
the more potent <strong>of</strong> the two. This is no doubt due to the<br />
density-dependent effect <strong>of</strong> having a greater proportion<br />
<strong>of</strong> the host population protected as host density<br />
decreases.<br />
By contrast, a very much more general approach to<br />
heterogeneity has been taken by May (1978a). He set<br />
aside the precise nature <strong>of</strong> host <strong>and</strong> parasitoid distri-<br />
Fig. 5.36 The effects <strong>of</strong> refuges on stability: (a) a constant<br />
proportion refuge (equations 5.11). <strong>and</strong> (b) a constant<br />
number refuge (equation 5.12). (After Hassell & May,<br />
1973.)<br />
butions <strong>and</strong> efforts, <strong>and</strong> argued simply that the<br />
distribution <strong>of</strong> host-parasitoid encounters was not<br />
r<strong>and</strong>om but aggregated. In particular, he assumed<br />
(with some justification-see May, 1978a) that this<br />
distribution could be described by the simplest <strong>and</strong><br />
most general <strong>of</strong> the appropriate statistical models, the<br />
negative binomial. In this case, the proportion <strong>of</strong> hosts<br />
not encountered at all is given by:<br />
p',= [l<br />
where k is a measure <strong>of</strong> the degree <strong>of</strong> aggregation:<br />
maximal aggregation at k = 0, minimal aggregation at<br />
k = oo (recovery <strong>of</strong> the Nicholson-Bailey model). The<br />
appropriate modification <strong>of</strong> p, in equations 5.6 gives<br />
us a model that incorporates both aggregated encounters<br />
<strong>and</strong> intraspecific competition amongst hosts:<br />
AP, -k<br />
Pt+l=Ht(l-[l+T] )
CHAPTER 5: PREDATION 155<br />
The patterns <strong>of</strong> abundance generated by this model<br />
are summarized in Fig. 5.37, from which it is clear<br />
that the already moderately stable system described<br />
by equation 5.6 is given a marked boost in stability by<br />
the incorporation <strong>of</strong> significant levels <strong>of</strong> aggregation<br />
(k S 1). Of particular importance is the existence <strong>of</strong><br />
stable systems with very low values <strong>of</strong> q. Of the<br />
stabilizing factors so far considered, encounter aggtegation<br />
(i.e. heterogeneity) is obviously the most potent.<br />
We consider next a topic that was established in<br />
section 5.9 as being closely connected with the aggregation<br />
<strong>of</strong> encounters: mutual parasitoid interference.<br />
Following Hassell <strong>and</strong> Varley (1969), we shall adopt a<br />
simple, empirical approach <strong>and</strong> derive a form for the<br />
searching efficiency, A, which conforms to the log-log<br />
plots <strong>of</strong> Fig. 5.28, i.e.<br />
where log Q <strong>and</strong> - m are the intercept <strong>and</strong> slope <strong>of</strong> the<br />
plots, <strong>and</strong>, in particular, m is the 'coefficient <strong>of</strong><br />
interference'. Note that, because this relationship is<br />
empirical, it serves to describe not only interference<br />
proper but pseudo-interference as well. The relation-<br />
ship, therefore, incorporates mutual parasitoid interference<br />
<strong>and</strong> aggregation.<br />
The appropriate model is clearly:<br />
<strong>and</strong> the patterns <strong>of</strong> abundance resulting from these<br />
equations are illustrated in Fig. 5.3 8. Not surprisingly,<br />
since aggregation <strong>of</strong> encounters is being incorporated,<br />
'total interference' is shown to be an extremely potent<br />
stabilizing force.<br />
5.13.2 Heterogeneity in host-parasitoid interactions<br />
We have already seen in the previous section that the<br />
tendency for parasitoids to aggregate in areas <strong>of</strong> high<br />
host density can be a powerful stabilizing force in<br />
host-parasitoid systems. The models <strong>of</strong> that section<br />
(Hassell & May, 1973, 1974; Murdoch & Oaten, 1975;<br />
May, 1978a) showed that the stability observed was<br />
the result <strong>of</strong> directly density-dependent mortality.<br />
However, it is now clear that other types <strong>of</strong> mortality<br />
contribute to stability in host-parasitoid interactions.<br />
Spatial variation in parasitism that is independent <strong>of</strong><br />
host density <strong>and</strong> that which shows inverse densitydependent<br />
mortality can also contribute in a signifi-<br />
Fig. 5.37 Stability boundaries for the parasitoid-host model<br />
with parasitoid aggregations as in equations 5.13: (a) k = CO; Fig. 5.38 StabiIity boundaries for the parasitoid-host model<br />
(b) k = 2; (c) k = l; (d) k = 0. (After HasselI, 1978.) (See with mutual interference as in equations 5.14. (After<br />
Fig. 5.33.) Hassell & May, 1973.)
156 PART 2: INTERSPECIFIC INTERACTIONS<br />
cant way to stability (Chesson & Murdoch, 1986;<br />
Pacala et al., 1990; Hassell et al., 1991).<br />
The concept that underlies how these different<br />
density-related mortalities can stabilize hostparasitoid<br />
interactions is the 'relative risk <strong>of</strong> parasitism'<br />
for a host individual (Chesson & Murdoch, 1986)<br />
<strong>and</strong> is illustrated in Fig. 5.39. This 'risk' refers to a<br />
heterogeneous distribution across hosts <strong>of</strong> the probability<br />
<strong>of</strong> encounters with parasitoids - all hosts are not<br />
equally likely to be parasitized (except in the unusual<br />
circumstance shown in Fig. 5.39a). There are essentially<br />
two ways in which hosts have a high risk <strong>of</strong><br />
being parasitized. The first is if parasitoids aggregate in<br />
patches independently <strong>of</strong> host density (Fig. 5.3 9b). In<br />
such instances, those hosts that occur in patches into<br />
which parasitoids have aggregated are more likely to<br />
be parasitized than those in patches which have low<br />
parasitoid numbers. The second is if they occur in<br />
patches <strong>of</strong> high host density, into which parasitoids<br />
aggregate in response to host density. In particular if<br />
the relationship between parasitoid density <strong>and</strong> host<br />
density between patches is an accelerating one (i.e. a<br />
power function), then hosts in the highest host density<br />
patches are more likely to be parasitized than in any<br />
lower host density patches (Fig. 5.39~). In each <strong>of</strong><br />
these two scenarios the converse is, <strong>of</strong> course, also<br />
important. In the first example, patches in which<br />
there are many hosts but few parasitoids will be<br />
Fig. 5.39 Four possible relationships between parasitoid<br />
<strong>and</strong> host density. In (a) there is no aggregation <strong>of</strong> risk, with<br />
the same ratio <strong>of</strong> parasitoids to hosts in each patch. (b) This<br />
is a host-density-independent (HDI) model in which<br />
parasitoids are aggregated, but not in relation to host<br />
density. There is a high risk <strong>of</strong> parasitism when parasitoid<br />
numbers in a given patch lie above the dashed line (= 'no<br />
aggregation <strong>of</strong> risk line' <strong>of</strong> part (a)) <strong>and</strong> correspondingly a<br />
low risk when parasitoid numbers are below this line. The<br />
solid line in (c) represents a host-density-dependent (HDD)<br />
model in which parasitoids are once again aggregated, but<br />
this time in response to host density. Once again there is a<br />
high risk <strong>of</strong> parasitism when parasitoid numbers in a given<br />
patch lie above the dashed line <strong>and</strong> correspondingly a low<br />
risk <strong>of</strong> parasitism when parasitoid numbers are below this<br />
line. In (d) a data set typical <strong>of</strong> those reported in field<br />
studies is shown. The solid line <strong>of</strong> best fit to the data is<br />
identical to that shown in the HDD model <strong>of</strong> (c). Parasitoids<br />
are again seen to be aggregating in patches <strong>of</strong> high host<br />
density, but in this example the match between parasitoid<br />
density <strong>and</strong> host density is not perfect. CV2 is calculated as<br />
follows: divide parasitoid numbers by host numbers in each<br />
patch to give 'risk <strong>of</strong> parasitism'; calculate the mean 'risk <strong>of</strong><br />
parasitism' <strong>and</strong> its variance; divide the variance by the<br />
square <strong>of</strong> the mean.
CHAPTER 5: PREDATION 157<br />
ref~~ges for the hosts. In the second example, low host<br />
density patches effectively become refuges from parasitism.<br />
We imagine that parasitoids frequently aggregate in<br />
patches <strong>of</strong> high host density, but that the matching <strong>of</strong><br />
host <strong>and</strong> parasitoid density is far from perfect<br />
(Fig. 5.398). The two scenarios we have presented<br />
represent opposite ends <strong>of</strong> a continuum. Hassell et al.<br />
(1991) refer to models that are closest to the first<br />
scenario as host-density-independent heterogeneity<br />
models (HDI) <strong>and</strong> those that resemble the second as<br />
host-density-dependent heterogeneity models (HDD).<br />
The aggregation <strong>of</strong> risk <strong>of</strong> parasitism can be measured<br />
by the ratio <strong>of</strong> the st<strong>and</strong>ard deviation <strong>of</strong> the risk<br />
<strong>of</strong> parasitism per host divided by the mean risk <strong>of</strong><br />
parasitism, or the coefficient <strong>of</strong> variation (CV). For some<br />
discrete time models <strong>of</strong> host-parasitoid interactions the<br />
criterion for stability <strong>of</strong> the host-parasitoid interaction<br />
is that Cv2 > 1 (Pacala et al., 1990; Hassell et al., 1991).<br />
Stability through heterogeneity in the probability <strong>of</strong><br />
encounters is achieved through strengthening densitydependencies,<br />
specifically through pseudo-interference<br />
(see section 5.10 <strong>and</strong> Taylor, 1993). Pseudointerference<br />
refers to reduction in parasitoid efficiency<br />
resulting from an increasing number <strong>of</strong> host-parasitoid<br />
encounters involving previously parasitized hosts. By<br />
increasing this pseudo-interference, aggregation <strong>of</strong> risk<br />
makes host mortality less dependent on parasitoid<br />
density <strong>and</strong> conversely reduces per capita parasitoid<br />
recruitment. The result is that parasitoids have a lesser<br />
impact on host density <strong>and</strong> oscillations in parasitoid<br />
density are damped (Taylor, 1993). Stability is thus<br />
promoted.<br />
By partitioning Cv2 into components, it is possible<br />
to show that both density-dependent <strong>and</strong> densityindependent<br />
patterns <strong>of</strong> parasitoid distribution contribute<br />
to stability in the same way. What is<br />
particularly interesting <strong>and</strong> surprising about this approach<br />
is the finding that density-independent heterogeneity<br />
can contribute so much to stability. Hassell<br />
et al. (1991) <strong>and</strong> Pacala <strong>and</strong> Hassell (1991) examined<br />
the contribution <strong>of</strong> HDI <strong>and</strong> HDD to population<br />
stability by applying the CV2 criterion to five hostparasitoid<br />
models which made different assumptions<br />
about host <strong>and</strong> parasitoid distributions. In each case<br />
the CV2 rule was a good indicator <strong>of</strong> stability. However,<br />
the models examined did all make some<br />
assumptions-namely (i) that interactions between<br />
parasitoid <strong>and</strong> host were coupled <strong>and</strong> synchronized;<br />
(ii) that there were discrete host <strong>and</strong> parasitoid generations;<br />
(iii) that exploitation <strong>of</strong> hosts within a patch<br />
was r<strong>and</strong>om; <strong>and</strong> (iv) that there was no interference<br />
between parasitoids or competition between hosts.<br />
A criterion such as the CV2 rule is only <strong>of</strong> any use to<br />
a population ecologist if the parameters necessary to<br />
calculate CV2 can be estimated from field data. The<br />
rule, Cv2 > 1 is in terms <strong>of</strong> the distribution <strong>of</strong> searching<br />
parasitoids, but such data are rarely available from<br />
natural populations. Data from host-parasitoid interactions<br />
are usually in the form <strong>of</strong> a relationship<br />
between percentage parasitism <strong>and</strong> host density per<br />
patch; some examples are shown in Fig. 5.40. Pacala<br />
<strong>and</strong> Hassell (1991) explain how the parameters necessary<br />
to calculate Cv2 can be estimated from typical<br />
field data.<br />
Hassell <strong>and</strong> Pacala (1990) analysed 65 field studies<br />
that reported per cent parasitism <strong>and</strong> local host<br />
density per patch <strong>and</strong> from which estimates <strong>of</strong> CV2<br />
could be made. In 18 <strong>of</strong> these 65 studies CV2 > 1<br />
which suggests that the heterogeneity present, if it was<br />
repeated from generation to generation, would be<br />
sufficient to stabilize the interaction between the host<br />
<strong>and</strong> parasitoid populations. In 14 <strong>of</strong> the 18 examples<br />
in which Cv2 > 1, the component <strong>of</strong> heterogeneity<br />
that was independent <strong>of</strong> host density was greater than<br />
that which was dependent on host density, indicating<br />
that HDI heterogeneity contributes most to the total<br />
heterogeneity, <strong>and</strong> therefore most towards stability,<br />
more <strong>of</strong>ten than HDD heterogeneity. This finding goes<br />
against the conventional wisdom that stability can<br />
only be promoted by density-dependent factors alone.<br />
We shall return to this topic in Chapter 6.<br />
The spatial distributions <strong>of</strong> two tephritid flies (Urophora<br />
stylata (F.) <strong>and</strong> Terellia sewatulae L.) attacking<br />
thistle flower heads <strong>and</strong> the levels <strong>of</strong> parasitism from<br />
six associated parasitoids were examined over a<br />
7-year period in the field by Redfern et al. (1992).<br />
These data provide a rare opportunity to seek both<br />
temporal density-dependent parasitism between average<br />
parasitoid density <strong>and</strong> host density per generation
158 PART 2: INTERSPECIFIC INTERACTIONS<br />
Fig. 5.40 Three examples from field studies <strong>of</strong> different<br />
patterns <strong>of</strong> parasitism from patch to patch; (a) direct<br />
density-dependent parasitism <strong>of</strong> the scale insect Fiorinia<br />
externa by the eulophid parasitoid Aspidiotiphagus citrinus on<br />
the lower crown <strong>of</strong> 30 hemlock trees (McClure, 1977);<br />
(b) inverse density-dependent parasitism <strong>of</strong> gypsy moth<br />
Lymantria dispar eggs by the encyrtid parasitoid Ooencyrtus<br />
kuwanai (Brown & Cameron, 1979); (c) density-independent<br />
parasitism <strong>of</strong> gall midge Rhopalomyia californica by the<br />
toryrnid parasitoid Torymus baccaridis (Ehler, 1987). (After<br />
Hassell et al., 1991.)<br />
as well as any spatial patterns that may be operating<br />
within the same system, <strong>and</strong> to assess their relative<br />
contributions to stability using the approach outlined<br />
above. Figure 5.41 shows the relationship between<br />
total percentage parasitism <strong>and</strong> the density <strong>of</strong> the<br />
tephritid hosts per flower head. There is significant<br />
density-dependent mortality between total parasitism<br />
<strong>of</strong> T. sewatulae <strong>and</strong> host density per year (Fig. 5.41a),<br />
which is the result <strong>of</strong> the combined parasitism <strong>of</strong> the<br />
two main parasitoids, Pteromalus elevatus <strong>and</strong> Tetmstichus<br />
cirsii. The comparable analysis for Urophora<br />
stylata shows no such relationship (Fig. 5.41b). The<br />
spatial analysis <strong>of</strong> parasitism is summarized in<br />
Fig. 5.42, which shows the temporal variation in CV2<br />
<strong>and</strong> its HDI <strong>and</strong> HDD components for the total<br />
parasitism <strong>of</strong> each host species. Cv2 > 1 in 5 <strong>of</strong> the 6<br />
years in which parasitism was observed for U. stylata.<br />
In each case this stability is brought about largely as a<br />
result <strong>of</strong> HDI components <strong>of</strong> heterogeneity<br />
(Fig. 5.42a). Cv2 > 1 in only 1 <strong>of</strong> 5 years in which<br />
parasitism was observed for Terellia sewatulae, but once<br />
again HDI was responsible rather than HDD<br />
(Fig. 5.42b). The results <strong>of</strong> this study indicate how<br />
parasitism may be regulating two tephritid species.<br />
There appears to be conventional temporal densitydependence<br />
contributing to the stability <strong>of</strong> the interaction<br />
<strong>of</strong> T. sewatulae <strong>and</strong> its parasitoids with little<br />
evidence for stabilizing heterogeneity. In contrast,<br />
there is no evidence <strong>of</strong> temporal density-dependence<br />
in this relatively short run <strong>of</strong> data for Urophora stydata,<br />
but there is considerable potentially stabilizing heterogeneity,<br />
which may have a considerable impact on<br />
the dynamics <strong>of</strong> the host.<br />
How general is the CV2 > 1 rule? Future work is<br />
likely to show that it has been useful in focusing<br />
attention on the role <strong>of</strong> aggregation <strong>of</strong> risk in prornoting<br />
stability, rather than being absolutely right. While<br />
the rule holds for a range <strong>of</strong> non-overlapping generation<br />
discrete time host-parasitoid models, <strong>of</strong> the lype<br />
described by equation 5.1, it is clear that there is a<br />
range <strong>of</strong> factors not incorporated into the models <strong>of</strong><br />
Hassell et al. (1991) which can alter the degree <strong>of</strong><br />
aggregation <strong>of</strong> risk needed for stability. Some <strong>of</strong> these<br />
factors are common in nature. For example when the<br />
functional response <strong>of</strong> the parasitoid is type 1 (as
CHAPTER 5: PREDATION 159<br />
Fig. 5.41 Total parasitism from generation to generation in<br />
relation to the average density <strong>of</strong> tephritid hosts per flower<br />
head for the period 1982-88. Fitted line given by equation<br />
y = a + b log,, X. (a) Terellia serratulae: a = 56.07 (SE 10.45);<br />
b = 9.90 (SE 9.90); 1.2 = 0.75, P < 0.05; (b) Urophora stylata:<br />
a = 17.26 (SE 3.46); b = 11.70 (SE 10.49); ? = 0.44,<br />
P >. 0.05. (After Redfern et al., 1992.)<br />
assumed in the models examined above), densitydependent<br />
parasitism is always stabilizing. However,<br />
parasitoid functional responses are more typically <strong>of</strong><br />
type 2. In such cases initial increases in density-<br />
dependent aggregation from zero are destabilizing,<br />
<strong>and</strong> only large amounts <strong>of</strong> density-dependent parasitoid<br />
aggregation are stabilizing-when h<strong>and</strong>ling time<br />
reduces parasitoid efficiency in high host density<br />
patches (Ives, 1992a,b).<br />
The most obvious violation <strong>of</strong> the assumptions <strong>of</strong> the<br />
CV~ > 1 rule in its application to date is that many <strong>of</strong><br />
the field studies analysed, including the one described<br />
above, involve more than one parasitoid-host interaction<br />
<strong>and</strong> two or more competing host species. Others<br />
include several parasitoid species whose effect some-<br />
Fig. 5.42 Values <strong>of</strong> CV2 for the<br />
period 1982-88 for total parasitism<br />
<strong>of</strong> (a) Urophora stylata, <strong>and</strong> (b) Terellia<br />
serratulae. The proportional<br />
contribution <strong>of</strong> the host-densitydependent<br />
(dark shading) <strong>and</strong> hostdensity-independent<br />
(light shading)<br />
components to the total CV2 is also<br />
illustrated. (After Redfern et al.,<br />
1992.)
160 PART 2: INTERSPECIFIC INTERACTIONS<br />
times was lumped in total parasitism. The effects <strong>of</strong><br />
additional species vary. When two specialized parasitoids<br />
share a host species greater aggregation is<br />
required for stability than with a single parasitoid.<br />
However, a generalist parasitoid whose parasitism<br />
rate is positively correlated with host density provides<br />
additional stability (Taylor, 1993).<br />
The models considered in this section have been in<br />
discrete time with non-overlapping generations. The<br />
role <strong>of</strong> aggregation by parasitoids in a heterogeneous<br />
environment in continuous time models with overlapping<br />
generations is controversial. Murdoch <strong>and</strong><br />
Stewart-Oaten (1989) found that aggregation independent<br />
<strong>of</strong> host density did not affect stability <strong>and</strong> that<br />
aggregation to patches <strong>of</strong> high host density was<br />
typically destabilizing. Ives (1992a,b) concluded, <strong>and</strong><br />
we can only agree with him, that there is such a<br />
wealth <strong>of</strong> dynamic complexity in continuous-time<br />
models that it may be impossible to apply the conclusions<br />
from any model to a real parasitoid-host system<br />
without detailed observations <strong>and</strong> experiments on the<br />
hosts <strong>and</strong> parasitoids in question.<br />
5.13.3 A model <strong>of</strong> grazing systems<br />
We turn now to a model <strong>of</strong> grazing systems developed<br />
by Noy-Meir (1975). It is typical <strong>of</strong> a range <strong>of</strong> models,<br />
all <strong>of</strong> which essentially incorporate the 'Allee effect'<br />
(section 2.6); <strong>and</strong> all such models indicate that predators<br />
<strong>and</strong> their prey (in this case grazers <strong>and</strong> their food<br />
plants) can coexist at more than one stable equilibrium<br />
(see May, 1977 for a review).<br />
We have already seen (in section 5.5.1) that plant<br />
populations, with the individuals growing as multiply<br />
branched units, may not necessarily exhibit a simple<br />
pattern <strong>of</strong> population growth. In particular, we argued<br />
that the rate <strong>of</strong> vegetative growth may be conveniently<br />
expressed in terms <strong>of</strong> photosynthetic assimilation, the<br />
net assimilation rate being the rate <strong>of</strong> biomass growth<br />
having accounted for respiratory losses. Figure 5.43<br />
demonstrates that if the rate <strong>of</strong> growth in biomass is<br />
plotted against the leaf area index (the ratio <strong>of</strong> total<br />
leaf area to horizontal ground beneath the canopy),<br />
then there is an intermediate, optimum index which<br />
maximizes growth-rate-a result <strong>of</strong> the shifting balance<br />
between photosynthesis <strong>and</strong> respiration as biomass<br />
<strong>and</strong> shading increase. Not surprisingly, since<br />
total biomass <strong>and</strong> leaf area index are so closely<br />
associated, there is also a humped, curved relationslhip<br />
between growth-rate <strong>and</strong> biomass. The actual shape<br />
<strong>of</strong> such curves (e.g. Fig. 5.44) will depend on the<br />
interaction <strong>of</strong> many factors (see Blackman, 1968 for a<br />
review), but in all cases an optimum biomass will<br />
exist, yielding a maximum growth-rate.<br />
Conversely, the removal <strong>of</strong> vegetation biomass occurs<br />
as a result <strong>of</strong> grazing, <strong>and</strong> we have seen that the<br />
rate <strong>of</strong> herbivore consumption depends on a variety <strong>of</strong><br />
factors. In broad terms, however, consumption-rate is<br />
likely to follow the saturation curve <strong>of</strong> a 'type 2' or,<br />
more rarely, a 'type 3' functional response (section<br />
5.7). Of course, the total rate <strong>of</strong> herbivore consumption<br />
will increase with herbivore density. This will result in<br />
Fig. 5.43 (a) Idealized relationship<br />
between crop growth-rate <strong>and</strong> leaf<br />
area index. (b) Actual relationship<br />
found in subterranean clover by<br />
Davidson <strong>and</strong> Donald (1958). (After<br />
Donald, 1961 .)
CHAPTER 5: PREDATION 161<br />
Fig. 5.44 Plant growth in New Zeal<strong>and</strong> ryegrass-clover<br />
pastures as a function <strong>of</strong> biomass (Brougharn. 1955. 1956).<br />
(After Noy-Meir, 1975 .)<br />
a family <strong>of</strong> curves, all <strong>of</strong> similar shape, but with the<br />
height <strong>of</strong> the maximal, saturation consumption-rate<br />
itseIf increasing with herbivore density (see, for instance,<br />
Fig. 5.45a).<br />
We now have two families <strong>of</strong> curves; <strong>and</strong> they can<br />
be used to model the outcome <strong>of</strong> grazing by superimposing<br />
them on one another, because the difference<br />
between the rates <strong>of</strong> growth <strong>and</strong> consumption gives<br />
the net change in the growth-rate <strong>of</strong> vegetation biomass.<br />
In Figs 5.45a, 5.46a, 5.47a <strong>and</strong> 5.48a, the<br />
growth- <strong>and</strong> consumption-rates are plotted against<br />
biomass for four different sets <strong>of</strong> conditions. These<br />
allow the net growth-rates to be inferred for various<br />
combinations <strong>of</strong> herbivore density <strong>and</strong> biomass, <strong>and</strong><br />
this information is summarized in the corresponding<br />
Figs 5.45b, 5.46b, 5.47b <strong>and</strong> 5.48b. These illustrate<br />
the positions <strong>of</strong> the biomass zero isoclines, separating<br />
circumstances <strong>of</strong> positive <strong>and</strong> negative biomass<br />
growth.<br />
The simplest grazing model is shown in Fig. 5.45.<br />
For each type 2 herbivore consumption curve<br />
(Fig. 5.45a), biomass increases below point A (because<br />
Fig. 5.45 (a) Rates <strong>of</strong> plant growth <strong>and</strong> herbivore<br />
consumption (at a range <strong>of</strong> herbivore densities) plotted<br />
against plant biomass. A,, A, <strong>and</strong> A, are stable equilibria<br />
at which growth- <strong>and</strong> consumption-rates are equal. (b) The<br />
isocline dividing combinations <strong>of</strong> plant biomass <strong>and</strong><br />
herbivore density which lead to biomass increase (arrows<br />
left to right) from combinations which lead to biomass<br />
decrease (arrows right to left). (After Noy-Meir, 1975.) For<br />
further discussion, see text.
162 PART 2: INTERSPECIFIC INTERACTIONS<br />
Fig. 5.46 Similar to Fig. 5.45 except that in (a), as a result<br />
<strong>of</strong> altered consumption-rate curves, there is an unstable<br />
equilibrium at intermediate herbivore densities, B,; <strong>and</strong> in<br />
(b) there is a shaded area close to the isocline, indicating<br />
combinations <strong>of</strong> plant biomass <strong>and</strong> herbivore density at<br />
which minor changes in either could alter the outcome<br />
from stable equilibrium to plant decline <strong>and</strong> ultimate<br />
extinction, or vice versa. For further discusion, see text.<br />
growth exceeds consumption), but decreases above<br />
point A (consumption exceeds growth). Each point A<br />
is, therefore, a stable equilibrium. As herbivore densites<br />
increase, however, (<strong>and</strong> total consumption increases)<br />
the level <strong>of</strong> stable biomass reduces (shown by<br />
the shape <strong>of</strong> the isocline in Fig. 5.45b), <strong>and</strong> at herbivore<br />
densities exceeding some critical value, consumption<br />
is greater than growth for all levels <strong>of</strong> biomass <strong>and</strong><br />
the plant population is driven to extinction; this is<br />
obviously not unreasonable.<br />
A slightly more complex situation, in which the<br />
consumption curve reaches saturation more suddenly,<br />
is shown in Fig. 5.46. The outcome is unchanged at<br />
low herbivore densities (equilibrium) <strong>and</strong> at high<br />
herbivore densities (extinction); but at intermediate<br />
densities, the consumption-rate curve crosses the<br />
growth-rate curve twice (points A <strong>and</strong> B). As before,<br />
biomass decreases above point A (because consurnption<br />
exceeds growth), but this is now also true below<br />
point B; while between points A <strong>and</strong> B, growth<br />
exceeds consumption, <strong>and</strong> biomass increases. Point A<br />
is, therefore, still an essentially stable equilibrium, but<br />
point B is an unstable turning point. A biomass slightly<br />
less than B will decrease to extinction, driven by<br />
overconsumption; a biomass slightly greater than B<br />
will increase to the stable equilibrium at point AL. As<br />
Fig. 5.46b makes clear, then, there is an intermediate<br />
range <strong>of</strong> herbivore densities at which either equilibrium<br />
or extinction is possible, <strong>and</strong> small changes in<br />
herbivore density or vegetation biomass occurring<br />
close to the isocline in this region (hatched in<br />
Fig. 5.46b) can obviously have crucial effects on the<br />
outcome <strong>of</strong> the interaction.<br />
In Figs 5.47 <strong>and</strong> 5.48 two even more complex<br />
situations are illustrated, but in general terms the<br />
outcomes are the same in both. Figure 5.47 represents<br />
a plant population that maintains a reserve <strong>of</strong> material<br />
which is not accessible to grazers (underground storage<br />
organs, for example, or plant parts which are<br />
inedible). The origin <strong>of</strong> the growth-rate curve is,<br />
therefore, displaced to the left <strong>of</strong> the origin <strong>of</strong> the<br />
consumption-rate curve. Figure 5.48 represents a herbivore<br />
population exhibiting a 'type 3' functional<br />
response. In both cases, the outcome is unchanged at<br />
low herbivore densities; there is a single, stable<br />
equilibrium (point A).
CHAPTER 5: PREDATION 163<br />
Fig. 5.47 Similar to Fig. 5.46 except that there is a 'reserve'<br />
<strong>of</strong> ungrazable plant biomass. As a consequence there are in<br />
(a) low biomass stable equilibria at high <strong>and</strong> intermediate<br />
herbivore densities (C2 <strong>and</strong> C,). The shaded area in (b),<br />
therefore, indicates combinations <strong>of</strong> plant biomass <strong>and</strong><br />
Pit high herbivore densities, however, the plant<br />
population is no longer driven to extinction (ungrazable<br />
reserves <strong>and</strong> type 3 responses stabilize the<br />
interaction). Instead there is a point, C,, at which the<br />
two curves cross, such that growth exceeds consumption<br />
below C,, while consumption exceeds growth<br />
Fig. 5.48 Similar to Figs 5.45 <strong>and</strong> 5.46 except that the<br />
herbivores exhibit a sigmoidal, type 3 functional response.<br />
In other respects the figure is like Fig. 5.47. For further<br />
discussion, see text.<br />
herbivore density at which minor changes in either could<br />
alter the outcome from low biomass stable equilibrium to<br />
high biomass stable equilibrium, <strong>and</strong> vice versa. For further<br />
discussion, see text.<br />
above it. These high density cases are, therefore, also<br />
characterized by a single, stable equilibrium. However,<br />
while the low herbivore density equilibria were<br />
maintained at a high biomass by the self-regulatory<br />
properties <strong>of</strong> the plants, these high herbivore density<br />
equilibria are maintained at a low biomass by either<br />
the ungrazable reserves <strong>of</strong> the plants or the functional<br />
response <strong>of</strong> the herbivore.<br />
Moreover, at intermediate herbivore densities in<br />
Figs 5.47a <strong>and</strong> 5.48a, the consumption curve crosses
164 PART 2: INTERSPECIFIC INTERACTIONS<br />
the growth curve at three points (A,, B, <strong>and</strong> C,). As<br />
before, point A is a high biomass stable equilibrium,<br />
point C is a low biomass stable equilibrium, <strong>and</strong> point<br />
B is an unstable turning point. Populations in the<br />
region <strong>of</strong> point B, therefore, might increase to point A<br />
or decrease to point C, depending on very slight,<br />
perhaps r<strong>and</strong>om changes in circumstances. These<br />
plant-herbivore systems have alternative stable states;<br />
<strong>and</strong> a small change in the size <strong>of</strong> either the plant or the<br />
grazer population in the hatched regions <strong>of</strong> Figs 5.47b<br />
or 5.48b can shift the system rapidly from one stable<br />
state to the other. The crucial point, therefore, is that<br />
systems with ungrazable reserves or type 3 functional<br />
responses may undergo sudden drastic changes in<br />
population levels, which are nonetheless grounded in<br />
the regulatory dynamics <strong>of</strong> the interaction.<br />
It is difficult to evaluate this model's predictions<br />
critically, because much <strong>of</strong> the data on grazing is not<br />
amenable to this form <strong>of</strong> analysis. Yet the available<br />
evidence for Australian pastures certainly suggests<br />
that combinations <strong>of</strong> observed growth <strong>and</strong> consumption<br />
curves may well lead to situations with alternative<br />
stable states (Fig. 5.49); <strong>and</strong> as Noy-Meir (1975) has<br />
argued, the predictions <strong>of</strong> the model are borne out by<br />
the experiences <strong>of</strong> agronomists <strong>and</strong> range managers.<br />
In particular, one practice <strong>of</strong>ten recommended in the<br />
Fig. 5.49 Experimentally obtained curves <strong>of</strong> growth, G<br />
(ryegrass <strong>and</strong> subterranean clover) <strong>and</strong> consumption, C (by<br />
sheep), st<strong>and</strong>ardized to maximum rates <strong>of</strong> 100%. (After<br />
Noy-Meir, 1975 .)<br />
management <strong>of</strong> grazing stock is to delay the start <strong>of</strong><br />
grazing until a minimum <strong>of</strong> vegetation growth has<br />
been exceeded. It is clear that for a given herbivore<br />
density this will tend to prevent extinction in Fig. 5.46,<br />
while in Figs 5.47 <strong>and</strong> 5.48 it will favour a high<br />
biomass equilibrium, where the plant growth-rate <strong>and</strong><br />
thus the food available to the grazers will also be high.<br />
Finally, it must be admitted that this 'one plant/one<br />
grazer' model is an unrealistic abstraction <strong>of</strong> the real,<br />
multi-species world. Nevertheless, it provides a sirnple<br />
<strong>and</strong> effective framework for the comparison <strong>and</strong><br />
analysis <strong>of</strong> plant-herbivore dynamics, <strong>and</strong> also indicates<br />
the complex, indeterminate, multi-equilibrial<br />
behaviour <strong>of</strong> predator-prey systems generally.<br />
5.14 'Patterns <strong>of</strong> abundance'<br />
reconsidered<br />
This chapter began, after some preliminary definitions,<br />
with an outline survey <strong>of</strong> the patterns <strong>of</strong><br />
abundance associated with predation; <strong>and</strong>, since 'predation'<br />
was defined so inclusively, this was effectively<br />
a survey <strong>of</strong> abundance patterns generally. Now, having<br />
examined many <strong>of</strong> the components <strong>of</strong> 'predatory'<br />
interactions, we ought to be in a position to reconsider<br />
these patterns. But we must remember that no<br />
'predator-prey system' exists in a vacuum: both<br />
species will also be interacting with further species in<br />
the same or different trophic levels. Thus, Anderson<br />
(1979) considered that parasites probably <strong>of</strong>ten play a<br />
complementary role in the regulation <strong>of</strong> host population~,<br />
increasing their susceptibility to predation<br />
(though evidence for this is mainly anecdotal). Similary,<br />
Whittaker (1979) concluded that quite moderate<br />
levels <strong>of</strong> grazing will <strong>of</strong>ten produce a severe effect on a<br />
target plant when (<strong>and</strong> because) they are combined<br />
with (otherwise ineffective) interspecific plant competition.<br />
Lawton <strong>and</strong> McNeill (1979) concluded that<br />
plant-feeding insects stood between the 'devil' <strong>of</strong> their<br />
natural enemies, <strong>and</strong> the 'deep blue sea' <strong>of</strong> '. . . food<br />
that, at best, is <strong>of</strong>ten nutritionally inadequate <strong>and</strong>, at<br />
worst, is simply poisonous'. Finally, Keith (19163)<br />
suggested because <strong>of</strong> hare cycles on a lynx-free isl<strong>and</strong><br />
that the (supposedly) classical snowshoe hare/Canada<br />
lynx predator-prey oscillations (see Fig. 5.la) are
CHAPTER 5: PREDATION 165<br />
actually a result, at least in part, <strong>of</strong> the hare's<br />
interaction with its food. It is clear, in short, that to<br />
truly underst<strong>and</strong> the patterns <strong>of</strong> abundance exhibited<br />
by different types <strong>of</strong> species, we must consider,<br />
synthetically, all <strong>of</strong> their interactions.<br />
Nevertheless, it is apparent from this chapter that we<br />
have at our disposal a wealth <strong>of</strong> plausible explanations<br />
for the patterns <strong>of</strong> abundance that occur. Individually,<br />
each <strong>of</strong> the components can give rise to a whole range<br />
<strong>of</strong> abundance patterns, <strong>and</strong> in combination their potentialities<br />
are virtually limitless. What we lack, regrettably,<br />
is the sort <strong>of</strong> detailed field information that would<br />
allow us to decide which explanations apply in which<br />
particular situations. We are forced, simply, to conclude-<strong>and</strong><br />
this is especially apparmt in the mathematical<br />
models-that observed patterns <strong>of</strong> abundance<br />
reflect a state <strong>of</strong> dynamic tension between the various<br />
stabilizing <strong>and</strong> destabilizing aspects <strong>of</strong> the interactions.<br />
Beyond this, we can point to food aggregation, <strong>and</strong><br />
the 'aggregative responses <strong>of</strong> consumers to this aggregation,<br />
as probably the single most important factor<br />
stabilizing predator-prey interactions. Indeed, Beddington<br />
et al. (1978) noted that the biological control <strong>of</strong><br />
insect pests is characterized by a persistent, strong<br />
reduction in the pest population following the introduction<br />
<strong>of</strong> a natural enemy (i.e. stability at low q); <strong>and</strong><br />
they suggested, from the analysis <strong>of</strong> mathematical<br />
models, that the mechanism which is most likely to<br />
account for this is the differential exploitation <strong>of</strong> pest<br />
patches in a spatially heterogeneous environment.<br />
(Even more important than this is the fact that they<br />
were able to marshal several field examples in support<br />
<strong>of</strong> this suggstion.) In brief, it appears that aggregation<br />
is <strong>of</strong> very general significance in maintaining prey<br />
populations at stable, low densities.<br />
A further insight, stemming from mathematical<br />
models, is that predator-prey systems can exist in<br />
more than one stable state. Indeed the model in the<br />
previous section is only one <strong>of</strong> a range that possess<br />
such properties (see May, 1977, 1979 for reviews),<br />
<strong>and</strong> this range covers predator-prey, host-parasitoid,<br />
plant-herbivore <strong>and</strong> host-parasite interactions. We<br />
therefore have a ready explanation for parasite epidemics,<br />
pest outbreaks, <strong>and</strong> sudden, drastic alterations<br />
in density generally.<br />
Finally, in general, we have seen that very similar<br />
principles apply to all those interactions included<br />
within the blanket term 'predation'; <strong>and</strong> in all cases,<br />
there has been considerable progress in underst<strong>and</strong>ing<br />
the details underlying the relationships. Overall,<br />
however, it must be admitted that while there is<br />
nothing in the observed patterns <strong>of</strong> abundance that<br />
should surprise us by being essentially inexplicable,<br />
we are rarely in a position to apply specific explanations<br />
to particular sets <strong>of</strong> field data.<br />
5.1 5 Harvesting<br />
In this section, we are concerned with examining the<br />
dynamics <strong>of</strong> populations that regularly suffer loss <strong>of</strong><br />
individuals as a consequence <strong>of</strong> the deliberate attentions<br />
<strong>of</strong> mankind, through cropping or harvesting. In<br />
all predator-prey interactions the predator will pr<strong>of</strong>it<br />
by maximizing the crop taken while ensuring that the<br />
prey does not become extinct; <strong>and</strong> we have already<br />
seen, in this chapter, that in natural populations the<br />
survival <strong>of</strong> a certain number <strong>of</strong> prey individuals will<br />
tend to be ensured as a by-product <strong>of</strong> certain features<br />
<strong>of</strong> the interaction. In the instances involving man as<br />
the harvester, however, the problem <strong>of</strong> conscious<br />
harvest optimization remains, i.e. the problem <strong>of</strong><br />
ensuring neither over-exploitation (hastening extinction)<br />
nor under-exploitation (cropping less than the<br />
prey population can sustain). It is with this in mind<br />
that many ecologists have devoted considerable attention<br />
to the manner in which plant <strong>and</strong> animal<br />
populations can be exploited for the benefit <strong>of</strong> mankind.<br />
5.1 5.1 Characteristics <strong>of</strong> harvested populations<br />
From the outset we can see, from common sense<br />
alone, that the first, immediate consequence <strong>of</strong> harvesting<br />
is to reduce the size <strong>of</strong> the population, <strong>and</strong> this,<br />
in turn, will generally affect the life expectancy <strong>and</strong><br />
fecundity <strong>of</strong> the survivors in the harvested population.<br />
Nicholson (1954a), for instance, cultured Australian<br />
sheep blowflies (Lucilia cuprina) under conditions that<br />
restricted adult food supplies but provided larvae with<br />
a food excess (ensuring very little larval mortality). His
166 PART 2: INTERSPECIFIC INTERACTIONS<br />
Table 5.9 Effects produced in populations <strong>of</strong> the blowfly, Lucilla cuprina, by the destruction <strong>of</strong> different constant percentages<br />
<strong>of</strong> emerging adults. (After Nicholson, 1954a.)<br />
results (Table 5.9) show that, whilst the adult population<br />
declined with increasing exploitation, both pupal<br />
production <strong>and</strong> adult emergence increased, resulting in<br />
an overall increase in the 'birth'-rate. Coincident with<br />
this rise, moreover, was a decrease in the rate <strong>of</strong><br />
natural adult death, <strong>and</strong> this led to extension <strong>of</strong> the<br />
mean adult life span. The reduction in population size<br />
resulting from the act <strong>of</strong> harvesting, therefore, brought<br />
about two changes: (i) increased fecundity <strong>of</strong> surviving<br />
adults; <strong>and</strong> (ii) reduced adult mortality; <strong>and</strong>, indeed,<br />
we might have expected this from our knowledge <strong>of</strong><br />
the effects <strong>of</strong> intraspecfic competition (Chapter 2).<br />
Reduction in population density in a resource-limited<br />
environment tends to benefit the individual survivors.<br />
The act <strong>of</strong> harvesting also has an important effect on<br />
the rate <strong>of</strong> regrowth <strong>of</strong> the population. This can easily<br />
be seen by considering a population undergoing<br />
density-dependent regulation <strong>and</strong> following a logistic<br />
growth curve (Fig. 5.50). At a point in time, t, (when<br />
the population has reached a size, N,) we remove<br />
some individuals from the population, i.e. we crop it.<br />
The population will continue to grow, but from the<br />
reduced size (H,) that it had already reached at time<br />
t,. Clearly, the rate <strong>of</strong> growth <strong>of</strong> the population after<br />
harvesting (the slope <strong>of</strong> the curve) will depend on the<br />
time at which the harvesting occurred. If removal<br />
takes place early (Fig. 5.50a), then the rate <strong>of</strong> subsequent<br />
growth will be low, <strong>and</strong> indeed reduced by<br />
harvesting. If removal takes place late (Fig. 5.50c),<br />
then the rate <strong>of</strong> growth, though increased, will also be<br />
low. If, however, it takes place when the population is<br />
growing most rapidly (Fig. 5.50b), then the rate will be<br />
high <strong>and</strong> largely unchanged by the removal. Moreover,<br />
the population size prior to harvest <strong>and</strong> the rate<br />
<strong>of</strong> subsequent regrowth are also related to the size <strong>of</strong><br />
repeated harvests taken after a unit period <strong>of</strong> recovery<br />
(Figs 5 S O <strong>and</strong> 5.5 1). At low population sizes, successive<br />
harvests are small (Fig. 5 Sla), but with increasing<br />
population size they increase steadily to a maximum<br />
<strong>and</strong> then decline; <strong>and</strong> as Fig. 5.5 1b shows, there is a<br />
parabolic relationship between harvest size <strong>and</strong> population<br />
size. There is, therefore, an optimal size at which<br />
a population can be maintained, which, on repeated<br />
harvesting, ensures a maximum sustainable harvest;<br />
<strong>and</strong> repeated harvesting at this size is also followed by<br />
the rapid recovery <strong>of</strong> the population because its rate <strong>of</strong><br />
regrowth is maximal. Note that in the case <strong>of</strong> Nicholson's<br />
blowflies (see Table 5 .g), harvest-size ('adults<br />
destroyed per day') continued to rise as the exploitation<br />
level increased <strong>and</strong> the mean population size<br />
decreased. There was also a consistent rise in the rate<br />
<strong>of</strong> regrowth (compounded from an increased number<br />
<strong>of</strong> 'adults emerged' <strong>and</strong> a decreased rate <strong>of</strong> 'natural<br />
adult death'). It seems, therefore, that these populations<br />
were towards the right-h<strong>and</strong> side <strong>of</strong> the appropriate<br />
parabola, where intraspecific competition was<br />
fairly intense. For the logistic equation itself, the<br />
optimum population size is in fact K12 (where K is the<br />
carrying-capacity) <strong>and</strong> we can show this mathematically<br />
by differential calculus. (Readers familiar with<br />
calculus will know that 'finding the maximum <strong>of</strong> a<br />
function' involves differentiating the appropriate<br />
equation-the logistic in this case-setting the derivative<br />
to zero, <strong>and</strong> solving for N.) The important biolo-
CHAPTER 5: PREDATION 167<br />
Some justification for this type <strong>of</strong> model is provided<br />
by studies <strong>of</strong> harvested fish populations. Since it is<br />
impossible to estimate the sizes <strong>of</strong> oceanic fish population<br />
numerically, stock sizes (or total biomass) can be<br />
used instead. The equation describing the changes<br />
must be:<br />
Sycar = Sycar + Rec + G - D - C<br />
where S is stock size, <strong>and</strong> Rec is recruitment <strong>of</strong> stock, G<br />
growth, D loss by natural mortality <strong>and</strong> C stock caught<br />
by fishing. If stock size remains constant from one<br />
year to the next then:<br />
Fig. 5.50 The effects <strong>of</strong> harvesting at (a) early, (b) middle<br />
ancl (c) late stages <strong>of</strong> population growth with the population<br />
growing logistically. For further discussion, see text.<br />
gical point to realize, however, is that the maximum<br />
sustainable harvest is not obtained from populations<br />
at the carrying-capacity, K, but from populations at<br />
lower, intermediate densities, where they are growing<br />
fastest. The exact shape <strong>of</strong> the hawest parabola depends<br />
on the growth function, <strong>and</strong> the harvest parabolas <strong>of</strong><br />
different sigmoidal growth curves will vary accordingly.<br />
The 'logistic' parabola is symmetrical because<br />
the logistic curve itself is symmetrical.<br />
In other words, at any stock size, if the stock is in a<br />
steady state, then the gains from recruitment <strong>and</strong><br />
growth will be exactly <strong>of</strong>fset by the losses from natural<br />
mortality <strong>and</strong> fishing. So, if the stock is growing<br />
logistically, <strong>and</strong> we wish to maintain steady-state conditions,<br />
then we must exploit the stock according to the<br />
harvest parabola. Figure 5.52a shows the catch sizes<br />
<strong>of</strong> yellow fin tuna from 1934 to 1955 plotted against<br />
fishing intensity (a measure recorded by the fishing<br />
industry that may easily be related to stock size).<br />
Interestingly, the actual recorded catches do seem to<br />
lie on the estimated harvest parabola; <strong>and</strong> indeed the<br />
size <strong>of</strong> the catch from 1934 to 1950 was increased by<br />
100 million pounds without destroying the fish population,<br />
<strong>and</strong> from 1948 onwards large catches could be<br />
sustained. A fairly similar situation is shown for a<br />
lobster fishery in Fig. 5.52b. It does appear, therefore,<br />
that at least some fisheries are regulated in a densitydependent<br />
<strong>and</strong> possibly even logistic fashion.<br />
It would be gratifying to be able to claim that the<br />
management <strong>and</strong> conservation <strong>of</strong> all exploited fish<br />
populations are based on detailed knowledge <strong>and</strong><br />
careful modelling. Yet, while substantial research in<br />
the fishing industry has deepened our underst<strong>and</strong>ing<br />
<strong>of</strong> the factors influencing the stability <strong>and</strong> yield <strong>of</strong><br />
exploited populations (Beverton & Holt, 195 7; Gull<strong>and</strong>,<br />
1962), for three main reasons we are still unable<br />
to fully comprehend their dynamics. The first reason is<br />
a genuine ignorance <strong>of</strong> population dynamics: obtaining<br />
the data for long-lived species dem<strong>and</strong>s extensive<br />
<strong>and</strong> <strong>of</strong>ten expensive study over many seasons. The
168 PART 2: INTERSPECIFIC INTERACTIONS<br />
Fig. 5.51 (a) Growth increments in unit periods <strong>of</strong> time at<br />
different stages <strong>of</strong> growth <strong>of</strong> a population growing<br />
logistically. (b) The parabolic relationship between these<br />
increments (or, alternatively, the size <strong>of</strong> repeated harvests)<br />
<strong>and</strong> population size.<br />
second reason is that many populations are structured,<br />
<strong>and</strong> we shall consider this problem presently.<br />
The third reason is environmental variability. The<br />
environment, particularly climate, frequently affects<br />
natural populations independently <strong>of</strong> density, <strong>and</strong><br />
environmental fluctuations may, therefore, create<br />
considerable difficulty in the evaluation <strong>of</strong> the effects<br />
<strong>of</strong> harvesting on population size. This is illustrated by<br />
data on the Pacific sardine, Sardinops caemlea, <strong>of</strong>f the<br />
coast <strong>of</strong> California, where the annual catch exhibits<br />
extreme fluctuations (Fig. 5.53a). There has been<br />
considerable controversy over the relationship between<br />
the population sizes <strong>of</strong>: (i) the 'spawning stock';<br />
(ii) the mature breeding fish (2 years old <strong>and</strong> over); <strong>and</strong><br />
(iii) the 2-year-old recruits; <strong>and</strong> although Murphy<br />
(1967) has established that the number <strong>of</strong> recruits is<br />
partly determined by the water temperature when the<br />
fish were spawned (Fig. 5.53b), there are other environmental<br />
variables that play a highly significant role.<br />
The movements <strong>of</strong> ocean currents within the coastal<br />
nursery grounds, for instance, are <strong>of</strong>ten seasonally<br />
erratic, <strong>and</strong> young planktonic fish may be swept into<br />
the deep ocean where they are unlikely to survive.<br />
Temperature, currents <strong>and</strong> other factors, then, are all<br />
likely to blur any relationship between the size <strong>of</strong> the<br />
breeding population <strong>and</strong> the number <strong>of</strong> <strong>of</strong>fspring born<br />
to it. However, Radovich (1962) has argued that the<br />
recruitment relationship is in fact curvilinear with a<br />
recognizable optimum. Thus, in Fig. 5.53~ three<br />
curves have been drawn: I1 gives the best statistical fit<br />
to the data, while I <strong>and</strong> I11 have been drawn by<br />
inspection to encompass the variability observed. I<br />
represents the relationship we might expect when<br />
environmental factors combine to give the 'best'<br />
possible conditions, <strong>and</strong> I11 the relationship for the<br />
'worst' conditions. The clear consequence <strong>of</strong> this<br />
underlying curvilinearity is that recruitment tends to<br />
be little affected by changes in spawning stock size<br />
near the optima, but is more drastically affected at the<br />
extremes. The utility <strong>of</strong> these curves stems from the
CHAPTER 5: PREDATION 169<br />
Fig. 5.52 (a) The relationship between fishing intensity <strong>and</strong><br />
yield <strong>of</strong> yellow fin tuna in the eastern pacific between 1934<br />
<strong>and</strong> 1955. The curved line is the estimated harvest<br />
parabola (Schaefer, 1957). (After Watt, 1968). (b) Similar<br />
relationship for the western rock lobster Palinurus cygnus<br />
(Hancock, 1979). (After Beddington, 1979.)<br />
ability they give us to assess the levels <strong>of</strong> fishing that<br />
safeguard against extinction even under the poorest<br />
circumstances. If for instance we wish to ensure a<br />
consistent recruitment X (Fig. 5.53c), then the bare<br />
Fig. 5.53 (a) The annual catch <strong>of</strong> the Californian sardine,<br />
<strong>and</strong> (b) the effect <strong>of</strong> sea temperature on the recruitment <strong>of</strong><br />
the sardine (Watt, 1968). (c) The average parabola relating<br />
the number <strong>of</strong> recruits to the size <strong>of</strong> the spawning stock,<br />
together with the maximum <strong>and</strong> minimum parabolas<br />
(Radovich, 1962). For further discussion, see text. (After<br />
Usher, 1972.)
170 PART 2: INTERSPECIFIC INTERACTIONS<br />
minimum <strong>of</strong> stock that must be left after harvesting<br />
under the 'average' conditions is S,. The difference,<br />
S, - S,, represents the additional stock that should not<br />
be harvested if we wish to guarantee recruitment<br />
when recruitment is lowest, in the 'poorest' environment.<br />
Overall, the problems <strong>of</strong> incorporating environmental<br />
variability into a predictive harvesting model<br />
are readily apparent (but see lles, 1973 for a more<br />
sophisticated attempt to overcome these problems).<br />
We are now in a position to review some <strong>of</strong> the<br />
consequences <strong>of</strong> harvesting. First, it is quite clear that<br />
populations can be systematically exploited with a<br />
consequent reduction in population size. It is also<br />
clear that harvests can be optimized (i.e. the size <strong>of</strong><br />
repeated harvests maximized) by harvesting at some<br />
intermediate density where the population growth-rate<br />
is greatest. However, such harvesting is only sustainable<br />
at an exploitation-rate that allows sufficient time<br />
for the replacement <strong>of</strong> cropped individuals. This<br />
period <strong>of</strong> time will depend on the fecundity <strong>and</strong><br />
generation time <strong>of</strong> the species in question. It is easy to<br />
imagine an intensity <strong>of</strong> harvesting (an exploitationrate)<br />
in excess <strong>of</strong> the replacement-rate, such that the<br />
population declines to extinction ('stepping down' the<br />
curve in Fig. 5.51a). We can also conclude (from the<br />
Lucilia population, <strong>and</strong> from a consideration <strong>of</strong> intraspecific<br />
competition) that the fitness <strong>of</strong> survivors in a<br />
harvested population is <strong>of</strong>ten increased.<br />
5.15.2 Harvesting in structured populations<br />
In practice, many harvesting procedures deliberately<br />
select individuals to be cropped. In fishing, for instance,<br />
many nets permit small fry to escape so that<br />
large (<strong>and</strong> possibly older) individuals are captured. In<br />
other situations (seal culling for instance) small or<br />
young members are the principal object <strong>of</strong> the harvest.<br />
We must therefore consider the age <strong>and</strong> size composition<br />
<strong>of</strong> populations being exploited.<br />
To investigate the properties <strong>of</strong> such structured<br />
populations in the field under particular harvesting<br />
regimes is an immensely arduous task, <strong>and</strong>, in consequence,<br />
many workers have utilized relatively simple<br />
laboratory systems. A good example is the work <strong>of</strong><br />
Slobodkin <strong>and</strong> Richman (1956) using water fleas<br />
(Daphnia pulicaria), which breed continuously<br />
throughout the year <strong>and</strong> possess a prodigious capability<br />
for population increase by virtue <strong>of</strong> the very large<br />
number <strong>of</strong> eggs they lay. They are also particullarly<br />
convenient for harvesting studies because they have a<br />
short life span; <strong>and</strong> in their population structure we<br />
can recognize young, adolescent <strong>and</strong> adult foirms.<br />
Figures 5.54a <strong>and</strong> 5.54b show the consequences <strong>of</strong><br />
taking harvests every 4 days from Daphnia populations<br />
which were maintained with a constant supply <strong>of</strong> food<br />
at a constant temperature for about 9 months. Harvesting<br />
was aimed specifically at the smallest size-class<br />
which (apart from a few young adolescents) contained<br />
Daphnia which were less than 4 days old. The population<br />
structure in the absence <strong>of</strong> harvesting is shown<br />
in Fig. 5.54a, %%': the numbers per class decline to a<br />
minimum at,the large adolescent stage (LA), <strong>and</strong> the<br />
adult class is the most abundant (the data are presented<br />
on a logarithmic scale). Increasing the proportion<br />
<strong>of</strong> young fleas harvested had two main effects.<br />
The first was to reduce consistently the total population<br />
size (Fig. 5.54a & 5.54b). The second was to alter<br />
the population structure (Fig. 5.54a): as the harvesting<br />
<strong>of</strong> small Daphnia increased from 25 to 90% <strong>of</strong> their<br />
number, the discrepancy between young, small <strong>and</strong><br />
large adolescent frequencies diminished. We may note<br />
in addition, however, that 90% exploitation did not<br />
push the population towards extinction, <strong>and</strong> indeed,<br />
there was a consistent rise in total yield as<br />
exploitation-rate increased (Fig. 5.54b). This occurred<br />
because the yield per individual rose quickly enough to<br />
more than compensate for the decline in population<br />
size (Fig. 5.54b); <strong>and</strong> this consistent rise in the fitness<br />
<strong>of</strong> survivors (cf. Nicholson's blowflies) was also1 reflected<br />
by a steady increase in life expectancy averaged<br />
over all size-classes (Fig. 5.54a). Such increases<br />
were associated, moreover, with a consistent rise in<br />
the proportion in the population <strong>of</strong> the exploited,<br />
youngest class prior to harvesting (Fig. 5.54c), i.e. a<br />
further indication <strong>of</strong> the changing population structure.<br />
This presumably occurred because exploitation<br />
reduced the numbers available to enter the older<br />
classes, <strong>and</strong> also reduced intraspecific competition,<br />
leading to an increased per capita production <strong>of</strong> the<br />
youngest class such that its proportion in the poyula-
CHAPTER 5: PREDATION<br />
Median life expectancy<br />
<strong>of</strong> survivors (days):<br />
YSALAA YSALAA YSALAA YSALAA<br />
Exploitation rate 0% 25% 50% 75%<br />
YSALAA<br />
100%<br />
Fig. 5.54 (a) The effect <strong>of</strong> harvesting on the<br />
size structure <strong>of</strong> a Daphnia population,<br />
where the size-classes are: Y, young; SA,<br />
small adolescent, LA, large adolescent; <strong>and</strong><br />
A, adult. The shaded halves <strong>of</strong> the<br />
colu~mns represent those removed <strong>and</strong> the<br />
open halves those left after harvesting.<br />
(b) The effect <strong>of</strong> harvesting on mean<br />
population size before harvest (- - -),<br />
mecm population size after harvest (-),<br />
total yield (- - . . -) <strong>and</strong> yield per individual<br />
(- . --). (c) The effect <strong>of</strong> harvesting on the<br />
proportion <strong>of</strong> the youngest class in the<br />
total population (all Slobodkin & Richman,<br />
1956). For further discussion, see text.<br />
(After Usher, 1974.)<br />
0 25 50 75 90100<br />
Exploitation rate <strong>of</strong> young (%)<br />
20 40 60 80 100<br />
Exploitation rate (%)<br />
tion increased. For the exploitation-rates examined<br />
here, these effects apparently more than compensated<br />
for the losses due to harvesting, in that there was a<br />
consistent increase in yield. Beyond some higher<br />
point, however, increases in productivity would be<br />
unable to compensate for reductions in numbers, <strong>and</strong><br />
the population would decline to extinction. In the<br />
present case, this point is apparently between 90 <strong>and</strong><br />
100% exploitation.<br />
Parenthetically, we should note that once we have<br />
accepted that populations are structured, it is impor-<br />
tant to determine whether 'yield' should be measured<br />
in terms <strong>of</strong> number or biomass, since the two are not<br />
necessarily equivalent. Figure 5.5 5 (Usher et al., 1971)<br />
illustrates this problem in populations <strong>of</strong> an invertebrate<br />
herbivore, the collembolan Folsomia c<strong>and</strong>ida. The<br />
populations were subjected to regular harvesting over<br />
all size-classes at rates <strong>of</strong> 0, 30 <strong>and</strong> 60% <strong>of</strong> the total<br />
population every 14 days, <strong>and</strong> the animals were<br />
always given excess food. Harvesting reduced the<br />
numerical size <strong>of</strong> the Folsomia populations far less<br />
than it reduced their biomass. Moreover, the crop
172 PART 2: INTERSPECIFIC INTERACTIONS<br />
Fig. 5.55 The effects <strong>of</strong> exploitation<br />
on a population <strong>of</strong> the collembolan<br />
Folsomia c<strong>and</strong>ida; control, 0%<br />
exploitation (-1; 30% exploitation<br />
(- --); 60% exploitation (. . a).<br />
(After Usher et al., 1971.)<br />
taken with 30% exploitation yielded a higher biomass<br />
than with 60% exploitation, while the actual numbers<br />
<strong>of</strong> arthropods taken were approximately equal in the<br />
two regimes.<br />
It is legitimate at this point to ask whether field<br />
populations <strong>of</strong> vertebrates behave in a similar way to<br />
these laboratory populations, <strong>and</strong>, regrettably, studying<br />
fish populations in the same detail presents almost<br />
intractable experimental problems. Silliman <strong>and</strong> Gutsell<br />
(1958), however, have succeeded in modelling the<br />
process <strong>of</strong> commercial fishing practices, with densityregulated<br />
populations <strong>of</strong> guppies (Lebistes reticulatus).<br />
Selective fishing, permitting small fish to escape, was<br />
applied every 3 weeks (corresponding to the reproductive<br />
periodicity <strong>of</strong> the fish), <strong>and</strong> the catch size was<br />
carefully controlled but changed after 40-week periods,<br />
so that the effects <strong>of</strong> a range <strong>of</strong> exploitation from<br />
10 to 75% could assessed. Although the results are by<br />
no means as clear as those we have examined so far,<br />
two points <strong>of</strong> interest are reinforced (Fig. 5.56). First,<br />
as we might expect, the size <strong>of</strong> the catch, measured as<br />
numbers or total biomass, was related to the level <strong>of</strong><br />
exploitation; it was higher (though decreasing slightly)<br />
at 25% than it was at 10010, but at 50% it decreased<br />
sharply, <strong>and</strong> at 75% it led to the extinction <strong>of</strong> the<br />
population. Thus, we have confirmation that the<br />
maximum sustainable biomass yield must be attained<br />
at some intermediate level <strong>of</strong> exploitation-probably<br />
close to or just below 25%. The second feature is that<br />
harvesting had a discernible effect on both the sizestructure<br />
<strong>of</strong> the guppy population (since the mean<br />
length <strong>of</strong> the harvested fish declined noticeably with<br />
increasing exploitation), <strong>and</strong> the age-structure<br />
(Fig. 5.57). This, like the data on Daphnia, illustrates<br />
the general conclusion that the structure <strong>of</strong>populations<br />
changes when specific classes are exploited.<br />
The guppy data also illustrate the process <strong>of</strong> overexploitation,<br />
i.e. <strong>of</strong> harvesting at a level in excess <strong>of</strong> the<br />
maximum which is sustainable. In contrast to the<br />
Daphnia data (see Fig. 5.54c), there appears to be a<br />
consistent decline in the proportion <strong>of</strong> the exploited,<br />
adult class between 25 <strong>and</strong> 75% exploitation (see<br />
Fig. 5.57). These higher exploitation-rates apparently<br />
result in a lowering <strong>of</strong> the adult proportion to a level<br />
that is unable to replenish the fish removed by<br />
harvesting. Increases in the fitness <strong>of</strong> survivors are<br />
insufficient to compensate for the decreases in numbers,<br />
<strong>and</strong> extinction would inevitably follow if harvest-
CHAPTER 5: PREDATION 173<br />
Fig. 5.56 Exploitation <strong>of</strong> guppy<br />
populations: biomass <strong>of</strong> the catch<br />
(-)I number <strong>of</strong> fish caught (- . - . ),<br />
average length <strong>of</strong> harvested fish<br />
(. ... a). (After Silliman & Gutsell,<br />
1958.)<br />
juveniles are being exploited, because some <strong>of</strong> these<br />
juveniles would fail to reach maturity anyway. To<br />
generalize, we might suggest that maximal yields can<br />
be obtained from structured populations by removing<br />
those individuals that are likely to contribute least to<br />
the production <strong>of</strong> progeny in the future.<br />
5.13.3 Incorporating population structure:<br />
matrix models <strong>of</strong> harvesting<br />
Fig. 5.57 Adult proportions in Silliman <strong>and</strong> Gutsell's (1958)<br />
guppy populations at different rates <strong>of</strong> exploitation, with<br />
the oresumed relations hi^ interoolated between the ~oints.<br />
ing at these levels (i.e. overexploitation) were to<br />
continue.<br />
Comparisons between animals as different as Daphnia<br />
<strong>and</strong> guppies must obviously be carried out with<br />
caution. Nevertheless, it is interesting to note that<br />
when a very juvenile portion <strong>of</strong> the Daphnia populations<br />
is exploited, the maximum sustainable yield is<br />
obtained at a very high rate <strong>of</strong> exploitation (greater<br />
than 90010); but when adult guppies are exploited, the<br />
peak in sustainable yield occurs at a much lower<br />
exploitation-rate. It appears that in a structured population,<br />
higher exploitation-rates can be sustained if<br />
In the logistic model <strong>of</strong> harvesting, we did not distinguish<br />
between age-classes <strong>of</strong> individuals; <strong>and</strong> this may<br />
justifiably be seen as a neglect <strong>of</strong> the significance <strong>of</strong><br />
population structure <strong>and</strong> <strong>of</strong> age-specific fecundity <strong>and</strong><br />
survival. Age-determined parameters can be incorporated<br />
into a model <strong>of</strong> a harvested population, however,<br />
by use <strong>of</strong> the matrix model from Chapter 3, <strong>and</strong> Usher<br />
(1972) has illustrated the practical application <strong>of</strong> this<br />
approach in an examination <strong>of</strong> the potential <strong>of</strong> the<br />
blue whale (Balaenoptera musculus) for harvesting. He<br />
collated data into a transition matrix describing the<br />
fecundity <strong>and</strong> survival <strong>of</strong> female blue whales, but as<br />
Table 5.10 shows, the paucity <strong>of</strong> these data necessitated<br />
the structuring <strong>of</strong> the population into only six<br />
2-year age-classes up to the age <strong>of</strong> 12 <strong>and</strong> a single<br />
age-class thereafter (12 + ).<br />
As explained in section 3.5, the subdiagonal elements<br />
<strong>of</strong> the matrix are measures <strong>of</strong> the probability <strong>of</strong>
174 PART 2: INTERSPECIFIC INTERACTIONS<br />
Table 5.10 Transition matrix for a population <strong>of</strong> female<br />
blue whales (After Usher, 1972.)<br />
survival from one class to the next (0.77 for each <strong>of</strong> the<br />
first six 2-year periods). Similarly, the lower righth<strong>and</strong><br />
corner element <strong>of</strong> the matrix is the 2-yearly<br />
survival-rate for females over 12. Its value <strong>of</strong> 0.78<br />
gives individuals entering the 12 + class a mean life<br />
expectancy <strong>of</strong> 7.9 years; female blue whales can live to<br />
ages <strong>of</strong> between 30 <strong>and</strong> 40 years. The top row <strong>of</strong><br />
values in the matrix give the fecundity terms for<br />
females: they reflect the fact that breeding does not<br />
start until the fifth year, <strong>and</strong> that full sexual maturity<br />
does not arrive until females are 7 years old. The<br />
fecundity terms <strong>of</strong> the 8-9 <strong>and</strong> 10-11 year classes are<br />
equal to 0.5, because females produce only one calf<br />
every 2 years <strong>and</strong> the sex ratio <strong>of</strong> the population is<br />
1 : 1. The value for the 12 + class has ben reduced to<br />
0.45 to take account <strong>of</strong> irregular breeding in older<br />
whales.<br />
Using the iterative procedure outlined previously<br />
(section 3.5), we can calculate the net reproductive<br />
rate <strong>of</strong> the population (R) when it has achieved a stable<br />
age structure. This equals 1.0072, which, being very<br />
close to 1, indicates that the whale population can<br />
grow at only a very slow rate. We can now calculate<br />
the level <strong>of</strong> exploitation that the population can<br />
withst<strong>and</strong>, without entering a decline. In percentage<br />
terms this is {(R - 1)lR) X 100, or 0.71°/o. In other<br />
words, the sustainable yield <strong>of</strong> the population every<br />
year is approximately 0.3 5 O/o <strong>of</strong> every age-class .<br />
Harvesting-rates in excess <strong>of</strong> this would lead to losses<br />
that the species could not counteract unless homeostatic<br />
mechanisms acted to alter the fecundity <strong>and</strong><br />
survival values in the matrix. In view <strong>of</strong> this, <strong>and</strong> the<br />
intensity with which whaling has been carried out, it<br />
is not surprising that blue whale numbers declined<br />
significantly in the early 1930s; <strong>and</strong> the species has<br />
been threatened ever since.<br />
Further models, taking into account the effects <strong>of</strong><br />
differentially exploiting different classes <strong>of</strong> a structured<br />
population, are beyond the scope <strong>of</strong> this book.<br />
The interested reader can consult Law (1979) <strong>and</strong><br />
Beddington (1979).
Part 3
This page intentionally left blank
Chapter 6<br />
6.1 Introduction 6.2 Nicholson's view<br />
There have, in the past, been contrasting theories to<br />
explain the abundance <strong>of</strong> animal <strong>and</strong> plant population~.<br />
Indeed, the interest has been so great, <strong>and</strong> the<br />
disagreement <strong>of</strong>ten so marked, that the subject has<br />
been a dominant focus <strong>of</strong> attention in population<br />
ecology throughout much <strong>of</strong> this century. The present<br />
view, however, is that the controversy has not so<br />
much been resolved, as recognized for what it really is<br />
(like so many other controversies): a product <strong>of</strong> the<br />
protagonists taking up extreme positions <strong>and</strong> arguing<br />
at cross purposes. In this chapter we shall confine<br />
ourselves to a brief summary <strong>of</strong> the main arguments in<br />
the controversy (sections 6.2-6.5). This should provide<br />
the necessary background, but will avoid our<br />
making too much use <strong>of</strong> historical hindsight. It would<br />
be unwise (<strong>and</strong> unfair) to analyse the arguments in too<br />
great a detail, since most were propounded between<br />
1933 <strong>and</strong> 1958 when underst<strong>and</strong>ing <strong>of</strong> population<br />
ecology was even less sophisticated than it is now.<br />
More inclusive reviews may be found in Bakker<br />
(1964), Clark et al. (1967), Klomp (1964) <strong>and</strong> Solomon<br />
(19164). In section 6.6 we shall illustrate how the<br />
problem seemed to have been resolved by the extensive<br />
life table analysis <strong>of</strong> a Colorado beetle population.<br />
In section 6.7 we shall look at the resurrection <strong>of</strong> the<br />
problem in the 1980s, by exposing just what life table<br />
analyses do not tell us, particularly with respect to<br />
spatial density-dependence. We shall end this section<br />
by suggesting how life-table data will have to be<br />
collected in the future, <strong>and</strong> report some encouraging<br />
results from the most extensive set <strong>of</strong> census data yet<br />
published, which reaffirms the importance <strong>of</strong> densitydependent<br />
population regulation. Then, in sections<br />
6.8-6.11, we shall deal with a heterogeneous sequence<br />
<strong>of</strong> topics, all <strong>of</strong> which have a bearing on the<br />
general question <strong>of</strong> how population sizes are regulated<br />
<strong>and</strong> determined.<br />
A.J. Nicholson, an Australian ecologist, is usually<br />
credited as the major proponent <strong>of</strong> the view that<br />
density-dependent, biotic interactions (which Nicholson<br />
called 'density-governing reactions') play the main<br />
role in determining population size (Nicholson, 193 3,<br />
1954a, b, 1957, 1958). In his own words: 'Governing<br />
reaction induced by density change holds populations<br />
in a state <strong>of</strong> balance in their environments', <strong>and</strong><br />
'. . . the mechanism <strong>of</strong> density governance is almost<br />
always intraspecific competition, either amongst the<br />
animals for a critically important requisite, or amongst<br />
natural enemies for which the animals concerned are<br />
requisites'. Moreover, although he recognized that<br />
'. . . factors which are uninfluenced by density may<br />
produce pr<strong>of</strong>ound effects upon density', he considered<br />
that they only did so by '. . . modifying the properties <strong>of</strong><br />
the animals, or those <strong>of</strong> their environments, so influencing<br />
the level at which governing reaction adjusts<br />
population densities'. Even under the extreme influence<br />
<strong>of</strong> density-independent factors '. . . density governance<br />
is merely relaxed from time to time <strong>and</strong><br />
subsequently resumed, <strong>and</strong> it remains the influence<br />
which adjusts population densities in relation to environmental<br />
favourability' (all Nicholson, 1954b). In<br />
other words, Nicholson may be taken to represent the<br />
view that density-dependent processes '. . . play a key<br />
role in the determination <strong>of</strong> population numbers by<br />
operating as stabilizing (regulating) mechanisms'<br />
(Clark et al., 1967).<br />
6.3 Andrewartha <strong>and</strong> Birch's view<br />
By contrast, the view that density-dependent processes<br />
are '. . . in general, <strong>of</strong> minor or secondary importance,<br />
<strong>and</strong> . . . play no part in determining the abundance<br />
<strong>of</strong> some species' (Clark et al., 1967) is most commonly<br />
attributed to two other Australian ecologists,
178 PART 3: SYNTHESIS<br />
Andrewartha <strong>and</strong> Birch. Their view is as follows<br />
(Andrewartha & Birch, 1954):<br />
The numbers <strong>of</strong> animals in a natural population<br />
may be limited in three ways: (a) by shortage <strong>of</strong><br />
material resources, such as food, places in which<br />
to make nests, etc.; (b) by inaccessibility <strong>of</strong> these<br />
material resources relative to the animals'<br />
capacities for dispersal <strong>and</strong> searching; <strong>and</strong> (c) by<br />
shortage <strong>of</strong> time when the rate <strong>of</strong> increase r is<br />
positive. Of these three ways, the first is<br />
probably the least, <strong>and</strong> the last is probably the<br />
most important in nature. Concerning (c), the<br />
fluctuations in the value <strong>of</strong> r may be caused by<br />
weather, predators, or any other component <strong>of</strong><br />
environment which influences the rate <strong>of</strong><br />
increase.<br />
Andrewartha <strong>and</strong> Birch, therefore '. . . rejected the<br />
traditional subdivision <strong>of</strong> environment into physical<br />
<strong>and</strong> biotic factors <strong>and</strong> 'density-dependent' <strong>and</strong><br />
'density-independent' factors on the grounds that<br />
these were neither a precise nor a useful framework<br />
within which to discuss problems <strong>of</strong> population ecology'<br />
(Andrewartha & Birch, 1960). The views <strong>of</strong><br />
Andrewartha <strong>and</strong> Birch are probably made more<br />
explicit, however, by considering one <strong>of</strong> their examples;<br />
subsequent discussion <strong>of</strong> this example will then<br />
lead on to a crystallization <strong>of</strong> the current status <strong>of</strong> the<br />
controversy.<br />
6.4 An example: Thrips imaginis<br />
Davidson <strong>and</strong> Andrewartha (1948a, b) studied pcrpulation<br />
changes in a phytophagous insect, the appleblossom<br />
thrips Thrips imaginis which lives on roses<br />
throughout southern Australia. They obtained estimates<br />
<strong>of</strong> abundance for 81 consecutive months by<br />
counting the number <strong>of</strong> thrips on a sample <strong>of</strong> 20 roses<br />
on each <strong>of</strong> approximately 20 days each month<br />
(Fig. 6.1); <strong>and</strong> then, for a further 7 years, they<br />
obtained similar estimates for spring <strong>and</strong> early summer<br />
only. In addition, they monitored local temperature<br />
<strong>and</strong> rainfall throughout the same period. By the<br />
use <strong>of</strong> a 'multiple regression' analysis (see for instance<br />
Poole, 1978), they were able to 'account for' 78% <strong>of</strong><br />
the variance in the yearly peak <strong>of</strong> thrip numbers by<br />
reference to four climatic factors: (i) the suitability <strong>of</strong><br />
temperature for development up to 31 August; (ii) the<br />
suitability <strong>of</strong> temperature for development in September<br />
<strong>and</strong> October; (iii) the suitability <strong>of</strong> temperature for<br />
development in August <strong>of</strong> the previous season; <strong>and</strong><br />
(iv) the rainfall in September <strong>and</strong> October. In other<br />
words, knowledge <strong>of</strong> these four factors in any one<br />
year would allow the size <strong>of</strong> the peak in thrips<br />
numbers to be estimated with a good degree <strong>of</strong><br />
statistical accuracy.<br />
Clearly, the weather (as represented by these four<br />
factors) plays a central <strong>and</strong> crucial role in the determi-<br />
Fig. 6.1 Mean monthly population<br />
counts <strong>of</strong> adult Thrips imaginis in<br />
roses at Adelaide, Australia<br />
(Davidson & Andrewartha, 1948a).<br />
(After Varley et al., 1975.)
CHAPTER 6: <strong>POPULATION</strong> REGULATION 179<br />
Fig. 6.2 The mean monthly logarithm <strong>of</strong> population size for<br />
Thrips imaginis <strong>and</strong> its variance. (After Smith 1961.)<br />
nation <strong>of</strong> T. imaginis numbers at their peak. Yet<br />
Andrewartha <strong>and</strong> Birch (1954) used this, <strong>and</strong> the fact<br />
that no 'density-dependent factor' had been found, to<br />
conclude that there was 'no room' for a densitydependent<br />
factor as a determinant <strong>of</strong> peak thrip<br />
numbers. The only 'balance' that Davidson <strong>and</strong> Andrelwartha<br />
(1948b) recognized was 'a race against time<br />
with the increase in density being carried further in<br />
those years when the favourable period lasts longer,<br />
but never reaching the point where competition<br />
begins to be important'.<br />
As Varley et al. (1975) point out, however, the<br />
multiple regression model is not designed to reveal<br />
directly the presence <strong>of</strong> a density-dependent factor.<br />
And when Smith (1961) applied methods that were so<br />
designed, he obtained excellent evidence <strong>of</strong> densitydependent<br />
population growth prior to the peak. He<br />
found that:<br />
1 there were significant negative correlations between<br />
population change <strong>and</strong> the population size immediately<br />
preceding the spring peak; <strong>and</strong><br />
2 there was, at the same time, a rapidly decreasing<br />
variance in population size (Fig. 6.2).<br />
Moreover, Varley et al. (1975) were able to suggest<br />
the existence <strong>of</strong> a strongly density-dependent mortality<br />
factor, following the peak density. They did this by the<br />
use <strong>of</strong> two hypothetical examples (Fig. 6.3). In both<br />
cases, the adult population (N,) is given a reproductive<br />
rate <strong>of</strong> 10, but is then subjected to a r<strong>and</strong>om (i.e.<br />
density-independent, perhaps climatic) factor determining<br />
the (peak) number <strong>of</strong> larvae (N,). (Note that<br />
this r<strong>and</strong>om element, plotted as a k-factor, is the same<br />
in Fig. 6.3a <strong>and</strong> 6.3b.) In addition, however, Fig. 6.3a<br />
shows a weakly density-dependent mortality factor<br />
acting on the larvae to determine the next generation's<br />
adult population size, while Fig. 6.3b has a<br />
strongly density-dependent factor. As a consequence <strong>of</strong><br />
this, the climatic factor accounts for 91010 <strong>of</strong> the<br />
variation in NL in Fig. 6.3b, but only 32% in Fig. 6.3a.<br />
It appears, in short, as if a fairly strong densitydependent<br />
factor must also have been acting on the<br />
thrip population between the summer peak <strong>and</strong> the<br />
winter trough; <strong>and</strong>, indeed, its presence can be<br />
Q)<br />
-<br />
3<br />
(D<br />
1 2<br />
Fig. 6.3 In both (a) <strong>and</strong> (b) an adult 2<br />
population. NA, is given a ten-fold<br />
reproductive rate. A r<strong>and</strong>om factor<br />
(represented by k,) then acts to leave 2<br />
a larval density. NL, which is plotted g '<br />
Q<br />
on the top line; (a) has a weakly<br />
m<br />
density-dependent factor (k2);(b) has 3<br />
a strongly density-dependent factor.<br />
For further explanation, see text. 0<br />
(After Varley et al., 1975.)<br />
Generations +<br />
Range<br />
<strong>of</strong> NL<br />
Range<br />
<strong>of</strong> NA<br />
Generations ---+<br />
Range<br />
<strong>of</strong> NL<br />
Range<br />
<strong>of</strong> NA
180 PART 3: SYNTHESIS<br />
inferred from Fig. 6.1 itself, where the maxima are<br />
spread over an eight-fold range, with the minima<br />
covering only a four-fold range. In fact, Davidson <strong>and</strong><br />
Andrewartha themselves (1948b) felt that weather<br />
acted as a density-dependent component <strong>of</strong> the environment<br />
during the winter, by killing the proportion<br />
<strong>of</strong> the population inhabiting less favourable 'situations'.<br />
(If the number <strong>of</strong> safe sites is limited <strong>and</strong><br />
remains roughly constant from year to year, then the<br />
number <strong>of</strong> individuals outside these sites killed by the<br />
weather will increase with density.) They also felt,<br />
however, that this did not fit the general, densitydependent<br />
theory '. . . since Nicholson (1 933, pp. 13 5-<br />
6) clearly excludes climate from the list <strong>of</strong> possible<br />
"density-dependent factors". '<br />
6.5 Some general conclusions<br />
There are several conclusions <strong>of</strong> general importance<br />
that we can draw from this single example:<br />
1 We must begin by distinguishing clearly between<br />
the determination <strong>of</strong> abundance <strong>and</strong> its regulation.<br />
Regulation has a well-defined meaning (section 2.3),<br />
<strong>and</strong> by definition can only occur as a result <strong>of</strong> a<br />
density-dependent process. Conversely, abundance<br />
will be determined by the combined effects <strong>of</strong> all the<br />
factors <strong>and</strong> all the processes that impinge on a<br />
population. Certain other terms, particularly the control<br />
<strong>of</strong> abundance, do not have a single, well-defined<br />
meaning. As Varley et al. (1975) stress, a reader should<br />
pause <strong>and</strong> consider carefully what kind <strong>of</strong> meaning is<br />
being attached to such terms.<br />
2 We must also recognize that any dispute as to<br />
whether climate (or anything else) can be a densitydependent<br />
factor is essentially beside the point. In<br />
Davidson <strong>and</strong> Andrewartha's thrips, at the appropriate<br />
time <strong>of</strong> the year, weather confined the insects to a<br />
limited amount <strong>of</strong> favourable 'space'. It is irrelevant<br />
whether or not we consider weather or space to be the<br />
density-dependent factor. What is important is that<br />
the two, together, drove a density-dependent process,<br />
<strong>and</strong> that the effects <strong>of</strong> weather on the thrips were, in<br />
consequence, density-dependent. Weather, like other<br />
abiotic factors, can interact with biotic components <strong>of</strong><br />
the environment so that no single, simple 'density-<br />
dependent factor' can be isolated (cf. section 2.3). We<br />
must concentrate on the nature <strong>of</strong> the processes <strong>and</strong><br />
effects which emanate from such interactions.<br />
3 Andrewartha <strong>and</strong> Birch's view that densitydependent<br />
processes play no part in determining the<br />
abundance <strong>of</strong> some species clearly implies that the<br />
populations <strong>of</strong> such species are not regulated. Yet, as<br />
we have seen, even the data they themselves brought<br />
forward contradicts this view. Indeed it is logically<br />
unreasonable to suppose that any population is absolutely<br />
free from regulation. Unrestrained population<br />
growth is unknown, <strong>and</strong> unrestrained decline leading<br />
to extinction is extremely rare. Moreover, the fluctuations<br />
in almost all populations are at least limited<br />
enough for us to be able to describe them as 'common',<br />
'rare', <strong>and</strong> so on. Thus, we can take it that all<br />
natural populations are regulated to some extent, <strong>and</strong><br />
are therefore, to some extent, influenced by densitydependent<br />
processes.<br />
4 Furthermore, Andrewartha <strong>and</strong> Birch's view that<br />
density-dependent processes are generally <strong>of</strong> minoir or<br />
secondary importance, if it is taken to imply that such<br />
processes are unimportant, is not justified either. Even<br />
in their own example <strong>of</strong> thrips, density-dependent<br />
processes, apart from regulating the population, were<br />
also crucially important in determining abundance.<br />
5 Conversely, we must remember that the weather<br />
accounted for 78% <strong>of</strong> the variation in peak thrip<br />
numbers. Thus, if we wished to predict abundance or<br />
decide why, in a particular year, one level <strong>of</strong> abundance<br />
was attained rather than another, then weather<br />
would undoubtedly be <strong>of</strong> major importance. By implication,<br />
therefore, the density-dependent processes<br />
would be <strong>of</strong> only secondary importance in this respect<br />
(see also section 6.6).<br />
6 Thus, it would be unwise to go along with Nicholson<br />
wholeheartedly. Although density-dependent processes<br />
are an absolute necessity as a means <strong>of</strong><br />
regulating populations <strong>and</strong> are generally by no means<br />
unimportant in determining abundance, they may<br />
well be <strong>of</strong> only minor importance when it comes to<br />
explaining particular observed population sizes. Moreover,<br />
because a11 environments are variable, the position<br />
<strong>of</strong> any 'balance-point' is continually changing. In<br />
spite <strong>of</strong> the ubiquity <strong>of</strong> density-dependent, regulating
CHAPTER 6: <strong>POPULATION</strong> REGULATION 181<br />
(i.e. balancing) processes, therefore, there seems little<br />
value in a view based on universal balance with rare<br />
non-equilibrium interludes. On the contrary, it is<br />
likely that no natural population is ever truly at<br />
equilibrium. This, remember, was the essential reason<br />
for our pragmatic definition <strong>of</strong> 'regulation' in section<br />
2.3.<br />
6.6 A life-table analysis <strong>of</strong> a<br />
Colorado beetle population<br />
These conclusions can be illustrated most effectively<br />
by analysing some life-table data in a way which has<br />
its roots in the work <strong>of</strong> Morris (1959) <strong>and</strong> Varley <strong>and</strong><br />
Gradwell(1960), <strong>and</strong> is discussed more fully by Varley<br />
et al. (1975). As will become clear, the analysis allows<br />
us to weigh up the role <strong>and</strong> importance <strong>of</strong> each <strong>of</strong> the<br />
various mortality factors, <strong>and</strong> also allows us to distinguish<br />
between factors that are important in determining<br />
the total mortality-rate, factors that are important<br />
in determining juctuations in mortality-rate, <strong>and</strong> factors<br />
that are important in regulating a population. In<br />
the present case, the analysis is applied to a population<br />
<strong>of</strong> the Colorado potato beetle (Leptinotarsa decemlineata)<br />
in eastern Ontario where it has one generation<br />
per year (Harcourt, 1971).<br />
6.6.1 Life-table data<br />
'Spring adults' emerge from hibernation around the<br />
middle <strong>of</strong> June, when the potatoes are first breaking<br />
through the ground. Within 3-4 days oviposition<br />
begins, extending for about 1 month <strong>and</strong> reaching its<br />
peak in early July. The eggs are laid in clusters<br />
(average size 34 eggs) on the lower leaf surface <strong>and</strong> the<br />
larvae crawl to the top <strong>of</strong> the plant where they feed<br />
throughout their development passing through four<br />
instars. Then, when mature, they drop to the ground<br />
<strong>and</strong> form pupal cells in the soil. The 'summer adults'<br />
emerge in early August, feed, <strong>and</strong> then re-enter the<br />
soil at the beginning <strong>of</strong> September to hibernate <strong>and</strong><br />
become the next season's 'spring adults'.<br />
Details <strong>of</strong> the sampling methods can be found in<br />
Harcourt (1964), but it should be stressed that:<br />
1 ,on each occasion, sampling was continued until<br />
population estimates had confidence limits which<br />
were 1O0Io or less <strong>of</strong> the mean; <strong>and</strong><br />
2 the timing <strong>of</strong> samples varied from year to year, to<br />
ensure that the effects <strong>of</strong> variable climate on the<br />
insects' rate <strong>of</strong> development were allowed for.<br />
The sampling programme provided estimates for<br />
seven age-intervals, from which a life table could be<br />
constructed. These were: eggs, early larvae, late<br />
larvae, pupal cells, summer adults, hibernating adults<br />
<strong>and</strong> spring adults. In addition, one further category<br />
was included, 'females X 2', to take account <strong>of</strong> any<br />
unequal sex ratios amongst the summer adults.<br />
Table 6.1 lists these age-intervals <strong>and</strong> the numbers<br />
within them for a single season, <strong>and</strong> also gives the<br />
major 'mortality factors' to which the deaths between<br />
successive intervals can be attributed. Figures obtained<br />
directly from sampling are indicated in bold<br />
type, the rest were obtained by subtraction. Amongst<br />
the eggs, predation <strong>and</strong> cannibalization were monitored<br />
directly, since both processes left behind recognizable<br />
egg remains. Conversely, reductions in<br />
hatchability due either to infertility or rainfall (mud<br />
splash), were assessed by returning samples <strong>of</strong> eggs to<br />
the laboratory <strong>and</strong> observing their progress individually.<br />
Finally, the figure for eggs 'not deposited' was<br />
based on the difference between the actual number <strong>of</strong><br />
eggs <strong>and</strong> those expected on the basis <strong>of</strong> spring-adult<br />
number <strong>and</strong> mean fecundity. These five egg 'mortality<br />
factors' have, for simplicity, been presented as acting<br />
successively in Table 6.1, although, in reality, they<br />
overlap considerably. The loss <strong>of</strong> accuracy resulting<br />
from this is generally slight (Varley et al., 1975).<br />
The principal mortality factor during the first larval<br />
age-interval (from hatching to second instar) was<br />
rainfall, since, during heavy downpours, the small<br />
larvae were frequently washed from the leaves to the<br />
ground where they died in small puddles <strong>of</strong> water.<br />
This mortality was assessed by taking population<br />
counts before <strong>and</strong> after each period <strong>of</strong> rain. Conversely,<br />
amongst older larvae the major mortality<br />
factor was starvation.<br />
Larval mortality due to parasites <strong>and</strong> predators was<br />
insignificant, <strong>and</strong> well within the sampling error. In<br />
the pupal stage, by contrast, parasitization was an<br />
important cause <strong>of</strong> mortality; the numbers <strong>of</strong> sound
182 PART 3: SYNTHESIS<br />
Table 6.1 Typical set <strong>of</strong> life-table data collected by Harcourt (1971) for the Colorado potato beetle (in this case, for Merivale<br />
1961-62). Figures in bold type were obtained directly, the rest by subtraction.<br />
Numb per<br />
96 potato Numbers 'Mortality<br />
Age inteml hllb 'dying' factor' log,, N k-value<br />
- -<br />
he 11799 4.072<br />
2531 Not dcpositcd<br />
0.105 (k~,,)<br />
9268<br />
3.967<br />
445 InfcrtiIc 0.021 (k~h)<br />
882 4<br />
3.946<br />
408 Rain$]! 0.021 (h,.)<br />
8415<br />
3.925<br />
1147 Cannibalism O.W (k~d)<br />
7268<br />
3.8hl<br />
376 Predators<br />
0.024 4klP)<br />
Fatly larvae h892<br />
3.838<br />
0 Rainfall 0 (k2)<br />
Iatc larvac 6892<br />
3.838<br />
3722 Starvation<br />
0.237 (k(1<br />
PUpt-11 cells 3170<br />
3.501<br />
16 IT. doryphor~<br />
0.m2 (k4)<br />
Summer adults 3154<br />
3.499<br />
- 126 Sex (52% fcmalc) 3. -0.017<br />
Fcmalc X L<br />
3280<br />
(k,)<br />
3264 Emigration<br />
1.312 (h)<br />
I Iibcrnating adults I h<br />
1.204<br />
2 Frost<br />
O.05R (ki)<br />
Spring adults 14<br />
1.146<br />
2,916 k ~ a 1 /<br />
pupae <strong>and</strong> those containing puparia <strong>of</strong> the parasitic<br />
tachinid fly, Dorgphorophaga doryphorae were estimated<br />
directly from the sampling data.<br />
Amongst the summer adults, the principal cause <strong>of</strong><br />
'mortality' was emigration provoked by a shortage <strong>of</strong><br />
food. This was assessed from a series <strong>of</strong> direct counts<br />
during the latter half <strong>of</strong> August. Damage by frost, the<br />
major mortality factor acting on hibernating adults,<br />
was assessed by digging up a sample at the end <strong>of</strong><br />
April. The number <strong>of</strong> spring adults was estimated by<br />
direct sampling in early July. There was no evidence <strong>of</strong><br />
spring migration, nor <strong>of</strong> generation-to-generation<br />
changes in fecundity. (Where the data provided more<br />
than one estimate <strong>of</strong> the numbers in a particular stage,<br />
these were integrated into a single figure.)<br />
As Table 6.1 shows, k-values have been computed<br />
for each source <strong>of</strong> mortality, <strong>and</strong> their mean values<br />
over 10 seasons for a single population are presented<br />
in the second column <strong>of</strong> Table 6.2. These indicate the<br />
relative strengths <strong>of</strong> the various mortality factors as<br />
Table 6.2 Summary <strong>of</strong> the life-table analysis for Canadian Colorado beetle populations (data from Harcourt, 1971). b <strong>and</strong> a<br />
are, respectively, the slope <strong>and</strong> intercept <strong>of</strong> the regression <strong>of</strong> each k-factor on the logarithm <strong>of</strong> the numbers preceding its<br />
action; r2 is the coefficient <strong>of</strong> determination. (See text for further explanation.)<br />
- _ZC<br />
wgmxlon on<br />
Mean km1 b B r=<br />
lims not dcposiicd h,, 0.095 0.0241 - 0.05 0.17 0.27<br />
Kggs infrrlilc km 0.026 - 0.W5 - 0.01 11.07 0.86<br />
Rainbll on krr 0.m 0.000 0-00 0.00 0.Orl<br />
1lp.g~ wnnibali~cd h, 0.090 - 0.002 - OS11 9.12 0.02<br />
Egg pdation ~ I P 0.0 36 - 0.01 1 - 0.03 ' 0.1 5 0.41<br />
l,an-c 1 IratnfaIl) kz 0.09 1 0.010 0.03 - 0.02 0.05<br />
Larvac 2 (starvation) k 5 0.185 0.136 0.37 - 1.05 0.66<br />
I'uP.~c (11. ~OV/~~O~XP) k4 0.033 - 0.029 -0.11 0.37 0.8 3<br />
Ibcqual scx ntio kg -0.012 Q.004 0.01 -0.04 0.04<br />
Kmigmtion h 1.543 0.906 2.65 - 6.79 O.H9<br />
Frost k7 0.170 0.010 0.W2 0.1 3 0.02<br />
. - . -. -
CHAPTER 6: <strong>POPULATION</strong> REGULATION 183<br />
contributors to the total rate <strong>of</strong> mortality within a<br />
generation. Thus, the emigration <strong>of</strong> summer adults<br />
has by far the greatest proportional effect, while the<br />
starvation <strong>of</strong> older larvae, the frost-induced mortality<br />
<strong>of</strong> hibernating adults, the 'non-deposition' <strong>of</strong> eggs, the<br />
effects <strong>of</strong> rainfall on young larvae <strong>and</strong> the cannibalization<br />
<strong>of</strong> eggs all play substantial roles.<br />
6.6.2 'Key-factor' analysis<br />
What the second column <strong>of</strong> Table 6.2 does not tell us,<br />
however, is the relative importance <strong>of</strong> these factors as<br />
determinants <strong>of</strong> the year-to-year fluctuations in mortalily<br />
(remember sections 6.4 <strong>and</strong> 6.5). We can easily<br />
imagine, for instance, a factor that repeatedly takes a<br />
significant toll from a population, but which, by<br />
remaining constant in its effects, plays little part in<br />
determining the particular rate <strong>of</strong> mortality (<strong>and</strong> thus<br />
the particular population size) in any one year. In<br />
other words, such a factor may, in a sense, be<br />
important in determining population size, but it is<br />
certainly not important in determining changes in<br />
population size, <strong>and</strong> it cannot help us underst<strong>and</strong> why<br />
the population is <strong>of</strong> a particular size in a particular<br />
year. This can be assessed, however, from the third<br />
column <strong>of</strong> Table 6.2, which gives the regression coef-<br />
ficient <strong>of</strong> each individual k-value on the total generation<br />
value, k,,,,. Podoler <strong>and</strong> Rogers (1975) have<br />
pointed out that a mortality factor that is important in<br />
determining population change will have a regression<br />
coefficient close to unity, because its k-value will tend<br />
to fluctuate in line with k,,,,, in terms <strong>of</strong> both size <strong>and</strong><br />
direction. A mortality factor with a k-value that varies<br />
quite r<strong>and</strong>omly with respect to k,,,,,, however, will<br />
have a regression coefficient close to zero. Moreover,<br />
the sum <strong>of</strong> all the regression coefficients within a<br />
generation will always be unity. Their values will,<br />
therefore, indicate their relative importance as determinants<br />
<strong>of</strong> fluctuations in mortality, <strong>and</strong> the largest<br />
regression coefficient will be associated with the key<br />
factor causing population change (Morris, 1959; Varley &<br />
Gradwell, 1960).<br />
In the present example, it is clear that the emigration<br />
<strong>of</strong> summer adults, with a regression coefficient <strong>of</strong><br />
0.906, is the key factor; <strong>and</strong> other factors (with the<br />
possible exception <strong>of</strong> larval starvation) have a negligible<br />
effect on the changes in generation mortality, even<br />
though some have reasonably high mean k-values. (A<br />
similar conclusion could be drawn, in a more arbitrary<br />
fashion, from a simple examination <strong>of</strong> the fluctuations<br />
in k-values with time (Fig. 6.4). Note, moreover, that<br />
Podoler <strong>and</strong> Roger's method, even though it is less<br />
Fig, 6.4 The changes with time <strong>of</strong><br />
the various k-values <strong>of</strong> Canadian<br />
Colorado beetle populations. Note<br />
that there are two quite separate<br />
scales on the vertical axis <strong>and</strong> that<br />
k, is therefore undoubtedly the 'key<br />
factor'. (Data from Harcourt, 1971 .)<br />
Merivale<br />
66-67<br />
67-68<br />
Ottawa<br />
67-68<br />
68-69<br />
Richmond
184 PART 3: SYNTHESIS<br />
Fig. 6.5 (a) Density-dependent emigration amongst<br />
Canadian Colorado beetle summer adults which is<br />
overcompensating (slope = 2.65). (b) Inverse densitydependence<br />
in the parasitization <strong>of</strong> Colorado beetle pupae<br />
(slope = - 0.1 1). (c) Density-dependence in the starvation <strong>of</strong><br />
Colorado beetle larvae (straight line slope = 0.37; final slope<br />
<strong>of</strong> curve, based on equation 3.4 = 30.95). (Data from<br />
Harcourt, 1971 .)<br />
arbitrary than this graphical alternative, still does not<br />
allow us to assess the statistical significance <strong>of</strong> the<br />
regression coefficients, because the two variables are<br />
not independent <strong>of</strong> one another.)<br />
Thus, while mean k-values indicate the average<br />
strengths <strong>of</strong> various factors as causes <strong>of</strong> mortality in<br />
each generation, key-factor analysis indicates their<br />
relative strengths as causes <strong>of</strong> yearly changes in<br />
generation mortality, <strong>and</strong> thus measures their importance<br />
as determinants <strong>of</strong> population size.<br />
6.6.3 Regulation <strong>of</strong> the population<br />
We must now consider the role <strong>of</strong> these factors in the<br />
regulation <strong>of</strong> the Colorado beetle population. In other<br />
words, we must examine the density-dependence <strong>of</strong><br />
each <strong>of</strong> these factors. This can be achieved most easily<br />
by using the method established in Chapter 2, <strong>of</strong><br />
plotting k-values for each factor against the common<br />
logarithm <strong>of</strong> the numbers present before the factor<br />
acted. Thus, columns 4, 5 <strong>and</strong> 6 in Table 6.2 contain,<br />
respectively, the slopes, intercepts <strong>and</strong> coefficients <strong>of</strong><br />
determination <strong>of</strong> the various regressions <strong>of</strong> k-values on<br />
their appropriate 'log,o initial densities'. Three factors<br />
seem worthy <strong>of</strong> close examination.<br />
The emigration <strong>of</strong> summer adults (the key factor)<br />
appears to act in an overcompensating densitydependent<br />
fashion, since the slope <strong>of</strong> the regression<br />
( = 2.65) is considerably in excess <strong>of</strong> unity (Fig. 6.5a).<br />
(Once again, there are statistical difficulties in assessing<br />
the significance <strong>of</strong> this regression coefficient, but<br />
these can be overcome (Varley & Gradwell, 1963;<br />
Varley et al., 1975; Vickery & Nudds, 1 Wl), <strong>and</strong> in the<br />
present case density-dependence can be established<br />
statistically.) Thus, the key factor though densitydependent<br />
does not so much regulate the population<br />
as lead, because <strong>of</strong> overcompensation, to violent<br />
fluctuations in abundance (actually discernible from<br />
the data: see Fig. 6.7). Indeed, the potatolColorado<br />
beetle system is only maintained in existence by<br />
humans, who prevent the extinction <strong>of</strong> the potato<br />
population by replanting (Harcourt, 1971).<br />
The rate <strong>of</strong> pupal parasitism by D. doryphorae<br />
(Fig. 6.5 b) is apparently inversely density-dependent<br />
(though not significantly so, statistically), but because<br />
the mortality-rates are small, any destabilizing effects<br />
this may have on the population are negligible. Nevertheless,<br />
it is interesting to speculate that at low population<br />
levels presumably prevalent before the creation<br />
<strong>of</strong> potato monocultures by man, this parasitoid
CHAPTER 6: <strong>POPULATION</strong> REGULATION 185<br />
could act as an important source <strong>of</strong> beetle mortality<br />
(Harcourt, 1971).<br />
Finally, the rate <strong>of</strong> larval starvation appears to<br />
exhibit undercompensating density-dependence<br />
(though statistically this is not significant). An examination<br />
<strong>of</strong> Fig. 6Sc, however, indicates that the relationship<br />
would be far better reflected, not by a linear<br />
regression, but by a curve <strong>of</strong> the type discussed <strong>and</strong><br />
examined in seciton 3.2.2. If such a curve is fitted to<br />
the data, then the coefficient <strong>of</strong> determination rises<br />
from 0.66 to 0.97, <strong>and</strong> the slope (b-value) achieved at<br />
high densities is 30.95 (though it is, <strong>of</strong> course, much<br />
less than this in the density range observed). Hence, it<br />
is quite possible that larval starvation plays an important<br />
part in regulating the population, prior to the<br />
destabilizing effects <strong>of</strong> pupal parasitism <strong>and</strong> adult<br />
emigration.<br />
6.6.4 A population model<br />
This type <strong>of</strong> analysis <strong>of</strong> life table data allows us to<br />
examine the role <strong>and</strong> important <strong>of</strong> each <strong>of</strong> the various<br />
mortality factors acting on a population. It also illustrates<br />
the differences between factors that are important<br />
in determining year-to-year changes in mortalityrate,<br />
<strong>and</strong> factors that are important in regulating (or<br />
even destabilizing) a population. The final logical stage<br />
in such an analysis is to construct a synthetic model<br />
that will allow us to predict:<br />
1 the probable future progress <strong>of</strong> a given population;<br />
<strong>and</strong><br />
2 the consequences to the population <strong>of</strong> natural or<br />
enforced changes in any <strong>of</strong> the mortality factors.<br />
Such a model should have as many 'steps' as there<br />
are 'stages' in the original analysis, <strong>and</strong> for each step<br />
there are two forms that the model could take. Ideally,<br />
the mortality-rate at a particular stage should be<br />
estimated directly from data on the mortality factor<br />
itself. Thus, the mortality-rate <strong>of</strong> early larvae, for<br />
instance, should be estimated from rainfall data, <strong>and</strong><br />
that <strong>of</strong> pupae from data on the numbers <strong>of</strong> D.<br />
doryphorae. Yet, the construction <strong>of</strong> these specific<br />
submodels for each <strong>of</strong> the stages requires extensive<br />
collection <strong>of</strong> data. An imperfect but simpler alternative,<br />
<strong>and</strong> the one to which we shall be restricted in the<br />
present case, is to use the observed, empirical relationships<br />
between beetle numbers <strong>and</strong> mortality-rates, as<br />
summarized in the regression equations <strong>of</strong> columns 4<br />
<strong>and</strong> 5 <strong>of</strong> Table 6.2. This approach literally uses what<br />
has happened in the past to predict what is likely to<br />
happen in the future but it neglects any detailed<br />
consideration <strong>of</strong> the interactions occurring at each <strong>of</strong><br />
the stages. (Of course, hybrid models, using different<br />
approaches at different stages, can also be constructed.)<br />
In the present case we can argue from Table 6.2<br />
that since, on average:<br />
k,, = 0.27 - 0.05 log,, (total potential eggs)<br />
or,<br />
log,, (total potential eggs) - log,, (eggs deposited)<br />
= 0.27 - 0.05 log,, (total potential eggs)<br />
then,<br />
log,, (eggs deposited)<br />
= 1.05 log,, (total potential eggs) - 0.27.<br />
Similarly,<br />
log,, (fertile eggs)<br />
= 1 .O1 log,, (eggs deposited) - 0.07,<br />
<strong>and</strong> so,<br />
log,, (fertile eggs)<br />
= 1.01 {l.OS log,, (total potential eggs) - 0.27) - 0.07.<br />
If this is repeated for each stage, it allows us, eventually,<br />
to predict log,, (spring adults) from log,, (total<br />
potential eggs). In other words, we have constructed a<br />
model that will allow us to predict the level <strong>of</strong><br />
infestation in any one year given the number <strong>of</strong> eggs<br />
laid the previous year. Alternatively, since we know<br />
that each female lays, on average, 1700 eggs, we can<br />
use the number <strong>of</strong> spring adults in any one year to<br />
predict the numbers in the various stages during the<br />
following year. In the present case, the model's<br />
predictions are illustrated in Fig. 6.6 (in which 'total<br />
potential eggs' is used to predict 'spring adults' in each<br />
<strong>of</strong> the 10 generations studied) <strong>and</strong> Fig. 6.7 (in which<br />
the number <strong>of</strong> eggs present in 1961 at a single site is<br />
used to generate an adult population curve for the
186 PART 3: SYNTHESIS<br />
Fig. 6.6 The correlation between the observed number <strong>of</strong><br />
Canadian Colorado beetle spring adults <strong>and</strong> the number<br />
estimated on the basis <strong>of</strong> the k-value model. For further<br />
explanation, see text. (Data from Harcourt, 1971.)<br />
following six seasons). In both cases the predictions<br />
are compared with the observed figures, <strong>and</strong>, given<br />
that in Fig. 6.7 any errors are bound to accumulate,<br />
the fit <strong>of</strong> the model is very satisfactory. This is a<br />
pleasing reflection <strong>of</strong> the amount that we can learn<br />
from such analyses <strong>of</strong> life-table data; <strong>and</strong> it serves to<br />
re-emphasize the need to consider carefully the integrated<br />
effects <strong>of</strong> all factors, both biotic <strong>and</strong> abiotic,<br />
when we seek to underst<strong>and</strong> the abundance <strong>of</strong> natural<br />
populations .<br />
6.7 The problem re-emerges<br />
In recent years a density-dependence debate has<br />
resurfaced, but is now focused on the detection <strong>of</strong><br />
density-dependence rather than on the roles <strong>of</strong><br />
density-dependent <strong>and</strong> density-independent factors in<br />
population regulation. As many populations persist for<br />
long periods within some bounds there can be no<br />
doubt that they experience some form <strong>of</strong> densitydependent<br />
limitation. However, the difficulty is in<br />
trying to establish whether the density-dependent<br />
Fig. 6.7 The observed <strong>and</strong> estimated numbers <strong>of</strong> Colorado<br />
beetle spring adults at Merivale, based on the numbers<br />
observed in 1961. For further explanation, see text. (Data<br />
from Harcourt, 1971.)<br />
effects are strong enough to outweigh the stochastic,<br />
density-independent effects (Vickery & Nudds, 1991).<br />
Two main methods have been used for investigating<br />
<strong>and</strong> detecting density-dependence. The first method<br />
has been the detection <strong>of</strong> density-dependence in<br />
particular mechanisms, such as specific parasitoids,<br />
predators or competitors, from life-table data, the<br />
technique described in section 6.6 for the Colorado<br />
potato beetle. The second method has had as its<br />
objective the detection <strong>of</strong> density-dependence <strong>of</strong> population<br />
change from census data, counts made in<br />
successive annual generations at the same stage in the<br />
life cycle. Several statistical techniques have been used<br />
in order to achieve this end (Williamson, 1972;<br />
Bulrner, 1975; Slade, 1977; Vickery & Nudds, 1984,<br />
1991; Pollard, et al., 1987; Turchin, 1990). These<br />
techniques are a substitute for more extensive analyses<br />
such as key-factor analysis. Each <strong>of</strong> these two main<br />
methods are now seen to have problems which are<br />
considered in sections 6.7.1 <strong>and</strong> 6.7.2, respectivelly.<br />
6.7.1 Life-table analyses<br />
Dempster (1983) challenged the view that populations<br />
<strong>of</strong> temperate Lepidoptera were regulated by densitydependent<br />
mortalities from a study <strong>of</strong> 24 sets <strong>of</strong>
CHAPTER 6: <strong>POPULATION</strong> REGULATION 187<br />
life-table data. By plotting k-values against the logarithm<br />
<strong>of</strong> the population density upon which the<br />
mortality operates (see section 6.6), he found no<br />
evidence for density-dependence in eight studies,<br />
density-dependence due to intraspecific competition<br />
in a. further 13 studies, <strong>and</strong> density-dependence due to<br />
natural enemies in just three. Dempster even questioned<br />
whether the density-dependent mortality from<br />
natural enemies was sufficient to regulate the three<br />
populations in question. If Dempster's results were<br />
representative for reasonably well-studied groups like<br />
Lepidoptera, they could also be true for other groups<br />
ancl have wider implications for our views <strong>of</strong> population<br />
regulation in general. The theme introduced by<br />
Dempster was carried further by Stiling (1988), who<br />
found that in 26 <strong>of</strong> the 58 insect species studies he<br />
reviewed, there were no obvious density-dependent<br />
factors operating <strong>and</strong> that natural enemies were<br />
acting in a density-dependent manner in just 13<br />
studies. This led him to conclude, like Dempster, that<br />
population densities <strong>of</strong> insects commonly fluctuate<br />
between some lower floor <strong>and</strong> upper ceiling set by<br />
limiting resources, rather than being maintained<br />
around some more fixed equilibrium. What these<br />
studies illustrate is that either density-dependent factors,<br />
particularly involving natural enemies, are not<br />
operating as frequently as was earlier supposed in<br />
insect populations, or the methods <strong>of</strong> detecting<br />
density-dependence from life-table data are not as<br />
sensitive as could be hoped.<br />
One <strong>of</strong> the principal problems in detecting densitydependence<br />
from life-table data is that the methods<br />
used, <strong>and</strong> described in section 6.6, assume that the<br />
important mortality rates are functions <strong>of</strong> average<br />
population sizes in successive generations. Consequently,<br />
these methods are not designed to test for<br />
density-related processes that act differentially between<br />
different fractions <strong>of</strong> the population within a<br />
generation. This kind <strong>of</strong> heterogeneity within a generation<br />
can occur when there is differential survival<br />
between patches <strong>of</strong> different population density. We<br />
have already seen that such heterogeneity can have<br />
far-reaching consequences for competitive (section<br />
4.16) <strong>and</strong> predator-prey (section 5.13) interactions.<br />
For example, if parasitoids search non-r<strong>and</strong>omly<br />
among patches <strong>of</strong> different host density, <strong>and</strong> concentrate<br />
their efforts in high host density patches, then<br />
individuals within high density patches may be at a<br />
greater risk than those in low density patches. Thus,<br />
in high density patches there could be densitydependent<br />
mortality, <strong>and</strong> in low density patches<br />
inverse density-dependent mortality; patches <strong>of</strong> intermediate<br />
density would show density-independent<br />
mortality. The average mortality over all patch types<br />
might be density-independent, which is what would<br />
be detected by key-factor analysis. The population <strong>of</strong><br />
the host would nevertheless be regulated due to<br />
density-dependent mortality in the high host density<br />
patches. Such a phenomenon has been called spatial<br />
density-dependence.<br />
The problem <strong>of</strong> detecting density-dependence from<br />
life tables when there are spatial effects can be<br />
illustrated by reference to the work <strong>of</strong> Southwood <strong>and</strong><br />
Reader (1976) <strong>and</strong> Hassell et al. (1987) on the population<br />
dynamics <strong>of</strong> the viburnum whitefly (Aleurotracheus<br />
jelinekii). Viburnum tinus, an evergreen shrub, is the<br />
main British host for Aleurotracheus jelinekii. Whiteflies<br />
appear at the end <strong>of</strong> May or early June <strong>and</strong> show little<br />
migratory activity so that the study bush (B in Hassell<br />
et al., 1987) is effectively a closed system. The life cycle<br />
is as follows. Up to 30 eggs are laid per female in<br />
wax-coated clusters on the undersides <strong>of</strong> leaves. The<br />
eggs hatch after about 4 weeks, leaving the egg cases<br />
attached to the leaves. The larvae spend their lives,<br />
after some w<strong>and</strong>erings in the first instar, on the lower<br />
leaf surfaces. By November most individuals have<br />
reached instar four in which they remain until feeding<br />
resumes again the following spring. Over 90% <strong>of</strong><br />
leaves normally-survive into a second season. Two<br />
sampling methods were used. An annual census was<br />
taken prior to adult emergence in spring, from which<br />
the data for key-factor analysis were derived. Further<br />
data were collected from more detailed studies on<br />
labelled leaves <strong>of</strong> 30 cohorts per generation which<br />
were followed from egg to emerging adult. Thus<br />
conventional temporal data is provided from the<br />
annual censuses <strong>and</strong> within-generation mortality data<br />
are provided from the studies on individual leaves.<br />
Key-factor analysis on 16 generations <strong>of</strong> data fails to<br />
detect any evidence <strong>of</strong> density-dependent mortality.
188 PART 3: SYNTHESIS<br />
However, in 8 <strong>of</strong> the 9 years in which within-leaf<br />
studies were made, density-dependent mortality was<br />
detected. The failure to detect density-dependence<br />
from the conventional life-table data is the direct<br />
result <strong>of</strong> the failure to sample on the scale at which<br />
this density-dependence operates, probably in conjunction<br />
with the inevitable stochastic elements<br />
present.<br />
It is important, then, in undertaking life-table studies,<br />
to sample at a range <strong>of</strong> spatial scales. Heads <strong>and</strong><br />
Lawton (1983) have done this in their study <strong>of</strong> the<br />
natural enemies <strong>of</strong> the holly leaf-miner (Phytomyza<br />
ilicis), an agromyzid fly. They measured leaf-miner<br />
densities along a holly hedge, <strong>and</strong> mortalities imposed<br />
by a guild <strong>of</strong> specific parasitoids <strong>and</strong> birds, using<br />
nested quadrats varying in size from 0.03 to 1 m2. The<br />
mortalities imposed by three species <strong>of</strong> pupal parasitoid<br />
were independent <strong>of</strong> density at all four spatial<br />
scales, but the larval parasitoid, Chrysocharis gemma,<br />
revealed a range <strong>of</strong> responses to host density. In areas<br />
<strong>of</strong> high host density it aggregated demonstrably, <strong>and</strong><br />
this effect was most notable at the lowest quadrat size.<br />
As the data were pooled into increasingly large<br />
sampling units the effect became progressively<br />
weaker, <strong>and</strong> was undetectable at the largest quadrat<br />
size. The only real solution to the problem is to look<br />
for more detailed information from each generation,<br />
<strong>and</strong> to design a sampling programme that is stratified<br />
in space (Hassell, 1985).<br />
There are two additional very different <strong>and</strong> very<br />
important reasons why analyses <strong>of</strong> life-table data have<br />
failed to detect density-dependent mortalities. First,<br />
Turchin (1990) point out that conventional life-table<br />
analyses fail to detect delayed density-dependence<br />
because they are simply not designed to detect it. He<br />
evaluated the evidence for density-dependence in the<br />
population dynamics <strong>of</strong> 14 species <strong>of</strong> forest insects,<br />
<strong>and</strong> assessed the effect <strong>of</strong> regulation lags on the<br />
likelihood <strong>of</strong> detecting direct density-dependence. In<br />
five <strong>of</strong> these 14 cases there was clear evidence for<br />
direct density-dependence, but seven <strong>of</strong> the nine<br />
apparently non-regulated populations, were, in fact,<br />
subject to delayed density-dependent regulation. The<br />
implication <strong>of</strong> this work is that populations characterized<br />
by delays in regulation brought about by, for<br />
example, natural enemies, will be indistinguishable<br />
from those apparently displaying no densitydependent<br />
effects. Such populations could have been<br />
prominent in the studies <strong>of</strong> Dempster (1983) <strong>and</strong><br />
Stiling (1 988).<br />
Second, many <strong>of</strong> the data sets analysed by Stiling<br />
were not sufficiently long to make the detection <strong>of</strong><br />
density-dependence very likely. Hassell et al. (1989)<br />
analysed the same life tables as Stiling <strong>and</strong> found that<br />
the proportion <strong>of</strong> studies in which density-dependence<br />
was detected by the original authors increased markedly<br />
with the number <strong>of</strong> generations available for<br />
analysis. The result was particularly clear in 28 life<br />
tables from univoltine insects. This is an encouraging<br />
result when set against the problems <strong>of</strong> spatial<br />
density-dependence described above.<br />
6.7.2 Single-species time series<br />
Several statistical tests have been devised with which<br />
to analyse annual census data. The simplest ones<br />
involve analyses <strong>of</strong> plots <strong>of</strong> X,+ , against X,, where<br />
X, = log, N, <strong>and</strong> X, + , = log, N, + , N, being the population<br />
size at time t <strong>and</strong> N, +, population size at time<br />
t + l (e.g. Slade, 1977). Other tests are a little more<br />
complicated. For example Bulmer's (1975) autoregression<br />
technique specifically contrasts the densityindependent<br />
null hypothesis <strong>of</strong> population change,<br />
X, + , = X, + E,, where E, is a normally distributed error<br />
term, against the density-dependent alternative hypothesis,<br />
X, +, = aX, + r + E,, where a <strong>and</strong> r are constants.<br />
The r<strong>and</strong>omization method <strong>of</strong> Pollard et al. (1987) uses<br />
the correlation coefficient between the change in<br />
population size <strong>and</strong> the population size itself to<br />
compare the observed data with r<strong>and</strong>omized sets <strong>of</strong><br />
annual abundances, which define the null hypothesis<br />
<strong>of</strong> density-independence. None <strong>of</strong> these tests is perfect<br />
<strong>and</strong> there are unresolved problems associated with<br />
them. For example, none <strong>of</strong> the tests takes account <strong>of</strong><br />
measurement errors, which are thought to lead to an<br />
increased likelihood <strong>of</strong> detecting density-dependence<br />
where none exists. Most authors attempting to analyse<br />
census data for density-dependence have used several<br />
methods <strong>and</strong> taken a consensus view <strong>of</strong> the results.<br />
Some analyses <strong>of</strong> annual census data have clearly
CHAPTER 6: <strong>POPULATION</strong> REGULATION 189<br />
Fig. 6.8 Percentage <strong>of</strong> time series with significant (S0)<br />
density-dependence in (a) aphids, <strong>and</strong> (b) moths detected<br />
using three methods: (-) Bulmer; (- - - -) Ricker; (- - - -)<br />
Pollard et al.; (-----) all methods. (After Woiwod & Hanski,<br />
1992.)<br />
been deficient on several grounds, most notably, as<br />
with the life-table data, on sample size. Many <strong>of</strong> the<br />
statistical tests employed to detect density-dependence<br />
have low statistical power with the samples sizes<br />
frequently used. This problem does not affect the most<br />
extensive study <strong>of</strong> density-dependence on insect population~<br />
by Woiwod <strong>and</strong> Hanski (1992) which uses the<br />
large data base collected by the Rothamsted Insect<br />
Survey. This survey includes time-series data for<br />
huindreds <strong>of</strong> species <strong>of</strong> moths <strong>and</strong> aphids collected<br />
simultaneously from light traps (moths) <strong>and</strong> suction<br />
traps (alate aphids) throughout the UK. In 1976 there<br />
were 126 light traps run by 460 volunteers (Taylor,<br />
1986). The data set does not suffer from the same<br />
degree <strong>of</strong> bias as other data in that outbreak species,<br />
typically those <strong>of</strong> greatest interest to applied entomologists,<br />
are not disproportionately represented; the<br />
species chosen select themselves by getting caught in<br />
st<strong>and</strong>ard traps. Woiwod <strong>and</strong> Hanski (1992) analysed<br />
5 71 5 time-series <strong>of</strong> annual abundances <strong>of</strong> 447 species<br />
<strong>of</strong> moths <strong>and</strong> aphids in the UK. This was more than<br />
two orders <strong>of</strong> magnitude greater than the number <strong>of</strong><br />
time-series analysed in comparable studies. They<br />
found that the incidence <strong>of</strong> significant densitydependence<br />
increased with the length <strong>of</strong> the time<br />
series in the range 10-24 years, a similar finding to<br />
analyses based on life-table data (Fig. 6.8). Densitydependence<br />
was detected more frequently in species<br />
which did not show a significant trend in abundance.<br />
This was thought not to be a statistical artefact;<br />
populations showing a systematic change in size<br />
through time may indeed exhibit less densitydependence<br />
than those showing no such change.
190 PART 3: SYNTHESIS<br />
Woiwod <strong>and</strong> Hanski used three different techniques to<br />
detect density-dependence. In what they considered<br />
the most sensitive statistical test, due to Bulmer<br />
(1975), on data sets longer than 20 years, densitydependence<br />
was detected in 79% <strong>of</strong> moth <strong>and</strong> 88% <strong>of</strong><br />
aphid time-series. The analysis also revealed that<br />
noctuid moths <strong>and</strong> aphids showed highly significant<br />
differences between species, indicating that the<br />
density-dependence detected was a repeatedly measurable<br />
characteristic <strong>of</strong> species. In other words,<br />
density-dependence was consistently detected in some<br />
species <strong>and</strong> not others. There was rather less systematic<br />
variation between sites, but not surprisingly<br />
species did vary between sites if environmental conditions,<br />
to which they may be sensitive, differed greatly.<br />
It should be remembered that previous studies had<br />
<strong>of</strong>ten been concerned with unreplicated time-series<br />
from which it was <strong>of</strong>ten difficult to know what value<br />
should be placed on the results. Finally, Hanski <strong>and</strong><br />
Woiwod (1991) looked at evidence for delayed densitydependence.<br />
Their results support Turchin's (1990)<br />
view that delayed density-dependence may be relatively<br />
common in forest moths, which <strong>of</strong>ten have<br />
cyclic or outbreak dynamics (woodl<strong>and</strong> noctuid moths<br />
showed more delayed density-dependence than nonwoodl<strong>and</strong><br />
noctuids), but in the majority <strong>of</strong> insects<br />
Hanski <strong>and</strong> Woiwod (1991) found no more delayed<br />
density-dependence than would be expected by<br />
chance. The good agreement between the methods<br />
used by Woiwod <strong>and</strong> Hanski (those <strong>of</strong> Ricker, 1954;<br />
Bulmer, 1975; Pollard et al., 1987) indicates strongly<br />
that this extensive work should finally lay to rest any<br />
remaining doubts about the extent <strong>of</strong> densitydependence<br />
in natural populations, <strong>of</strong> insects, at least.<br />
6.7.3 Population regulation in vertebrates<br />
The preceding'sections are dominated by insect examples<br />
because there are more data for insect populations<br />
than for any other group <strong>of</strong> animals, <strong>and</strong> because<br />
insect pest problems have driven the need to underst<strong>and</strong><br />
insect population ecology. Table 6.3 gives the<br />
numbers <strong>of</strong> studies reporting different causes <strong>of</strong><br />
density-dependence in vertebrates. The table is derived<br />
from Sinclair (1989) from which the source<br />
references can be obtained.<br />
Some patterns are very clear from this table. Large<br />
terrestrial mammals seem to be regulated through<br />
their food supply, a conclusion based on studies in<br />
which food supply either has been measured directly<br />
or inferred from its effects on fertility. This may appear<br />
a somewhat surprising conclusion given the number<br />
<strong>of</strong> studies that have demonstrated an increase in prey<br />
numbers following predator removal, but as Sinclair<br />
points out, most studies <strong>of</strong> this kind merely demonstrate<br />
that predators limit prey populations, not that<br />
they regulate them. In small mammals the biggest<br />
single cause <strong>of</strong> regulation is density-dependent exclusion<br />
<strong>of</strong> juveniles from breeding colonies, but it is<br />
difficult to know how much credence to give to this<br />
conclusion since predation is so rarely measured in<br />
field studies <strong>of</strong> small mammal populations. In birds<br />
Table 6.3 Number (Olo) <strong>of</strong> reports <strong>of</strong> separate populations recording cause <strong>of</strong> density-dependence. (After Sinclair, 1989.)<br />
F~UI ' ~itors<br />
'<br />
paisites -' - Dks~ire Wai ~odat no.<br />
populaliorts<br />
Large 0 6(hO) 4(40) 0 0 0 10<br />
marine<br />
mammals<br />
tape<br />
tcnmZriaI<br />
1(1) 71 (991 0 0 2 (3) 0 72<br />
mammals<br />
,<br />
SrnaIl mammals 14 (67) 5(24) 4(19) 0 0 14(67) L1<br />
Birds 5 (33) 8153) 0 1 (6) 0 T ($7) 15
CHAPTER 6: <strong>POPULATION</strong> REGULATION 191<br />
Fig. 6.9 Population fluctuations in a s<strong>and</strong> dune annual<br />
Androsace septentrionalis: S, seed population; G, seeding; E,<br />
established plant; V, vegetative mature plants; F, flowering<br />
plants; R, fruiting plants. Breaks in horizontal axis<br />
represent the period from May to March (10 months). (Data<br />
from Symonides, 1979.)<br />
food shortage <strong>and</strong> competition for territorial space<br />
<strong>and</strong>lor nest sites are the main causes when densitydependence<br />
is recorded (see also section 6.10). Marine<br />
mammals were included in the table by Sinclair (1989)<br />
who assumed that food supplies affecting fertility <strong>and</strong><br />
the growth <strong>of</strong> juveniles were the predominant causes<br />
<strong>of</strong> regulation. However, the number <strong>of</strong> studies is so<br />
small that no clear conclusions can be drawn. Even<br />
less data are available for fish.<br />
It is clear that there are no generalizations about the<br />
causes <strong>of</strong> density-dependent mortality in vertebrates.<br />
One <strong>of</strong> the main reasons for uncertainty is that most<br />
studies have not included all the likely contenders. In<br />
particular, predation is not considered in most studies<br />
anld the effects <strong>of</strong> parasites <strong>and</strong> pathogens have hardly<br />
begun to be considered in field studies.<br />
6.8 Population regulation in plants<br />
Generally two approaches have been taken to examining<br />
regulation in natural plant populations. On the<br />
one h<strong>and</strong>, populations fluctuating in size have been<br />
monitored by regular census over long periods <strong>of</strong> time;<br />
<strong>and</strong> on the other h<strong>and</strong>, deliberate alterations in<br />
population size have been made to enable population<br />
response to density to be assessed.<br />
Symonides (1 979) monitored Androsace septentrionalis<br />
in s<strong>and</strong> dunes in Pol<strong>and</strong> over an 8-year period <strong>and</strong><br />
examined the fluctuations in the numbers <strong>of</strong> individuals<br />
throughuot the life cycle (Fig. 6.9). The life cycle<br />
in Androsace is short; seedlings emerge in early March<br />
<strong>and</strong> plants have flowered <strong>and</strong> set seed by late May.<br />
Annually, <strong>and</strong> with considerable consistency during<br />
the period 1968-74, over 100 000 seeds were produced<br />
per m2. Yet at fruit dispersal in May <strong>of</strong> each<br />
year, populations fell in the restricted range <strong>of</strong> 100-<br />
300 flowering plants per m2. Key-factor analysis (see<br />
Silvertown, 1982 for details) revealed that the 'key'<br />
cause <strong>of</strong> mortaIity was seed loss in the 10 months<br />
intervening between seed shed in May <strong>and</strong> germination<br />
in the following March. The magnitude <strong>of</strong> this<br />
loss, however, was independent <strong>of</strong> seed density. On<br />
average only 0.4OIo <strong>of</strong> the seed crop was present as<br />
seedlings in early spring <strong>and</strong> whilst the exact causes <strong>of</strong><br />
mortality are not known, this is a clear reflection <strong>of</strong><br />
the hostility <strong>of</strong> the s<strong>and</strong> dune environment for dormant<br />
Androsace seed. The only other significant period<br />
<strong>of</strong> death during the life cycle was in the establishment<br />
<strong>of</strong> young plants from seedlings. Here densitydependence<br />
regulated the number <strong>of</strong> young plants in<br />
an undercompensatory fashion (Fig. 6.10). Such
192 PART 3: SYNTHESIS<br />
Fig. 6.10 Effect <strong>of</strong> increasing density on seedling mortality.<br />
Slope <strong>of</strong> dashed line = 0.2 (r2 = 0.58). Fitting equation 3.4, b<br />
(final slope) = 18.5 (r = 0.81). (Data from Symonides, 1979.)<br />
undercompensation is important to the persistence <strong>of</strong><br />
Androsace in s<strong>and</strong> dunes. We can see from Fig. 6.9 that<br />
during the latter 5 years <strong>of</strong> Symonides' study, mortality<br />
<strong>of</strong> dormant seeds from primarily abiotic causes<br />
increased (k , , rises), <strong>and</strong> in 1975, 98% <strong>of</strong> seeds<br />
were lost after dispersal <strong>and</strong> the population had<br />
declined to 36 plants per m2. Had density-dependence<br />
at the seedling stage been stronger (e.g. exact compensation)<br />
it is possible that local populations would have<br />
been very close to extinction.<br />
Regulation in this species, then, is substantial in the<br />
juvenile stages (seed <strong>and</strong> seedling), although we might<br />
have expected regulation <strong>of</strong> seed number at the<br />
flowering stage as well. k-Value analysis <strong>of</strong> the data<br />
revealed no evidence <strong>of</strong> this but only because the<br />
densities <strong>of</strong> flowering plants had already been restricted.<br />
This illustrates the inherent limitation <strong>of</strong><br />
simply taking population estimates by census <strong>and</strong>.<br />
seeking (albeit with a powerful tool) the causes <strong>of</strong><br />
population regulation. If, for some reason, the range <strong>of</strong><br />
densities <strong>of</strong> flowering plants had been greater, densitydependent<br />
regulation <strong>of</strong> seed fecundity may well have<br />
been detected.<br />
S<strong>and</strong> dune environments <strong>of</strong>fer a particularly hostile<br />
habitat for plant growth not least with respect to water<br />
as is illustrated particularly clearly by another s<strong>and</strong><br />
dune annual Erophila vema, also studied by Symonides<br />
(1983). Over the period 1968-72, mean spring seedling<br />
abundance varied no more than 8% <strong>of</strong> the mean<br />
over the 5 years (Fig. 6.lla). During this period,<br />
variation in rainfall frequency (as measured by days <strong>of</strong><br />
recorded rainfall) was slight <strong>and</strong>, as Figs 6.1 lb-d<br />
show, population regulation occurred both by increased<br />
mortality <strong>and</strong> reduced fecundity in relation to<br />
density. The pattern <strong>of</strong> adult plant survivorship to<br />
flowering was found to be strongly dependent on<br />
seedling density (the pattern <strong>of</strong> survivorship changing<br />
from Deevey type 1 through to type 3 with increasing<br />
density) <strong>and</strong> the mean fecundity <strong>of</strong> individual plants<br />
was also dependent on the density <strong>of</strong> survivors. The<br />
next 2 years provided very differing habitat conditions<br />
with respect to water, 1973 being wetter <strong>and</strong> 1974<br />
dryer than average. This resource fluctuation was<br />
directly reflected in altered peak seedling populations,<br />
survivorship to flowering <strong>and</strong> mean plant fecundity<br />
but even so the same processes <strong>of</strong> density-dependent<br />
regulation were evident.<br />
Both <strong>of</strong> these examples come from studies <strong>of</strong> natural<br />
populations by continued census over long periods <strong>of</strong><br />
time. An alternative approach to exposing regulatory<br />
processes is to alter experimentally the density <strong>of</strong><br />
natural plant populations. In an endeavour to expose<br />
all possible sources <strong>of</strong> density-dependent regulation in<br />
the grass Vulpia fasiculata in s<strong>and</strong> dunes, Watkinson<br />
<strong>and</strong> Harper (1978) studied natural populations in<br />
which they deliberately established (by addition <strong>of</strong><br />
seeds or removal <strong>of</strong> very young seedlings) a range <strong>of</strong><br />
densities from 100 to 8000 plants per 0.25 m2. This<br />
species contrasts with Androsace in having a shorter<br />
period between seed dissemination <strong>and</strong> germination;<br />
seeds 'over-summer' from July through to October, a<br />
period in which there is usually less than 1% loss <strong>of</strong><br />
the annual seed crop. Mortality between seedling<br />
emergence <strong>and</strong> flowering varied between 7 <strong>and</strong> 41%<br />
but was not density-dependent. A range <strong>of</strong> abiotic <strong>and</strong><br />
biotic factors were the cause <strong>of</strong> these deaths, including<br />
rabbit grazing, drought <strong>and</strong> seedling removal by wind<br />
drag. This mortality was visited on populations up to<br />
<strong>and</strong> including early flowering. Vulpia plants may bear<br />
up to four seeds, but as Fig. 6.12a shows, the actual<br />
numbers <strong>of</strong> seeds borne per plant was dependent on<br />
the density <strong>of</strong> plants at flowering time. (Note, though,<br />
that below 100 plants per 0.25 m2, seed number is<br />
independent <strong>of</strong> density.) To examine the stabilizing<br />
properties <strong>of</strong> this density-dependence, Watkinson <strong>and</strong>
CHAPTER 6: <strong>POPULATION</strong> REGULATION 193<br />
Harper proposed a model in which the density <strong>of</strong><br />
flowering plants, N,, was a function <strong>of</strong> the number <strong>of</strong><br />
seeds per unit area produced in the previous generation,<br />
S, -, <strong>and</strong> the probability, p, <strong>of</strong> an individual<br />
surviving from seed production (at time t - 1) through<br />
to maturity (at time t). Thus,<br />
But, as Fig. 6.12a illustrates, the average number <strong>of</strong><br />
seeds borne per plant, S, was linearly related to<br />
flowering plant density N (above 100 plants per<br />
0.25 m2). Hence,<br />
(K <strong>and</strong> C are the constants describing the straight line<br />
relationship) <strong>and</strong> the seed yield per unit area <strong>of</strong> these<br />
N plants is<br />
Substituting this term with the appropriate subscripts<br />
into equation 6.1 gives<br />
a model describing the changes in the number <strong>of</strong><br />
flowering plants from generation to generation.<br />
If density-independent mortality is constant from<br />
one generation to another we may calculate an<br />
equilibrium population density (N = N, = Nt - ,; N,l<br />
Nt _. , = l) as<br />
when populations exceed 100 flowering plants per<br />
0.25 m2. (Below this density, there is no densitydependent<br />
regulation <strong>and</strong> hence no equilibrium population<br />
size.) Figure 6.12b shows the predicted<br />
equilibrium density for a range <strong>of</strong> p values <strong>and</strong> we can<br />
see that it becomes increasingly sensitive to lowered<br />
chances <strong>of</strong> survival. When p falls below 0.31, the<br />
population will decline; this is because the chance <strong>of</strong><br />
an individual Vulpia plant replacing itself in the next<br />
generation is less than 1. Pleasingly, the values <strong>of</strong> p<br />
measured for Vulpia in the dunes fell in the range<br />
0.34-0.59 supporting the prediction <strong>of</strong> the model that<br />
populations would persist in the dunes, a fact histori-<br />
cally recorded since the beginning <strong>of</strong> the nineteenth<br />
century (Watkinson & Harper, 1978).<br />
The time at which density-independent thinning<br />
takes place in the growth <strong>of</strong> a population <strong>of</strong> plants may<br />
well be important: early thinning may <strong>of</strong>fer a greater<br />
period <strong>of</strong> time than late thinning for the increased<br />
growth <strong>of</strong> survivors compensating for density reductions.<br />
The extent <strong>of</strong> compensation, however, will<br />
depend on the time when the various components <strong>of</strong><br />
yield are formed (section 2.5.2). Watkinson (1983)<br />
assessed the importance <strong>of</strong> this by varying the time<br />
during the life cycle when populations were thinned<br />
by a half (a figure chosen arbitrarily). Figure 6.12~<br />
gives a summary <strong>of</strong> these effects on the calculated<br />
equilibrium population densities. Thinning during the<br />
seed phase <strong>of</strong> the life cycle has no influence on<br />
equilibrium density, since surviving plants compensate<br />
by elevated seed production (Fig. 6.12a). However,<br />
as the time <strong>of</strong> thinning was successively delayed<br />
(dotted line, Fig. 6.12c), equilibrium population densities<br />
fell as the compensatory response became increasingly<br />
muted. The individual yield components in<br />
Vulpia-number <strong>of</strong> fertile tillers, number <strong>of</strong> spikelets<br />
per flower <strong>and</strong> number <strong>of</strong> seeds per spikelet-were<br />
determined in accordance with the density perceived<br />
at their formation, <strong>and</strong> in consequence compensatory<br />
responses to density reductions were limited by the<br />
yield components already formed. However, the extent<br />
to which this occurred was dependent on the<br />
extent to which competition had occurred prior to the<br />
time <strong>of</strong> thinning. <strong>Plants</strong> sown at a later date (November,<br />
Fig. 6.12~) had not achieved a sufficient size to<br />
interfere with each other's growth by January <strong>and</strong><br />
February, <strong>and</strong> thinning <strong>of</strong> populations at this time<br />
depressed population equilibria to a lesser extent than<br />
in populations sown 1 month earlier. We can appreciate,<br />
then, that the model developed earlier has the<br />
generality to encompass all situations where population<br />
regulation is achieved; yet it subsumes within it a<br />
density-dependent term which itself is determined by<br />
the level <strong>of</strong> density-independent regulation.<br />
This approach to assessing possible population equilibria<br />
may be used in exploring the reasons for the<br />
abundance <strong>of</strong> a species along an environmental gradient.<br />
Keddy (1981) sowed seeds <strong>of</strong> the annual sea
194 PART 3: SYNTHESIS<br />
W .-<br />
V1<br />
C<br />
0<br />
.-<br />
W (0<br />
-<br />
3<br />
a<br />
0<br />
a<br />
8<br />
.-<br />
C.' (0<br />
-<br />
Q)<br />
CT<br />
Class <strong>of</strong> density<br />
-----. I<br />
" 81420261 7131922284101622<br />
March I April , May<br />
I<br />
Date<br />
Fig. 6.11 Population responses in Erophila vema over a<br />
7-year period. (a) Peak population sizes given are seedlings<br />
m-2 <strong>and</strong> the number <strong>of</strong> days <strong>of</strong> rainfall in the growing<br />
season are circled; (b) survivorship curves for successive<br />
cohorts in each year.<br />
rocket (Cakile edentula) into a s<strong>and</strong> dune at three sites<br />
(seaward, middle <strong>and</strong> l<strong>and</strong>ward) in Nova Scotia, Canada.<br />
A range <strong>of</strong> densities were sown at each site <strong>and</strong><br />
plant mortality <strong>and</strong> fecundity were determined.<br />
" 8 1420 26 1 713 1922 28 4 10 1622<br />
March I April I May<br />
I<br />
Date<br />
Density-dependence was only noticeable in two sites<br />
<strong>and</strong> in each, at different stages in the life cycle<br />
(Fig. 6.13a). In the l<strong>and</strong>ward site survivorship <strong>of</strong> plants<br />
to fruiting was density-dependent whereas in the<br />
seaward location fecundity decreased with density.<br />
Characteristically, plants were large in the seaward<br />
site where populations were largely monospecific in<br />
contrast to the much smaller plants at the l<strong>and</strong>ward<br />
edge <strong>of</strong> the dune in the presence <strong>of</strong> other vegetation.<br />
Watkinson (1985) used the approach described in<br />
I
CHAPTER 6: <strong>POPULATION</strong> REGULATION 195<br />
Fig. 6.11 (continued) (c) Seed production per plant according<br />
to density class; (d) mean plant fecundity in relation to<br />
density averaged over the 7 years. Density classes (numbers<br />
0.01 m-3: I, 1-2; 11, 5-10; 111, 15-30; IV, 35-50, V, > 55.<br />
(From Syrnonides, 1983 .)<br />
section 3.2.3 to predict equilibrium population sizes<br />
that might be expected if density responses remained<br />
constant over generations. Parameter estimates were<br />
obtained by fitting equation 3.7 to the observed data<br />
(Fig. 6.13 b), assuming that self-thinning in populations<br />
was largely negligible, that plant mortality was<br />
density-independent (the inclusion <strong>of</strong> densitydependence<br />
for the l<strong>and</strong>ward site did not qualitatively<br />
alter the conclusions) <strong>and</strong> that 60% <strong>of</strong> the seed crop in<br />
each site were lost in the period after dispersal <strong>and</strong><br />
before seed germination. By iterating the model for<br />
several generations it was found that populations<br />
would only persist on the seaward end <strong>of</strong> the gradient.<br />
This is in direct contradiction to the observed relative<br />
abundance <strong>of</strong> sea rocket which was most abundant in<br />
the middle <strong>of</strong> the gradient. The suggests that relative<br />
abundance cannot be explained simply in terms <strong>of</strong><br />
survival <strong>and</strong> fecundity, assuming <strong>of</strong> course that the<br />
assumptions <strong>of</strong> the model are correct. Watkinson<br />
therefore investigated the influence <strong>of</strong> migration <strong>of</strong><br />
seed in the l<strong>and</strong>ward direction which is likely as a<br />
result <strong>of</strong> both wind <strong>and</strong> wave action (Keddy, 1981). It<br />
was found that allowing 10% <strong>of</strong> surviving seeds at the<br />
seaward site to migrate inl<strong>and</strong> was sufficient to<br />
maintain populations at all three sites <strong>and</strong> migration<br />
levels <strong>of</strong> 50-80% produced a population distribution<br />
with highest abundance in the middle <strong>of</strong> the dune.<br />
The suggestion is that plants exist at the middle <strong>and</strong><br />
l<strong>and</strong>ward sites only because <strong>of</strong> the high annual<br />
dispersal <strong>of</strong> seeds inl<strong>and</strong>.<br />
In the species just discussed generations do not<br />
overlap, either as living plants or as seeds (there is no<br />
persistent seed bank) <strong>and</strong> individuals in the population<br />
enter each stage <strong>of</strong> growth largely synchronously<br />
owing to birth (germination) at very much the same<br />
time. However, this life history is but one-<strong>and</strong><br />
perhaps the simplest-that plant species display. Many<br />
species possess seed banks from which seedlings may<br />
be recruited over a protracted period <strong>of</strong> time. Episodic<br />
germination from a bank <strong>of</strong> seeds will result in an<br />
age-structured population which, as we have already<br />
seen (Chapter 3), requires a more sophisticated mathematical<br />
description. Yet, despite this complexity we<br />
can still unravel sources <strong>of</strong> population regulation in<br />
some instances by straightforward methods.<br />
Figure 6.14 illustrates the density relationships
196 PART 3: SYNTHESIS<br />
occurring within populations <strong>of</strong> the grass weed Avena<br />
fatua (wild oat) infesting a crop <strong>of</strong> wheat. In the UK,<br />
seed germination in this weed occurs in autumn<br />
during crop sowing as well as in spring when the crop<br />
is growing. Populations then become age-structured<br />
according to the range <strong>of</strong> seed germination times.<br />
Mature plants disseminate seed in mid-summer <strong>and</strong><br />
die before crop harvest. Manlove (1985) sowed A. fatua<br />
over a wide range <strong>of</strong> seed densities on its own or in the<br />
presence <strong>of</strong> a constant density <strong>of</strong> wheat plants. He<br />
then tagged the wild oat plants as they emerged <strong>and</strong><br />
followed their survivorship through to seed production.<br />
By plotting the recorded densities <strong>of</strong> seeds versus<br />
seedlings <strong>and</strong> seedlings versus adults we can look: for<br />
regulation at these two stages in the life cycle<br />
(Fig. 6.14a & 6.14b). Density-dependent regulation is<br />
suggested at the seedheedling stage: the scatter <strong>of</strong><br />
points in Fig. 6.14a is below the line <strong>of</strong> unit slope.<br />
Once seedlings became established mortality during<br />
growth to plant maturity was slight <strong>and</strong> not related to<br />
seedling density either in the presence or absence <strong>of</strong><br />
the crop (Fig. 6.14b). Further experimental evidence<br />
showed that regulation <strong>of</strong> seedling number was primarily<br />
the result <strong>of</strong> seed loss from the soil surface in<br />
late summer <strong>and</strong> early autumn, when seed predators<br />
(birds <strong>and</strong> small mammals) foraged in the plant<br />
stubbles after harvest. The intensity <strong>of</strong> this predation<br />
increased in a density-dependent manner.<br />
A second source <strong>of</strong> density-dependent regulation in<br />
wild oat was in seed production per plant (Fig. 6.14~).<br />
This was inversely related to mature plant density,<br />
<strong>and</strong> it was also depressed eight-fold on average by<br />
wheat, across the entire density range. We can examine<br />
the stabilizing properties <strong>of</strong> these two regulatory<br />
phases by calculating the net reproductive rate, R, <strong>of</strong><br />
populations at different starting seed densities<br />
Fig. 6.13 (Facing page) The influence <strong>of</strong> sowing density on<br />
fitness in Cakile edentula on a sea shore in Nova Scotia,<br />
Canada. (a) Fitness components-the proportion <strong>of</strong> the<br />
Fig. 6.12 Population regulation in Vulpia fasiculata. See text population surviving to reproduce; the n ~an fecundity <strong>of</strong> a<br />
for details. (After Watkinson <strong>and</strong> Harper, 1978; Watkinson, surviving plant; <strong>and</strong> the relative abundance <strong>of</strong> plants as<br />
1983.) observed on the sea shore. (After Keddy, 1981.) (b) The<br />
relationship between mean fecundity <strong>of</strong> a plant <strong>and</strong> the<br />
density <strong>of</strong> reproducing plants. Lines have been fitted using<br />
equation 3.7. (After Watkinson, 1985.)
CHAPTER 6: <strong>POPULATION</strong> REGULATION 197
198 PART 3: SYNTHESIS<br />
Fig. 6 14 Population regulation in Avena fatua in<br />
monoculture <strong>and</strong> in a crop <strong>of</strong> wheat. (a) Density-dependent<br />
regulation <strong>of</strong> seedling emergence. (b) Density-independent<br />
survivorship <strong>of</strong> adult plants. (c) Density-dependent<br />
regulation <strong>of</strong> seed production. Solid lines are <strong>of</strong> unit slope.<br />
(Data from Manlove, 1985.)<br />
(Fig. 6.15). R Declines monotonically with density in<br />
monoculture <strong>and</strong> in wheat (square symbols) down to<br />
densities <strong>of</strong> c. 34600 <strong>and</strong> 7240 seeds per m2 respectively.<br />
These are equilibrium population densities-so<br />
long as all other factors remain constant from one<br />
generation to the next. Figure 6.15 also demonstrates<br />
the effect <strong>of</strong> a density-independent control measure-a<br />
herbicide selective against wild oat which was applied<br />
in early summer before flowering. Its mode <strong>of</strong> action is<br />
to cause flower abortion in the weed (<strong>and</strong> hence seed<br />
loss) rather than plant mortality. In consequence,<br />
reproductive rates are depressed, the line moves<br />
towards the origin, <strong>and</strong> the combination <strong>of</strong> crop<br />
competition <strong>and</strong> herbicide reduced the equilibrium<br />
population density <strong>of</strong> wild oat to 470 seed per m2.<br />
This example, whilst supportive <strong>of</strong> what we already<br />
know regarding population regulation, illustrates particularly<br />
clearly the various roles <strong>of</strong> diierent components<br />
<strong>of</strong> regulation. The underlying cause <strong>of</strong><br />
regulation is intraspecific. This arises in part from<br />
density-dependent seed predation <strong>and</strong> in part from<br />
intraspecific competition determining the seed yield <strong>of</strong><br />
mature plants. Interspecific competition (from wheat)<br />
serves to reduce the net reproductive rate uniformly<br />
across the wild oat density range; <strong>and</strong> a densityindependent<br />
control (herbicide) depresses these rates<br />
even further. We must also remember that the analysis<br />
subsumes the effect <strong>of</strong> age-structure in the wild oat<br />
population. Whilst wild oats that emerge in the<br />
autumn contribute a greater number <strong>of</strong> seeds per<br />
plant to the next generation than late emergers, tlhese<br />
differences are absorbed within the overall density<br />
response. Late emerging plants enter the hierarchy <strong>of</strong><br />
exploitation (section 2.5.2) later in the growing season<br />
<strong>and</strong> are proportionately disadvantaged for doing so.<br />
Nevertheless, even individuals lowest in the size<br />
hierarchy usually contributed one or two seeds to1 the<br />
next generation.<br />
Part <strong>of</strong> this study also involved an examination <strong>of</strong><br />
the dynamics <strong>of</strong> buried seed populations. Loss <strong>of</strong> seeds<br />
in the soil (through seedling germination <strong>and</strong> death)<br />
occurred at a constant rate (a type 2 survivorship<br />
curve) regardless <strong>of</strong> density. Slightly more than half<br />
(0.55) <strong>of</strong> the seed population in the soil survived from<br />
one generation to the next. We can easily appreciate<br />
the role <strong>of</strong> the seed bank in maintenance <strong>of</strong> plant<br />
populations by reconsidering the wild oats growing in<br />
wheat <strong>and</strong> sprayed with herbicide. Populations arising<br />
from seed densities greater than the 470 seeds per. m2<br />
had net reproductive rates less than l-competition<br />
<strong>and</strong> herbicide generally rendering plants at these<br />
densities barren. Yet the persistence <strong>of</strong> dormant seeds
CHAPTER 6: <strong>POPULATION</strong> REGULATION 199<br />
Fig. 6.15 Density-dependent <strong>and</strong> density-independent reproductive-rate is then SJS, -, + 0.55. 0.55 is added as<br />
regulation in Avena fatua. In a generation the number <strong>of</strong> this is the fraction <strong>of</strong> dormant seeds surviving over<br />
seeds produced (S3 is the arithmetic product <strong>of</strong>: the density generations. The dashed line indicates the (constant) rate <strong>of</strong><br />
<strong>of</strong> seeds in the soil in the autumn S, -,; the probability <strong>of</strong> decline <strong>of</strong> the buried seed population; the solid line shows<br />
seeding emergence (see Fig. 6.14a); the probability <strong>of</strong> the rate <strong>of</strong> increase required to keep a population at<br />
seedling survival (Fig. 6.14b); <strong>and</strong> the number <strong>of</strong> seeds equilibrium. The slopes <strong>of</strong> the lines are not significantly<br />
produced per plant (Fig. 6.14~). The rate <strong>of</strong> increase or net different from one another. (Data from Manlove, 1985.)<br />
over generations enables recruitment <strong>of</strong> individuals in<br />
the succeeding generation <strong>and</strong> a rapid return to the<br />
equilibrium density.<br />
Identifying the precise causes <strong>of</strong> population regulatioin<br />
in species with a clonal growth form is complicated<br />
by the necessity <strong>of</strong> taking into account vegetative<br />
propagation by ramet fragmentation (as well as the<br />
practical problem <strong>of</strong> identifying rarnets). Two species<br />
in which vegetative propagation is common are the<br />
creeping buttercup Ranunculus repens <strong>and</strong> the grass<br />
Holcus lanatus, both occurring in grassl<strong>and</strong>s in the UK.<br />
In the buttercup, daughter rosettes are produced on<br />
stolons 10-12 cm apart, <strong>and</strong> in late summer (July-<br />
August) these become detached from the parent as<br />
interconnecting stolons decay. In Holcus, tillers are<br />
borne on shoot complexes (-c 5 cm apart) which continually<br />
become fragmented through natural decay<br />
<strong>and</strong> trampling <strong>of</strong> grazing animals. In grassl<strong>and</strong>, establishment<br />
<strong>of</strong> new plants from seed in both species is<br />
rare. Yet as Fig. 6.16 shows, natural populations <strong>of</strong><br />
both species undergo considerable turnover whilst<br />
maintaining relatively static population sizes. Ramet<br />
populations (tillers or rosettes) experienced a constant<br />
death risk (type 2 survivorship curve), the life expectancies<br />
<strong>of</strong> ramets in both species being 11-18 months<br />
(Sarukhan & Harper, 1973; Weir, 1985). At the same<br />
time there was recruitment <strong>of</strong> new ramets, the process<br />
occurring more or less continuously in Holcus but with<br />
noticeable gain <strong>and</strong> loss dominated periods in Ranunculus.<br />
Sarukhan <strong>and</strong> Harper were able to detect<br />
density-dependent regulation in the buttercups as<br />
populations accommodated to the pulse <strong>of</strong> recruitment<br />
(Fig. 6.17) whilst in Holcus this process was<br />
absent because <strong>of</strong> the fine scale periodicity in ramet
200 PART 3: SYNTHESIS<br />
Fig. 6.16 Population turnover in (a) Ranunculus repens, <strong>and</strong><br />
(b) Holcus lanatus. (After Sarukhan & Harper, 1973; Weir,<br />
1985.)<br />
replacement. This comparison leads us to a final<br />
important conclusion on population regulation in<br />
plants. In species where there are pulses <strong>of</strong> recruitment<br />
(as exemplified by unitary species <strong>and</strong> some<br />
clonal ones) there is the opportunity for densitydependent<br />
regulation to occur. Conversely, where<br />
there is very rapid turnover at the modular level there<br />
may be little opportunity for such regulation because<br />
<strong>of</strong> inherent morphological <strong>and</strong> growth constraints<br />
within the growth form. In this case densitydependent<br />
regulation may be most likely at the genet<br />
level during seedling establishment <strong>and</strong> occupation <strong>of</strong><br />
the regeneration niche (section 4.12). It would be<br />
unwise to assume that fragmentation is a ubiquitous<br />
phenomenon amongst clonal plants. Others may simply<br />
increase in size with age <strong>and</strong> retain structural <strong>and</strong><br />
physiological integrity. Certainly it has been shown<br />
that in some species clones are <strong>of</strong> considerable age <strong>and</strong><br />
that they occupy large areas. For instance, Harberd<br />
(1961) found clones <strong>of</strong> a grass Festuca ovina in Scottish<br />
pastures up to 10 m in diameter <strong>and</strong> Oinonen (1967)<br />
has dated clones <strong>of</strong> bracken, Pteridium aquilinum over<br />
450 years old extending in size over 100 m. 'The<br />
extent to which these clones are intact plants or<br />
populations <strong>of</strong> ramets remains an open question.<br />
6.9 Genetic change<br />
Discussion <strong>of</strong> population regulation is usually framed<br />
in terms <strong>of</strong> ecological time scales; <strong>and</strong> although it is<br />
generally accepted that the individuals concerned<br />
are the products <strong>of</strong> natural selection genetic change
CHAPTER 6: <strong>POPULATION</strong> REGULATION 201<br />
tant, the difference was inherited <strong>and</strong> remained until<br />
the F, <strong>and</strong> F, generations. Clearly, demographic<br />
characters can respond to selection on an 'ecological'<br />
time-scale. In this case they did so in a way that made<br />
reproductive-rate inversely related to population size,<br />
<strong>and</strong> thus tended to regulate the population.<br />
Fig. 6.17 Life expectancy (L) in weeks <strong>of</strong> vegetative<br />
propagules <strong>of</strong> Ranunculus repens as affkcted by its own<br />
species' density. Densities are average values for number <strong>of</strong><br />
plants (m-2) observed at each site in April 1969, 1970 <strong>and</strong><br />
1971. (After Sarukhan & Harper, 1973.)<br />
occurring, by definition, on an evolutionary time<br />
scale, is usually negIected as a reguIatory mechanism.<br />
There are some dissenting ecologists, however-<strong>and</strong><br />
Pimentel(1961) is the most frequently quoted <strong>of</strong> these<br />
who would suggest that such neglect is unwarranted,<br />
<strong>and</strong>l that any discussion <strong>of</strong> population regulation is<br />
incomplete if it fails to take account <strong>of</strong> contemporary<br />
adaptive genetic change. There is, however, rather<br />
little concrete evidence in favour <strong>of</strong> this notion, <strong>and</strong> it<br />
is probable that the ecological <strong>and</strong> evolutionary time<br />
scales are usually dissimilar. Nevertheless, there is<br />
some supporting evidence, <strong>and</strong> a particularly impressive<br />
example is provided by the work <strong>of</strong> Shorrocks<br />
(19'70). Shorrocks maintained populations <strong>of</strong> the fruitfly<br />
Drosophila melanogaster in the laboratory, <strong>and</strong><br />
obtained regular four-generation cycles in abundance,<br />
unrelated to any regular change in an environmental<br />
variable. Pairs <strong>of</strong> flies were removed from the populations<br />
<strong>and</strong> classified as 'peak' or 'non-peak', depending<br />
on the type <strong>of</strong> abundance their parents experienced,<br />
<strong>and</strong>[ the numbers <strong>of</strong> <strong>of</strong>fspring produced by these pairs<br />
when maintained under identical, uncrowded conditions<br />
were noted. The pairs in the 'peak' category<br />
produced significantly fewer <strong>of</strong>fspring than their counterparts<br />
in the 'non-peak' category, <strong>and</strong>, more impor-<br />
6.10 Territoriality<br />
One topic which is intimately tied up with population<br />
regulation is territoriality. But as Davies (1978a) has<br />
pointed out, in a much fuller review <strong>of</strong> the subject<br />
than can be given here, there are a number <strong>of</strong><br />
questions pertinent to territoriality which must be<br />
kept quite distinct. We can distinguish initially between<br />
'What causes territorial behaviour?' <strong>and</strong> 'What<br />
are the consequences <strong>of</strong> territoriality?'; but even the<br />
first <strong>of</strong> these is itself the confusion <strong>of</strong> two quite<br />
separate questions, namely 'What is the ultimate<br />
cause or driving-force, i.e. what is the selective advantage<br />
associated with territoriality?' <strong>and</strong> 'What is the<br />
proximate cause or mechanism through which territories<br />
are established?' We shall restrict ourselves here<br />
to considering the consequences <strong>of</strong> territoriality, <strong>and</strong><br />
the selective advantages associated with it. But first we<br />
must define what is meant by a territory <strong>and</strong> by<br />
territorial behaviour. Following Davies (1978a), we<br />
will recognize a territory '. . . whenever [individuals] or<br />
groups are spaced out more than would be expected<br />
from a r<strong>and</strong>om occupation <strong>of</strong> suitable habitats'. Note,<br />
therefore, that territoriality can be ascribed not only to<br />
conventional cases like breeding great tits (Fig. 6.18a),<br />
but also to barnacles (Fig. 6.18b) <strong>and</strong> many plants.<br />
The rather special case <strong>of</strong> plants will be discussed in<br />
the next section.<br />
The most important consequence <strong>of</strong> territoriality is<br />
population regulation. Territorial behaviour is closely<br />
allied to contest competition, <strong>and</strong> this, as we saw in<br />
section 2.4, leads to exactly compensating densitydependence.<br />
The contest nature <strong>of</strong> territoriality is<br />
demonstrated by the fact that when territory owners<br />
die, or are experimentally removed, their places are<br />
rapidly taken by newcomers. Thus, Krebs (1971)<br />
found that in great tit populations, vacated woodl<strong>and</strong><br />
territories were reoccupied by birds coming from
202 PART 3: SYNTHESIS<br />
Fig. 6.19 Although the size <strong>of</strong> the territories <strong>of</strong> the golden<br />
winged sunbird Nectarina reichenowi varies enormously,<br />
each territory contains approximately the same number <strong>of</strong><br />
Leonotis flowers (Gill & Wolf, 1975). (After Davies, 1978a.)<br />
Fig. 6.18 Illustrations <strong>of</strong> territoriality. (a) Great tits (Krebs,<br />
1971), <strong>and</strong> (b) barnacles (Crisp, 1961) spaced out more than<br />
would be expected from a r<strong>and</strong>om distribution on the<br />
available suitale habitats. (After Davies, 1978a.)<br />
hedgerow territories where reproductive success was<br />
noticeable suboptimal: Watson (1967) found that with<br />
red grouse the replacements were non-territorial individuals<br />
living in flocks, which would not have bred,<br />
<strong>and</strong> would probably have died in the absence <strong>of</strong> a<br />
territory. In both cases, therefore, overall fecundity <strong>and</strong><br />
population size were limited by territorial behaviour:<br />
by a 'contest' for a limited number <strong>of</strong> territories. Removal<br />
experiments have demonstrated similar phenomena<br />
in mammals (Healey, 1967; Carl, 1971), fish<br />
(Clarke, 1 WO), dragonflies (Moore, l964), butterflies<br />
(Davies, 1 978b) <strong>and</strong> limpets (Stimson, 1973). It must be<br />
realized, however, that the exact number <strong>of</strong> territories<br />
is usually somewhat indeterminate in any one year,<br />
<strong>and</strong> certainly varies from year to year depending on<br />
environmental conditions (Fig. 6.19); <strong>and</strong> it is, perhaps,<br />
for this reason that life-table analyses for the great tit<br />
<strong>and</strong> the red grouse fail to provide clear-cut evidence <strong>of</strong><br />
density-dependence at the appropriate stage (Podoler &<br />
Rogers, 1975).<br />
Wynne-Edwards (1962) felt that these regulatory<br />
consequences <strong>of</strong> territoriality must themselves be the<br />
root causes <strong>of</strong> territorial behaviour. He suggested that<br />
the selective advantage accrued to the population as a<br />
whole : that it was advantageous to the population not<br />
to over-exploit its resources. There are, however,<br />
powerful <strong>and</strong> fundamental reasons for rejecting this<br />
'group selectionist' explanation-essentiaIly, it<br />
stretches evolutionary theory beyond reasonable limits<br />
(Maynard Smith, 1976t<strong>and</strong> Wynne-Edwards himself<br />
(Wynne-Edwards, 197 7) has subsequently<br />
recognized these reasons <strong>and</strong> accepted the rejection <strong>of</strong><br />
his ideas. Thus, if we wish to discover the ultimate<br />
cause <strong>of</strong> territoriality, we must search, within the<br />
realms <strong>of</strong> natural selection, for some advantage accruing<br />
to the individual.
CHAPTER 6: <strong>POPULATION</strong> REGULATION 203<br />
It must be recognized that in assessing individual<br />
advantage, we must demonstrate not merely that<br />
there are benefits, but that these exceed the costs<br />
associated with territoriality. This has been done in<br />
the case <strong>of</strong> the golden-winged sunbirds examined in<br />
Fig. 6.19. Gill <strong>and</strong> Wolf (1 975) demonstrated that<br />
although the size <strong>of</strong> territories may vary enormously,<br />
the nectar supply defended is suited to support an<br />
individual's daily energy requirements. They were<br />
able to measure the time that territory owners spent in<br />
various activities (including territory defence), <strong>and</strong><br />
they showed that, as a result <strong>of</strong> the exclusion <strong>of</strong> other<br />
sunbirds, nectar levels per flower inside a territory<br />
were higher than in undefended flowers. Thus, Gill<br />
<strong>and</strong> Wolf found that territory owners could obtain<br />
their daily energy requirements relatively quickly, <strong>and</strong><br />
that, overall, the energetic costs <strong>of</strong> territorial defence<br />
were easily <strong>of</strong>fset by the benefits <strong>of</strong> the energy saved<br />
by ,a shortened daily foraging time.<br />
A different type <strong>of</strong> individual advantage resulting<br />
from territoriality was demonstrated by Krebs (1971)<br />
for the great tit population <strong>of</strong> Wytharn Woods<br />
(Fig. 6.20). There, the major predators <strong>of</strong> nestlings are<br />
weasels, Mustela nivalis, which may rob up to 50% <strong>of</strong><br />
the nests in some years (Dunn, 1977). But, as Fig. 6.20<br />
shows, the closer a nest is to another nest, the greater<br />
the chance <strong>of</strong> predation. Individual selection, there-<br />
fore, favours the spacing out <strong>of</strong> nests: it pays each<br />
individual to be territorial.<br />
We can suggest then, from this very limited number<br />
<strong>of</strong> examples, that territoriality has evolved as a result<br />
<strong>of</strong> the advantages accruing to territorial individuals.<br />
But as an essentially independent consequence <strong>of</strong> this,<br />
there is competition approaching pure contest, <strong>and</strong><br />
therefore powerful (though not, <strong>of</strong> course, absolute)<br />
regulation <strong>of</strong> populations. Figure 6.21 shows a keyfactor<br />
analysis for the tawny owl population in<br />
Wytham Woods near Oxford (Southern, 1970) <strong>and</strong><br />
demonstrates how territoriality can be translated into<br />
the currency <strong>of</strong> population dynamics through this<br />
method. The number <strong>of</strong> territory-holding adults<br />
changed very little over a 13-year period (see<br />
Fig. 5.lf), but there was a great deal <strong>of</strong> variation in the<br />
numbers attempting to breed (ranging from 22 pairs in<br />
1959 to none in 1958). Failure to breed each year (k,)<br />
was the key factor in this study. Poor small mammal<br />
years corresponded with years in which the owls did<br />
not attempt to breed. Prey availability was independent<br />
<strong>of</strong> owl density so k, was a density-independent<br />
factor. Losses outside the breeding season were, however,<br />
found to be density-dependent. Tawny owls are<br />
territorial all year round <strong>and</strong> these losses were primarily<br />
<strong>of</strong> young birds which were unable to establish<br />
territories <strong>and</strong> which consequently starved.<br />
Fig. 6.20 The influence <strong>of</strong> territory size on the risk <strong>of</strong><br />
predation in the great tit. (After Krebs, 1971.)<br />
6.1 1 'Space capture' in plants<br />
Although territoriality, as such, is not normally associated<br />
with plants, there is, in plants, a phenomenon<br />
which is at least analogous to territoriality. The<br />
phenomenon can be caricatured in the proverb:<br />
'Possession is nine points <strong>of</strong> the law', <strong>and</strong> has been<br />
referred to <strong>and</strong> discussed by Harper (1977) as 'space<br />
capture'. In fact we have already discussed it briefly in<br />
section 2.5.2 as an explanation for skewed frequency<br />
distributions <strong>of</strong> plant weights.<br />
Figure 6.22a shows that in experimental populations<br />
<strong>of</strong> the grass Dactylis glomerata, the comparatively<br />
low weights exhibited by late-emerging plants are<br />
lower than would be expected from the reduction in<br />
growing period alone (Ross & Harper, 1972). The<br />
reason for this is indicated by the data in Fig. 6.22b
204 PART 3: SYNTHESIS<br />
Fig. 6.21 Key-factor analysis for the tawny owl Strix aluco.<br />
(a) Total generation mortality <strong>and</strong> individual k-values<br />
plotted against time in years, with the regression coefficient<br />
<strong>of</strong> each individual k-value plotted against total generation<br />
mortality shown in brackets; k,, failure to breed in poor<br />
small mammal years is the key factor. (b) k,, losses outside<br />
the breeding season plotted against numbers <strong>of</strong> young<br />
fledged, illustrating a strongly density-dependent mortality.<br />
(After Southern, 1970.)<br />
(Ross & Harper, 1972). <strong>Plants</strong> were grown from seed<br />
either under 'unrestricted' conditions: alone at the<br />
centre <strong>of</strong> a 7.4-cm diameter pot; or 'restricted'<br />
conditions: in a bare zone, 4.2 cm in diameter, surrounded<br />
by seeds sown at a density <strong>of</strong> 2.5 cm-2. After<br />
initially growing at the same rate the 'restricted' plants<br />
grew at a slower rate than the 'unrestricted' plants,<br />
<strong>and</strong> maintained this difference for at least 3 weeks. It<br />
appears that the growth achieved by a plant, <strong>and</strong> thus<br />
the size <strong>and</strong> fitness it attains, is determined early in its<br />
life by the pre-emption or 'capture' <strong>of</strong> space (or the<br />
resources implied by that space). Space is then unavailable<br />
(or, at least, relatively unavailable) to other<br />
plants, <strong>and</strong> these grow more slowly <strong>and</strong> attain a lower<br />
fitness as a consequence.<br />
Presumably, genetic predisposition to early emergence,<br />
<strong>and</strong> a chance association with favourable<br />
microsites, both play some part in determining which<br />
plants actually capture space. In either case, however,<br />
the result is to push competition towards the contest<br />
end <strong>of</strong> the scramble-contest continuum. The plants<br />
capture what is, in effect, a territory, <strong>and</strong> as a<br />
consequence there is a more exact regulation <strong>of</strong> plant<br />
numbers.<br />
Essentially, the same phenomenon is shown by the<br />
herbaceous perennial Anemone hepatica in Fig. 6.23<br />
(Tamm, 1956). Despite the crop <strong>of</strong> seedlings entering<br />
the population between 1943 <strong>and</strong> 1956, it is quite<br />
apparent that the most important factor determining<br />
which individuals were established in 1956 was<br />
whether or not they were established in 1943. Of the<br />
30 specimens that had reached large or intermediate<br />
size by 1943, 28 survived until 1956, <strong>and</strong> some <strong>of</strong><br />
these had ramified. By contrast, <strong>of</strong> the 112 plants that<br />
were either small in 1943 or appeared as seedlings<br />
subsequently, only 26 survived until 1956, <strong>and</strong> not<br />
one <strong>of</strong> these was sufficiently well established to h~ave<br />
flowered.<br />
Similar patterns are obvious from simple obsenvations<br />
<strong>of</strong> tree populations. The survival-rate <strong>of</strong> the few<br />
established adults is high: that <strong>of</strong> the many seedlings<br />
<strong>and</strong> saplings is comparatively low. In all such cases it<br />
is clear that the major prerequisite for high (or indleed<br />
positive) fitness is the capture <strong>of</strong> space. We can think<br />
<strong>of</strong> this as the plant equivalent <strong>of</strong> animal territoriality,<br />
<strong>and</strong> the regulatory consequences are essentially the<br />
same.<br />
The significance <strong>of</strong> pre-emptive space capture for<br />
the fitness <strong>of</strong> individual plants <strong>and</strong> the fact that plants<br />
are sedentary emphasizes the need to consider the<br />
spatial arrangement <strong>of</strong> plants in the regulation <strong>of</strong> plant<br />
populations. The structure <strong>of</strong> a population <strong>of</strong> a peren-
CHAPTER 6: <strong>POPULATION</strong> REGULATION 205<br />
Fig. 6.22 (a) The influence <strong>of</strong> emergence time on the dry<br />
weight per plant <strong>of</strong> Dactylis glomerata. The dashed line<br />
shows the weights that would have been achieved had the<br />
weights <strong>of</strong> late emergers been attributable only to their<br />
reduced growth period. (b) The growth <strong>of</strong> D. glomerata<br />
seedlings with <strong>and</strong> without neighbours. (After Ross &<br />
Harper, 1972.) For further explanation, see text.<br />
nial plant at any particular point in time will be a<br />
reflection <strong>of</strong> past phases <strong>of</strong> successful recruitment <strong>and</strong><br />
the outcome <strong>of</strong> contest competition for resources,<br />
pairticularly light. The age- <strong>and</strong> size-structure arising<br />
from recruitment <strong>and</strong> the process <strong>of</strong> asymmetric<br />
competition will have a major bearing on the changing<br />
size distribution <strong>of</strong> individual plants (Hutchings,<br />
1985). Recognition <strong>of</strong> the potential importance <strong>of</strong> the<br />
size <strong>of</strong> immediate neighbours to the fitness <strong>of</strong> any one<br />
individual has led to the use <strong>of</strong> neighbourhood analyses.<br />
In these the fitness components held <strong>and</strong> survivor-<br />
ship) <strong>of</strong> an individual are described in relation to the<br />
number <strong>of</strong> neighbouring plants occurring with increasing<br />
distance (Pacala & Sil<strong>and</strong>er, 1985). Whilst<br />
these approaches provide an important way <strong>of</strong> linking<br />
the performance <strong>of</strong> individuals to overall population<br />
performance, if only spatial interrelations are considered<br />
then considerable variation in the size <strong>of</strong> individuals<br />
is unaccounted for. As we have seen above, the<br />
relative time <strong>of</strong> emergence <strong>of</strong> a plant is crucial to an<br />
individual's success, <strong>and</strong> methods <strong>of</strong> analysis have still<br />
to be developed that adequately account for fitness in<br />
relation to both local spatial variation in neighbourhood<br />
density <strong>and</strong> time <strong>of</strong> plant 'birth' (Firbank &<br />
Watkinson, 1990).<br />
Whilst considerable size inequalities may exist<br />
amongst individuals in plant populations for very<br />
many reasons, their influence on population dynamics<br />
may be not nearly so marked. Crawley (1993) has<br />
pointed out that the effects <strong>of</strong> size differences are <strong>of</strong>ten<br />
strongly mediated by plasticity in form <strong>and</strong> size as<br />
plants are inherently modular. The linear relationship<br />
between size <strong>and</strong> fecundity (see Fig. 2.11) means that<br />
the tendency for overcompensating densitydependence<br />
<strong>of</strong>ten evident in insect populations will be<br />
much reduced <strong>and</strong> in consequence plant populations<br />
are much less likely to show cyclical <strong>and</strong> chaotic<br />
dynamical behaviour. An apparent exception to this is<br />
Erophila verna which may exhibit cyclical dynamics<br />
(Silvertown & Lovett Doust, 1993).<br />
6.12 Chaos in ecological systems<br />
In section 3.4 we saw how time-lags, high reproductive<br />
rates <strong>and</strong> highly overcompensating densitydependence<br />
are capable <strong>of</strong> provoking many types <strong>of</strong><br />
fluctuations in population density in single-species<br />
population models, without invoking any extrinsic<br />
cause. The most surprising type <strong>of</strong> population fluctuation<br />
that can be produced from such models is that<br />
which has been described as chaotic. One <strong>of</strong> the more<br />
surprising discoveries <strong>of</strong> population ecology in the<br />
1970s was that many <strong>of</strong> the simple models <strong>of</strong> animal<br />
population dynamics were seen to display chaotic<br />
fluctuations (see May, 1974, 1976; May & Oster,<br />
1976). Chaos has generated much interest because it
206 PART 3: SYNTHESIS<br />
Fig. 6.23 The behaviour <strong>of</strong> Anemone hepatica in a forest.<br />
Each line represents one individual: straight for unrarnified<br />
ones; branched where the plant has ramified; bold where<br />
the plant flowered; <strong>and</strong> broken where the plant was not<br />
seen that year. Group A were alive <strong>and</strong> large in 1943;<br />
group B alive <strong>and</strong> small; group C appeared first in 1944;<br />
group D in 1945; <strong>and</strong> group E thereafter, presumably from<br />
seedlings. (From Tamm, 1956; after Harper, 1977.)<br />
had previously been supposed that the irregular<br />
population fluctuations typically seen in real data<br />
must be due to r<strong>and</strong>om environmental fluctuations or<br />
sampling errors. That such fluctuations may arise in<br />
deterministic models in which all the parameter<br />
values are known exactly is quite remarkable. One <strong>of</strong><br />
the aims <strong>of</strong> population ecology is to be able to<br />
underst<strong>and</strong> the dynamics <strong>of</strong> populations to such an<br />
extent that future dynamics can be predicted. If<br />
chaotic behaviour prevents us from being able to do<br />
this with deterministic, simple models, then it will be<br />
extremely difficult to achieve it in real populations.<br />
The discovery <strong>of</strong> the potential for chaos in population<br />
models stimulated a search for chaos in real<br />
populations. This search has progressed along three<br />
fronts. The first involves fitting population models<br />
capable <strong>of</strong> predicting a range <strong>of</strong> dynamics from stalble<br />
to chaotic depending on the values <strong>of</strong> one or more<br />
parameters. The second is concerned with the examination<br />
<strong>of</strong> data from laboratory populations, usually <strong>of</strong><br />
insects, that have been maintained over a large<br />
number <strong>of</strong> generations. The third involves the development<br />
<strong>of</strong> new analytical techniques from non-linear<br />
mathematics designed to detect chaos in time-series<br />
data. We shall consider each <strong>of</strong> these techniques<br />
below.<br />
Hassell et al. (1976) were the first to fit models to<br />
field data in this context. They estimated the pararneters<br />
<strong>of</strong> a simple single-species discrete-generation<br />
model (equation 3.4) capable <strong>of</strong> showing chaos, using<br />
28 sets <strong>of</strong> insect population data (24 from the field =<strong>and</strong><br />
four from the laboratory). Their results are shown1 in<br />
Fig. 6.24 (see also section 3.4). With two exceptions all<br />
the field life-table data fell in the region <strong>of</strong> monotonic<br />
damping, with a stable equilibrium point. Of the<br />
remaining field studies, one fell in the region <strong>of</strong>
CHAPTER 6: <strong>POPULATION</strong> REGULATION 207<br />
Fig. 6.24 Stability boundaries between the densitydependent<br />
parameter, b, <strong>and</strong> population growth rate, R,<br />
from equation 3.4, together with estimated parameters<br />
from field (a) <strong>and</strong> laboratory (0) studies. (After Hassell<br />
et al., 1976.)<br />
damped oscillations <strong>and</strong> the other in the region <strong>of</strong><br />
stable limit cycles. This last study was <strong>of</strong> the Colorado<br />
potato beetle Leptinotarsa decemlineata a well-known<br />
outbreak pest in present day agroecosystems (see<br />
section 6.6). Of the four studies <strong>of</strong> laboratory populations,<br />
one fell in the region <strong>of</strong> monotonic damping, two<br />
fell in the region <strong>of</strong> damped oscillations, <strong>and</strong> the fourth<br />
fell in the chaotic region. Figure 6.24 could be interpreted<br />
as indicating a tendency for natural populations<br />
to have stable equilibria while laboratory<br />
populations show cyclic or chaotic behaviour. There<br />
were, however, a number <strong>of</strong> important assumptions<br />
implicit in this study, many <strong>of</strong> which the authors<br />
themselves point out. The most serious <strong>of</strong> these is that<br />
there are no truly single-species populations in the<br />
real world, <strong>and</strong> it is unclear how valid it is to abstract<br />
the dynamics <strong>of</strong> any population from its natural<br />
community to a single-species population model. In<br />
addition the use <strong>of</strong> a single-species model biases the<br />
results in favour <strong>of</strong> stability since complex dynamics<br />
are more likely in complex systems. We have already<br />
seen how delayed density-dependence, one phenomenon<br />
likely to arise as a result <strong>of</strong> biotic interactions, is<br />
found in many insect populations (Turchin, 1990) but<br />
remained obscure from those looking for densitydependence<br />
from life-table studies (see section 6.7.1).<br />
A number <strong>of</strong> other workers have looked for evidence<br />
<strong>of</strong> chaos in laboratory populations, mostly <strong>of</strong><br />
Drosophila (e.g. Thomas et al., 1980; Mueller & Ayala,<br />
1981), but failed to find it. However, by the late 1980s<br />
the laboratory approach seemed to be more promising
208 PART 3: SYNTHESIS<br />
Fig. 6.25 (a) Predicted dynamics for the interaction between<br />
Callosobruchus chinensis ( ) <strong>and</strong> the pteromalid parasitoid<br />
Lariophagus distinguendus (-- -). The stimulations were<br />
started with two adult hosts on day 1 <strong>and</strong> 0.02 parasitoids<br />
were added on day 17 <strong>of</strong> the seventh generation. (b) As<br />
with the discovery <strong>of</strong> chaos in a series <strong>of</strong> population<br />
models, particularly host-parasitoid models, with parameters<br />
within the range <strong>of</strong> biological realism. For<br />
example, Bellows <strong>and</strong> Hassell (1988) investigated an<br />
age-structued host-parasitoid model which exhibited<br />
intriguing irregular fluctuations using experimentally<br />
determined parameter values (Fig. 6.25a & 6. 25b).<br />
The irregular cycles seen in a study <strong>of</strong> Utida (1950) <strong>of</strong><br />
a similar host-parasitoid system, the bruchid beetle<br />
Callosobruchus chinensis <strong>and</strong> its pteromalid parasitoid<br />
Anisopterorntrlus cal<strong>and</strong>rae were qualitatively so similar<br />
to the results <strong>of</strong> the simulation model <strong>of</strong> Bellows <strong>and</strong><br />
Hassell that they, too, may arise from the internal<br />
dynamics <strong>of</strong> the interaction (Fig. 6.2 5c).<br />
The third approach in the search for chaos in real<br />
populations has been the development <strong>of</strong> techniques<br />
for (a), but for Callosobruchus maculatus <strong>and</strong> Lariophagus<br />
distinguendus. (c) Observed dynamics <strong>of</strong> populations <strong>of</strong><br />
Callosobruchus chinensis (0) <strong>and</strong> pteromalid Anisopteromalus<br />
cal<strong>and</strong>rae (0) from the laboratory system <strong>of</strong> Utida (1950).<br />
(After Bellows & Hassell, 1988.)<br />
for distinguishing chaos from r<strong>and</strong>om noise in the<br />
analysis <strong>of</strong> time-series. One such scheme is that <strong>of</strong><br />
Sugihara <strong>and</strong> May (1990), who used a library <strong>of</strong> past<br />
patterns in a time-series to make short-term predictions<br />
about future patterns. By then plotting the<br />
correlation coefficient <strong>of</strong> prediction <strong>and</strong> actual trajectories<br />
against prediction time interval they considered<br />
it possible to make the distinction between dynamical<br />
chaos <strong>and</strong> measurement error. This is based on one <strong>of</strong><br />
the 'signatures' <strong>of</strong> chaos, namely that in a chaotic<br />
system, the accuracy <strong>of</strong> forecast falls <strong>of</strong>f with prediction<br />
time, whereas in a system that is merely 'noisy'<br />
the forecasting accuracy is roughly independent <strong>of</strong> the<br />
prediction interval. These new mathematical techniques<br />
are particularly dem<strong>and</strong>ing <strong>of</strong> data <strong>and</strong> there<br />
are few biological data sets <strong>of</strong> sufficient quality <strong>and</strong>
CHAPTER 6: <strong>POPULATION</strong> REGULATION 209<br />
length to be suitable for the application <strong>of</strong> the techniques.<br />
However, data from childhood diseases, notably<br />
measles <strong>and</strong> chicken pox have been analysed by<br />
Sugihara <strong>and</strong> May (1 990). The non-linear forecasting<br />
technique seems to indicate that prediction error in<br />
measles occurs in a manner consistent with chaotic<br />
dynamics but that this is not the case with chicken pox<br />
where prediction error is characteristic <strong>of</strong> pure additive<br />
noise (actually superimposed on a seasonal cycle).<br />
However, the conclusions <strong>of</strong> the childhood diseases<br />
analysis <strong>and</strong> the technique itself have been challenged<br />
by Hastings et al. (1993).<br />
Another approach to detecting chaos in time-series<br />
data is that <strong>of</strong> Turchin <strong>and</strong> Taylor (1992). Their<br />
approach in some ways follows that <strong>of</strong> Hassell et al.<br />
(1976), but deals with multi-species systems by including<br />
in the model delayed population density, which<br />
reflects the interactions with other species. Unlike<br />
Hassell et al. (1976), Turchin <strong>and</strong> Taylor did not<br />
specify a particular equation, but fitted a response<br />
surface, the logarithm <strong>of</strong> yearly population change, as<br />
a fiunction <strong>of</strong> lagged population densities (see the<br />
Turchin & Taylor paper for details <strong>of</strong> the technique).<br />
Turchin <strong>and</strong> Taylor analysed time-series data for 14<br />
insect <strong>and</strong> 22 vertebrate populations. Their results<br />
were different from those <strong>of</strong> Hassell et al. (1976). They<br />
found exponentially stable point equilibria in only<br />
three out <strong>of</strong> 14 insect populations, compared with 21<br />
out <strong>of</strong> 24 field studies reported by Hassell et al. (1976).<br />
The remaining populations displayed unregulated behaviour<br />
(one), damped oscillations (six), limit cycles<br />
(one), quasi-periodic oscillations (two) <strong>and</strong> chaos (one).<br />
The vertebrate data exhibited a similar range <strong>of</strong><br />
behaviours, though none was chaotic. Thus the conclusion<br />
that Turchin <strong>and</strong> Taylor reached was that the<br />
complete spectrum <strong>of</strong> dynamical behaviours ranging<br />
from exponential stability to chaos can be found in<br />
natural systems. (The single case <strong>of</strong> chaos has, however,<br />
been questioned by Perry et al., 1993 on the<br />
basis <strong>of</strong> more extensive data.) Although to some extent<br />
the same criticisms can be levelled at this work as that<br />
<strong>of</strong> Hassell et al., in that they assume a particular type<br />
<strong>of</strong> underlying model, the model <strong>and</strong> fitting techniques<br />
are more robust than those used in the earlier study.<br />
The significant similarity between the two studies is<br />
that both suggest that chaos is rare in field populations<br />
<strong>of</strong> insects.<br />
One study which adopts both the first <strong>and</strong> third<br />
approaches to investigating chaos, fitting population<br />
models <strong>and</strong> detection from time-series, is that <strong>of</strong><br />
Hanski et al. (1993), who explored the population<br />
oscillations <strong>of</strong> microtine rodents in boreal <strong>and</strong> Arctic<br />
regions. Their population model was a predator-prey<br />
model with seasonality in which the predators were<br />
mustelids. The model was able to generate stable<br />
dynamics, limit cycles <strong>and</strong> chaos <strong>and</strong> when parameterized<br />
with field data predicted dynamics that closely<br />
resemble the dynamics <strong>of</strong> boreal rodent populations.<br />
The analysis <strong>of</strong> extensive time-series data <strong>of</strong> microtine<br />
rodents in Fennosc<strong>and</strong>ia was achieved by using the<br />
technique <strong>of</strong> non-linear analysis developed by Turchin<br />
<strong>and</strong> Taylor. Both the model prediction <strong>and</strong> the observed<br />
dynamics are chaotic. This result suggests that<br />
the multi-annual oscillations <strong>of</strong> rodent populations in<br />
Fennosc<strong>and</strong>ia are due to delayed density-dependence<br />
imposed by mustelid predators, <strong>and</strong> they are chaotic.<br />
How to distinguish chaos from measurement error<br />
<strong>and</strong> how to find it in natural populations are some<br />
way from being resolved. The search for chaos is likely<br />
to be a particularly vigorous area for research in the<br />
1990s (see Godfray et al., 1991 <strong>and</strong> Hastings et al.,<br />
1993 for reviews).
Chapter 7<br />
7.1 Introduction 7.2 Metapopulation dynamics<br />
This chapter is divided into two parts, each concerned<br />
with entities larger than populations. In the first part<br />
(section 7.2) we go beyond the traditional boundary <strong>of</strong><br />
population ecology to consider the concept <strong>of</strong> a<br />
metapopulation, a set <strong>of</strong> local populations which<br />
interact via individuals moving among populations<br />
(Hanski & Gilpin, 1991). In Chapter 6, we examined<br />
the central issue <strong>of</strong> population ecology, namely population<br />
regulation. However, it is probable that some<br />
populations are not tightly regulated; they do not<br />
persist in one location for long periods <strong>of</strong> time at<br />
densities between positive limits. Sets <strong>of</strong> such populations<br />
may nevertheless persist in the same region, <strong>and</strong><br />
therefore their regulation <strong>and</strong> long-term persistence<br />
also depends on extinction <strong>and</strong> colonization events <strong>of</strong><br />
local populations rather than only with the birth <strong>and</strong><br />
death processes (section l. l) occurring within the local<br />
populations. We shall consider the elementary models<br />
<strong>of</strong> metapopulation dynamics, an example <strong>of</strong> a species<br />
with a metapopulation structure, <strong>and</strong> look at other<br />
areas <strong>of</strong> ecology to which the metapopulation concept<br />
is likely to have applications in the future.<br />
The subject matter <strong>of</strong> this book is the ecology <strong>of</strong><br />
populations, <strong>and</strong> it would be unreasonable, in the<br />
second part <strong>of</strong> this final chapter (section 7.3), to<br />
attempt to cover the ground <strong>of</strong> some other book<br />
concerned with the ecology <strong>of</strong> communities. Nevertheless,<br />
it will be valuable to consider, briefly, the roles<br />
that the various processes considered in the earlier<br />
chapters play in determining community structure.<br />
Specifically, we shall consider, in turn, the roles that<br />
interspecific competition, predation, disturbance, instability,<br />
<strong>and</strong> habitat size <strong>and</strong> diversity can play; <strong>and</strong><br />
then draw what conclusions we can regarding their<br />
general importance in actual communities.<br />
The term metapopulation was coined by Levins<br />
(1970), though Andrewartha <strong>and</strong> Birch (1954) were<br />
among the first ecologists to acknowledge that models<br />
<strong>of</strong> single, isolated populations were inadequate for<br />
describing the dynamics <strong>of</strong> species in which local<br />
populations frequently become extinct.<br />
The metapopulation concept has taken some time to<br />
develop <strong>and</strong> the reasons may be that ecologists were<br />
unclear that Levins had said anything new, <strong>and</strong> that<br />
the literature on colonization <strong>and</strong> extinction at the<br />
time was dominated by MacArthur <strong>and</strong> Wilson's<br />
(1967) isl<strong>and</strong> biogeography text. This book was concerned<br />
with explaining the equilibrium number <strong>of</strong><br />
species on isl<strong>and</strong>s. It was dealing with the same<br />
parameters <strong>of</strong> colonization <strong>and</strong> extinction as Levins,<br />
but always with colonization from a source area<br />
(mainl<strong>and</strong>) to an isl<strong>and</strong>. Another real difficulty for the<br />
development <strong>of</strong> the metapopulation concept is that<br />
metapopulations function on temporal <strong>and</strong> spatial<br />
scales that are not convenient for ecologists to study;<br />
local populations may persist for longer than the life<br />
span <strong>of</strong> the average research grant <strong>and</strong> metapopulations<br />
last longer than that. The growing awareness by<br />
ecologists <strong>of</strong> the role <strong>of</strong> spatial distributions in population<br />
ecology (as seen in each <strong>of</strong> Chapters 4-6) in the<br />
1980s <strong>and</strong> early 1990s has undoubtedly hastened the<br />
development <strong>of</strong> the metapopulation concept, though it<br />
is worth stressing that there is a diierence between a<br />
metapopulation <strong>and</strong> a patchily distributed local population.<br />
7.2.1 Metapopulation models<br />
Levins (1969) distinguished between the dynamics <strong>of</strong><br />
single populations <strong>and</strong> a set <strong>of</strong> local populations. He<br />
assumed that individual local populations were either<br />
at carrying-capacity (K) or extinct, thereby ignoring
CHAPTER 7: BEYOND <strong>POPULATION</strong> <strong>ECOLOGY</strong> 211<br />
local dynamics except for colonization <strong>and</strong> extinction<br />
events. The variable p, in his model denotes the<br />
fraction <strong>of</strong> habitat patches occupied by a species at<br />
time t. The spatial arrangement <strong>of</strong> patches is assumed<br />
to be <strong>of</strong> no consequence; individuals in one patch are<br />
equally likely to disperse to any <strong>of</strong> the other patches.<br />
The basic Levins model has the following form:<br />
there is some density-dependence in local dynamics<br />
(constant K in the Levins model).<br />
The next level <strong>of</strong> complexity in single-species<br />
metapopulation models comes with the incorporation<br />
<strong>of</strong> local population dynamics into the models.<br />
Figure 7.1 shows some examples which suggest that<br />
dpldt = colonization rate - extinction rate. (7.1)<br />
Here, dpldt is the rate <strong>of</strong> change in the fraction <strong>of</strong><br />
occupied patches <strong>and</strong> the equation is therefore analogous<br />
to population models in which rate <strong>of</strong> change <strong>of</strong><br />
abundance is the difference between birth- <strong>and</strong> deathrates.<br />
In his first model, Levins (1969) assumed that<br />
the rate <strong>of</strong> colonization was proportional to p, the<br />
fraction <strong>of</strong> patches from which potential immigrants<br />
were available to colonize empty patches, <strong>and</strong> to 1 - p,<br />
the fraction <strong>of</strong> unoccupied patches, or targets for<br />
colonization. Since all local populations are assumed<br />
to be at their carrying-capacity, they all have the same<br />
extinction probability <strong>and</strong> the model becomes:<br />
dpldt = mp (l - p) - ep,<br />
where m is the rate <strong>of</strong> recolonization <strong>of</strong> empty patches<br />
<strong>and</strong> e is the rate <strong>of</strong> local extinction <strong>of</strong> patches. Thus the<br />
amount <strong>of</strong> recolonization increases both with the<br />
number <strong>of</strong> empty patches prone to colonization (1-p)<br />
ancl the number <strong>of</strong> occupied patches able to provide<br />
colonizers, p. Extinctions simply increase with p. The<br />
equilibrium value <strong>of</strong> p (obtained by setting dpldt = 0) is:<br />
This simple model makes one important point: a<br />
rnetapopulation can only persist if, when small, the<br />
rate <strong>of</strong> establishment <strong>of</strong> new local populations exceeds<br />
the rate <strong>of</strong> local extinctions. This conclusion, while in<br />
itself unremarkable, nevertheless provides us with a<br />
means <strong>of</strong> relating metapopulation dynamics to the<br />
structure <strong>of</strong> the environment, particularly the size <strong>and</strong><br />
isolation <strong>of</strong> habitat patches (Hanski, 1989). In addition<br />
the model contains the three basic elements necessary<br />
for population regulation at the metapopulation level.<br />
They are that colonization <strong>and</strong> extinction events are at<br />
least to some extent uncorrelated among local population~,<br />
there is dispersal between habitat patches, <strong>and</strong><br />
Fig. 7.1 Relationship between the probability <strong>of</strong> local<br />
extinction <strong>and</strong> p in (a) mangrove isl<strong>and</strong> insects (Simberl<strong>of</strong>f,<br />
1976), (b) leafhoppers (Konthanen, 1950), <strong>and</strong><br />
(c) freshwater molluscs living in small ponds (Boycott,<br />
1930). (After Hanski, 1991 .)
212 PART 3: SYNTHESIS<br />
extinction probability is not constant between patches,<br />
but decreases as the fraction <strong>of</strong> patches occupied (p)<br />
increases. The reasons for this are two well-known<br />
phenomena: (i) the increase in extinction probability<br />
with declining population size (e.g. Williamson, 1981);<br />
<strong>and</strong> (ii) the observed increase in local population size<br />
as p increases, (e.g. Hanski, 1982; Gaston & Lawton,<br />
1990). This is contrary to the assumptions <strong>of</strong> the<br />
Levins model, which Hanski (1991) then modified<br />
accordingly:<br />
dpldt = mp(1 - p) - eo e-aP p<br />
where eo <strong>and</strong> a are two extinction parameters. If eo is<br />
greater than m, the model may have two alternative<br />
stable equilibria (Fig. 7.2), separated by an unstable<br />
equilibrium, a threshold value for metapopulation<br />
persistence (Hanski, 1991). The importance <strong>of</strong> alternative<br />
equilibria lies in the possible use <strong>of</strong> metapopulation<br />
models to aid the re-establishment <strong>of</strong> species in<br />
fragmented habitats. If alternative equilibria exist the<br />
propagule (or size <strong>of</strong> the introduction) must be sufficient<br />
to push the metapopulation beyond its threshold<br />
value.<br />
Further developments in metapopulation models,<br />
both single <strong>and</strong> multi-species, are likely to involve the<br />
incorporation <strong>of</strong> stochastic processes <strong>and</strong> a closer link<br />
between regional <strong>and</strong> local dynamics (see papers in<br />
Gilpin & Hanski, 1991).<br />
7.2.2 Examples <strong>of</strong> metapopulations<br />
In order for species to conform to a metapopulation<br />
structure there must be a tendency for local populations<br />
to become extinct, <strong>and</strong> a relatively poor ability to<br />
disperse <strong>and</strong> colonize new habitats. Waterfleas (Daphnia<br />
spp.) in rockpools (Bengtsson, 1991) <strong>and</strong> pool frogs<br />
in successional ponds (Sjogren, 1991) provide close<br />
approximations to the Levins concept. However, some<br />
<strong>of</strong> the most persuasive examples come from studies <strong>of</strong><br />
butterflies (e.g. Harrison et al., 1988; Thomas &<br />
Harrison, 1992).<br />
Thomas <strong>and</strong> Harrison studied nine metapopulations<br />
<strong>of</strong> the silver-studded blue butterfly Plebejus argus in<br />
North Wales. This species is patchily distributed<br />
wherever it has been studied. It typically occurs in<br />
temporary habitats, but despite this, most adults move<br />
only short distances. In North Wales, P. argus lays its<br />
eggs along the margins between bare ground <strong>and</strong> the<br />
vegetation on which the larvae feed, usually on south<br />
facing slopes. The larvae are relatively polyphagous<br />
(hosts from the Ericaceae, Leguminosae <strong>and</strong> Cistaceae)<br />
<strong>and</strong> it is oviposition site rather than host plant that<br />
limits persistence. The larvae <strong>and</strong> pupae are also<br />
associated with Lasius ants, with which it has an<br />
extremely close, <strong>and</strong> probably mutualistic relationship<br />
(Jordano & Thomas, 1992). The metapopulations studied<br />
by Thomas <strong>and</strong> Harrison occurred in two main<br />
Fig. 7.2 Alternative stable equilibria<br />
in a modified Levins model, equation<br />
7.5, which takes into account the<br />
empirically observed (Fig. 7.1)<br />
negative relationship between<br />
extinction probability <strong>and</strong> p. The<br />
thick line gives the colonization <strong>and</strong><br />
extinction rates divided by p. In<br />
(b) the two functions have only one<br />
intersection point, which is stable,<br />
but in (a) there are two intersection<br />
points, a stable one (a) <strong>and</strong> an<br />
unstable one (0). In this case the<br />
trivial solution (y = 0) is also stable.<br />
(After Hanski, 1991 .)
CHAPTER 7: BEYOND <strong>POPULATION</strong> <strong>ECOLOGY</strong> 213<br />
biotopes, heathl<strong>and</strong> <strong>and</strong> limestone grassl<strong>and</strong>. In<br />
heathl<strong>and</strong> the successional nature <strong>of</strong> the habitat is<br />
maintained by burning, cutting, grazing or disturbance,<br />
which all serve to create oviposition sites. In<br />
limestone grassl<strong>and</strong>, the suitable microhabitat <strong>of</strong> vegetation<br />
<strong>and</strong> bare ground can be created <strong>and</strong> maintained<br />
by grazing indefinitely, <strong>and</strong> succession is<br />
extremely slow in any case on similar limestone<br />
habitats, such as screes, crags, quarries, etc. Thomas<br />
<strong>and</strong> Harrison (1992) described surveys <strong>of</strong> suitable sites<br />
in North Wales in 1983 <strong>and</strong> 1990. Examples <strong>of</strong> the<br />
distribution <strong>of</strong> Plebejus argus are shown in Fig. 7.3a<br />
<strong>and</strong> 7.3b for a heathl<strong>and</strong> <strong>and</strong> a limestone metapopulation.<br />
The Dulas Valley limestone metapopulation is<br />
<strong>of</strong> particular interest as it maps the colonization <strong>of</strong> a<br />
network <strong>of</strong> habitat patches following the introduction<br />
in 1942 <strong>of</strong> 90 females to one patch.<br />
On a regional scale the distribution <strong>of</strong> P. argus was<br />
limited by its low dispersal tendency. Suitable habitat<br />
only a few kilometres from existing metapopulations<br />
remained uninhabited. Evidence that at least some <strong>of</strong><br />
these habitats are suitable (not just in the minds <strong>of</strong><br />
human observers) comes from the successful introduction<br />
into the Dulas Valley. Within metapopulations<br />
local butterfly distribution closely followed that <strong>of</strong><br />
suitable habitat with most patches within 1 km <strong>of</strong><br />
existing populations being occupied. As might be<br />
expected turnover was greater in heathl<strong>and</strong>, where<br />
transient successional habitats remained for relatively<br />
short times, than in limestone grassl<strong>and</strong>, where the<br />
habitat can be maintained in the suitable successionaI<br />
state for long periods by grazing. In addition heathl<strong>and</strong><br />
habitat patches were generally smaller than<br />
those on limestone grassl<strong>and</strong>, <strong>and</strong> small patches<br />
Fig. 7.3 (a) The distribution <strong>of</strong> Plebejus<br />
argus in the South StacksIHolyhead<br />
Mountain heathl<strong>and</strong> metapopulation<br />
in 1983 <strong>and</strong> 1990. Filled outlines<br />
indicate areas where P. argus was<br />
present in both 1983 <strong>and</strong> 1990. Empty<br />
outlines indicate areas where P. argus<br />
was not present in both time periods:<br />
e, presumed extinction (P. argus was<br />
present in 1983 only); c, presumed<br />
colonization (present 1990 only);<br />
v, vacant but apparently suitable<br />
habitat in 1990. (b) Colonization <strong>of</strong> the<br />
Dulas Valley limestone site by P. argus.<br />
following the introduction <strong>of</strong> 90<br />
females in 1942. The 1973 signs give<br />
the outermost boundaries <strong>of</strong> patches<br />
occupied in 1971-73. (After Thomas<br />
& Harrison, 1992.)
214 PART 3: SYNTHESIS<br />
showed higher turnover than large patches in any<br />
case.<br />
Whether the individuals in a series <strong>of</strong> patches<br />
should be regarded as a series <strong>of</strong> separate populations,<br />
a metapopulation or as one population with a number<br />
<strong>of</strong> resource patches depends on the distribution <strong>of</strong><br />
dispersal distances relative to patch size <strong>and</strong> the<br />
distance between patches. If dispersal distances are<br />
extremely low relative to the distances between<br />
patches, then the patches can be said to hold a series<br />
<strong>of</strong> separate populations. Conversely, dispersal distances<br />
are extremely high in relation to distances<br />
between patches, then the patches are simply part <strong>of</strong><br />
the heterogeneity experienced by a single population.<br />
The populations <strong>of</strong> P. argus in North Wales described<br />
by Thomas <strong>and</strong> Harrison, particulary those on heathl<strong>and</strong>,<br />
are intermediate in these respects <strong>and</strong> would<br />
seem to fit the metapopulation concept reasonably<br />
well.<br />
7.2.3 Applications <strong>of</strong> the rnetapopulation concept<br />
The equilibrium theory <strong>of</strong> isl<strong>and</strong> biogeography proposed<br />
by MacArthur <strong>and</strong> Wilson (1967) is, as we have<br />
seen, concerned with the same basic processes as the<br />
metapopulation models, namely colonization <strong>and</strong> extinction.<br />
The theory attempted to account for the<br />
number <strong>of</strong> species on real isl<strong>and</strong>s or habitat isl<strong>and</strong>s,<br />
<strong>and</strong> proposed that the species number was an equilibrium<br />
between immigration <strong>and</strong> extinction rates, themselves<br />
determined by isl<strong>and</strong> area <strong>and</strong> distance from<br />
the source <strong>of</strong> colonists. The difference between the<br />
MacArthur-Wilson model <strong>and</strong> the metapopulation<br />
models is that in the former there is a mainl<strong>and</strong> which<br />
is an inexhaustible source <strong>of</strong> colonists, <strong>and</strong> in the<br />
latter all colonists must come from existing local<br />
populations. The MacArthur-Wilson model is concerned<br />
with numbers <strong>of</strong> species, the metapopulation<br />
models are concerned with populations <strong>of</strong> single<br />
species. However, Hanski <strong>and</strong> Gilpin (1991) <strong>and</strong><br />
Gotelli (1991) provide a single-species version <strong>of</strong> the<br />
MacArthur-Wilson model analogous to equation 7.1<br />
for changes in the fraction <strong>of</strong> isl<strong>and</strong>s occupied:<br />
dp/dt = m(1 - p) - ep, (7.5)<br />
where m is now migration from the mainl<strong>and</strong> to the<br />
isl<strong>and</strong>s. The equilibrium value <strong>of</strong> p is:<br />
p = m/(m + e), (7.6)<br />
which is always positive for isl<strong>and</strong>s with any turnover.<br />
Equation 7.5 describes the frequency <strong>of</strong> occurrence <strong>of</strong><br />
a species when neither immigration nor extinction<br />
probabilities are affected by regional occurrences.<br />
Most metapopulations probably function somewlhere<br />
between that described by Levins <strong>and</strong> the modified<br />
MacArthur-Wison model. It is almost inconceivable<br />
that all habitat patches will be so similar that each has<br />
the same carrying-capacity, an assumption <strong>of</strong> the<br />
Levins model. Those local populations which are<br />
much larger than average will have reduced exlinction<br />
probabilities <strong>and</strong> thus function as small mainl<strong>and</strong>s.<br />
They may be so large that they are extremely<br />
long-lived <strong>and</strong> the appropriate metapopulation structure<br />
is one <strong>of</strong> an almost permanent patch with<br />
transient satellite patches. A good example <strong>of</strong> such a<br />
structure is provided by Harrison et al. (1988) for the<br />
bay checkerspot butterfly in California (Fig. 7.4). In<br />
1987 the metapopulation consisted <strong>of</strong> a 2000-ha<br />
habitat patch (M~rgan Hill) containing <strong>of</strong> the order <strong>of</strong><br />
106 adult butterflies <strong>and</strong> nine small populations containing<br />
between 10 <strong>and</strong> 350 adults on patches <strong>of</strong><br />
between 1 <strong>and</strong> 250 ha. Of some 27 small habitat<br />
patches in the region that were suitable for the<br />
butterfly, only those closest to Morgan Hill were<br />
occupied. Such a pattern <strong>of</strong> patch occupancy is not<br />
explicable in terms <strong>of</strong> habitat quality, but it rather<br />
reflects the butterfly's limited powers <strong>of</strong> dispersal. The<br />
large population at Morgan Hill acts as the dominant<br />
source <strong>of</strong> colonists to the smaller patches. In this case<br />
the persistence <strong>of</strong> the metapopulation is relatively<br />
unaffected by population turnover on the smaller<br />
patches.<br />
In the 1970s isl<strong>and</strong> biogeography theory was linked<br />
with the design <strong>of</strong> nature reserves (Diamond & May,<br />
1981). How many Amazonian plant <strong>and</strong> animal<br />
species will survive if only 1% <strong>of</strong> the Amazonian<br />
rainforest survives? At what rate will species be lost? Is<br />
it best to allocate a certain total area to one large or<br />
several small reserves? Species area curves (like<br />
Fig. 7.10) <strong>of</strong>fered insights into the first question <strong>and</strong><br />
the MacArthur-Wilson equilibrium theory held out<br />
the promise <strong>of</strong> a solution to questions like the second
CHAPTER 7: BEYOND <strong>POPULATION</strong> <strong>ECOLOGY</strong> 215<br />
Fig. 7.4 Metapopulation <strong>of</strong> the bay<br />
checkerspot butterfly Euphydryas<br />
editha bayensis. The black areas<br />
represent patches <strong>of</strong> the butterfly's<br />
serpentine grassl<strong>and</strong> habitat. The<br />
2000-ha patch labelled 'Morgan Hill'<br />
supported a population <strong>of</strong> in the<br />
order <strong>of</strong> 106 adult butterflies in<br />
1987. The nine smaller patches<br />
labelled with arrows supported<br />
populations <strong>of</strong> in the order <strong>of</strong><br />
between 101 <strong>and</strong> 102 butterflies in<br />
that year. Eighteen other small<br />
patches were found to be suitable<br />
but unoccupied. (After Harrison,<br />
1991.)<br />
ancl third. As environments become increasingly fragmented,<br />
many species, which previously had continuous<br />
spatial distributions, may find themselves with a<br />
rather more discontinuous one. Species with very poor<br />
powers <strong>of</strong> dispersal in a newly fragmented habitat will<br />
simply exist in smaller populations with each one<br />
facing an increased probability <strong>of</strong> extinction. Others<br />
with better powers <strong>of</strong> dispersal are likely to exist as<br />
metapopulations. Thus the controversy alluded to<br />
above about whether or not an area set aside for<br />
nature conservation should be one large or several<br />
small reserves (see Simberl<strong>of</strong>f & Abele 1976) is really a<br />
metapopulation rather than an isl<strong>and</strong> biogeographic<br />
problem, particularly when the reserve is being designed<br />
for one or a few key species. Metapopulation<br />
dynamics provides a natural framework for considering<br />
the survival <strong>of</strong> species in a network <strong>of</strong> reserves<br />
(Hanski, 1989).<br />
Like Hanski (1990) we are tempted to speculate that<br />
metapopulation regulation may prove to be as important<br />
for many species as traditional population regulation.<br />
Tree species in tropical forests have a wide<br />
diversity <strong>and</strong> patchy distributions. There is much less<br />
<strong>of</strong> a tendency in the tropics for species to occur in solid<br />
st<strong>and</strong>s than in temperate forests. This means that<br />
there can be a considerable nearest-neighbour distance<br />
between conspecific trees. Tree canopies <strong>of</strong><br />
particular species thus effectively become patches <strong>of</strong><br />
suitable habitat surrounded by a sea <strong>of</strong> potentially<br />
unsuitable (or even downright poisonous) habitat. In<br />
the canopies <strong>of</strong> these trees live a high percentage <strong>of</strong><br />
the metazoan species on this planet (Erwin & Scott,<br />
1980; May, 1988), many <strong>of</strong> which are monophagous<br />
<strong>and</strong> oligophagous herbivorous insects. These species<br />
may conform to the metapopulation concept, particularly<br />
those that have relatively poor dispersal abilities.
216 PART 3: SYNTHESIS<br />
This is an exciting scenario for future research <strong>and</strong><br />
one which cannot, for obvious reasons, be delayed<br />
long.<br />
7.3 Community structure<br />
7.3.1 The role <strong>of</strong> interspecific competition<br />
Good evidence that interspecific competition can play<br />
an important role in determining community structure<br />
is provided by an experiment carried out by<br />
Putwain <strong>and</strong> Harper (1970) on a hill grassl<strong>and</strong> site in<br />
North Wales that was closely grazed by sheep. The<br />
species with which they were most concerned was<br />
sorrel, Rumex acetosella, which was second in abundance<br />
in the community to a grass, sheep's fescue<br />
(Festuca ovina). Galium saxatile (heath bedstraw) was<br />
also abundant, <strong>and</strong> 14 other species <strong>of</strong> grasses <strong>and</strong><br />
herbs were present in varying numbers. Specific<br />
components <strong>of</strong> the community were experimentally<br />
removed with herbicides by setting up plots <strong>of</strong> the<br />
following types:<br />
1 plots sprayed with Dalapon to remove all grasses;<br />
this does little <strong>and</strong> only temporary damage to Rumex<br />
acetosella <strong>and</strong> other non-gramineous species (i.e. dicots);<br />
2 plots in which individual plants <strong>of</strong> all dicots except<br />
R. acetosella were killed by the combined application <strong>of</strong><br />
the herbicides 2,4-D <strong>and</strong> Tordon 22K;<br />
3 plots sprayed with Paraquat to remove all species<br />
except R. acetosella which, despite having its aboveground<br />
parts scorched, regrows rapidly from buds at<br />
the base <strong>of</strong> the stem; <strong>and</strong><br />
4 plots in which R. acetosella plants alone were killed<br />
by spot treatment with Tordon 22K.<br />
There were also control plots that were not sprayed at<br />
all.<br />
Spraying took place on 2 June 1965 <strong>and</strong> then, to<br />
distinguish between the effects <strong>of</strong> treatment on vegetative<br />
<strong>and</strong> seedling growth, seeds were sown in parts<br />
<strong>of</strong> the plots on 20 September 1965. Abundance <strong>of</strong> R.<br />
acetosella was monitored throughout the year following<br />
treatment, <strong>and</strong> its dry weight under each regime<br />
determined on 5 July 1966. The results are shown in<br />
Figs 7.5 <strong>and</strong> 7.6.<br />
Fig. 7.5 (a) The response <strong>of</strong> a population <strong>of</strong> Rumex acetosella<br />
in a mixed grassl<strong>and</strong> sward to the removal <strong>of</strong> certain<br />
components <strong>of</strong> the sward, expressed as a percentage <strong>of</strong> the<br />
population in June 1965. (b) Numbers <strong>of</strong> seedlings per plot.<br />
Key to treatments: (-) control; (-1 R. acetosella<br />
removed; (- - - -) all dicots except R. acetosefla removed;<br />
(. . . . .) grasses removed; (- - - -) all species except<br />
R. acetosella removed. (After Putwain & Harper, 1970.)<br />
It appears that the growth <strong>of</strong> mature sorrel plants<br />
was unaffected by the removal <strong>of</strong> dicots, was increased<br />
only slightly by the removal <strong>of</strong> grasses, but was very<br />
significantly increased by the removal <strong>of</strong> both grasses<br />
<strong>and</strong> dicots. The rate <strong>of</strong> seedling establishment was<br />
increased by the removal <strong>of</strong> grasses, or <strong>of</strong> dicots, or <strong>of</strong><br />
the mature plants <strong>of</strong> R. acetosella itself.<br />
The probable explanation is illustrated in Fig. :7.7,<br />
which is a diagrammatic representation <strong>of</strong> R. acetasella's<br />
niche relationships within the community. R.<br />
acetosella, since it exists within the sward, obviously<br />
has a realized niche; but it is competitively excluded<br />
from a substantial portion <strong>of</strong> its fundamental niche in
CHAPTER 7: BEYOND <strong>POPULATION</strong> <strong>ECOLOGY</strong> 217<br />
Fig. 7.7 The diagrammatic fundamental niches <strong>of</strong> Rumex<br />
acetosella (R), grasses (G) <strong>and</strong> dicots (D). Light-shaded area:<br />
the realized niche <strong>of</strong> R. acetosella; dark-shaded areas: the<br />
fundamental niche <strong>of</strong> R. acetosella seedlings. (Modified from<br />
Putwain & Harper, 1970.)<br />
Fig. 7.6 The dry weight (g) <strong>of</strong> Rumex acetosella per plot at<br />
the end <strong>of</strong> the period <strong>of</strong> observation. For key to sward<br />
treatment, see Fig. 7.5. LSD indicated at p = 0.05. (After<br />
Putwain & Harper, 1970.)<br />
this community by the combined action <strong>of</strong> the dicots,<br />
<strong>and</strong> from a similar but even larger portion by the<br />
combined action <strong>of</strong> the grasses. It is, therefore, only<br />
when dicots <strong>and</strong> grasses are both absent that significant<br />
competitive release occurs. It appears, moreover,<br />
that the fundamental niche <strong>of</strong> the sorrel seedlings lies<br />
largely within the combined realized niche <strong>of</strong> the<br />
grasses, though other, smaller portions lie within the<br />
realized niches <strong>of</strong> the dicots <strong>and</strong> the R. acetosella<br />
adults.<br />
This experiment shows clearly that the distribution<br />
<strong>and</strong> abundance <strong>of</strong> sorrel is determined to a significant<br />
extent by the interspecific competitive interactions<br />
occurring within the grassl<strong>and</strong> community. Of course,<br />
the precise design <strong>of</strong> the niches in Fig. 7.7 is quite<br />
arbitrary <strong>and</strong> their important dimensions are not even<br />
dimly understood. Nevertheless, the figure does serve<br />
to illustrate how communities must <strong>of</strong>ten be structured<br />
by species being competitively confined to small,<br />
realized portions <strong>of</strong> their fundamental niches.<br />
We have, remember, seen several similar examples<br />
in Chapter 4: seed-eating desert ants showing differentiation<br />
in size <strong>and</strong> foraging strategy; Panicum <strong>and</strong><br />
Glycine showing niche differentiation with respect to<br />
nitrogen; barnacles partitioning space; bumblebees<br />
specializing on flowers <strong>of</strong> different corolla lengths;<br />
plants showing temporal heterogeneity in resource<br />
utilization, <strong>and</strong> so on. In the present context, the<br />
importance <strong>of</strong> these examples is that, in all such cases,<br />
the communities are structured, <strong>and</strong> species diversity<br />
increased, by resource partitioning based on competitive<br />
exclusion.<br />
7.3.2 The role <strong>of</strong> predation<br />
The most famous piece <strong>of</strong> evidence supporting the<br />
importance <strong>of</strong> predators in determining community<br />
structure is provided by the work <strong>of</strong> Paine (1966), <strong>and</strong><br />
their role is succinctly stated (as a hypothesis) by Paine<br />
himself: 'Local species diversity is directly related to<br />
the efficiency with which predators prevent the monopolization<br />
<strong>of</strong> the major environmental requisites by<br />
one species'. Paine presented some correlational support<br />
for this hypothesis, but his most persuasive<br />
evidence was experimental.<br />
On the rocky shores <strong>of</strong> the Pacific coast <strong>of</strong> North<br />
America the community is dominated by a remarkably<br />
constant association <strong>of</strong> mussels, barnacles <strong>and</strong><br />
one starfish; <strong>and</strong> Fig. 7.8 illustrates the trophic rela-
218 PART 3: SYNTHESIS<br />
4 / \<br />
Number-<br />
Calories \ ~01~0.03<br />
X=cO.OI 0.03-<br />
chitons limpets Mytilus acorn Mitella<br />
2 spp. 2 spp. (Bivalve) barnacles (goose<br />
1 sp. 3 SPP. barnacle)<br />
Fig. 7.8 The feeding relationships by numbers <strong>and</strong> calories<br />
<strong>of</strong> the Pisaster dominated subweb at Mukkaw Bay. The<br />
specific composition <strong>of</strong> each predators diet is given as a pair<br />
<strong>of</strong> proportions: numbers on the left, calories on the right.<br />
(After Paine. 1966.) 1 calorie (non-S1 unit) = 4.186 joules.<br />
tionships <strong>of</strong> this portion <strong>of</strong> the community as observed<br />
by Paine at Mukkaw Bay, Washington. The data are<br />
presented both as the numbers <strong>and</strong> as the total<br />
calories consumed by the two carnivorous species in<br />
the subweb: the starfish Pisaster ochraceus <strong>and</strong> a whelk<br />
Thais emarginata. Apparently this food web is based on<br />
a barnacle economy, with both major predators consuming<br />
them in quantity. Note, however, that in terms<br />
<strong>of</strong> calories the barnacles are only about one-third as<br />
important to Pisaster as either Mytilus californianus, a<br />
bivalve, or the browsing chiton Katherina tunicata.<br />
For several years from June 1963, Paine excluded<br />
all Pisaster from a 'typical' piece <strong>of</strong> shoreline at<br />
Mukkaw Bay about 8 m long <strong>and</strong> 2 m in vertical<br />
extent. An adjacent control area was left unaltered;<br />
<strong>and</strong> line transects across both areas were taken<br />
irregularly, <strong>and</strong> the number <strong>and</strong> density <strong>of</strong> resident<br />
macroinvertebrate <strong>and</strong> benthic algal species mea-<br />
sured. The appearance <strong>of</strong> the control area did not<br />
alter. Adult Mytilus californianus, Balanus cariosus (an<br />
acorn barnacle) <strong>and</strong> Mitella polymerus (a goose-necked<br />
barnacle) formed a conspicuous b<strong>and</strong> in the midintertidal;<br />
while at lower levels the diversity increased<br />
abruptly, with immature individuals <strong>of</strong> the above<br />
species, Balanus gl<strong>and</strong>ula in scattered clumps, a few<br />
anemones <strong>of</strong> one species, two chiton species (browsers),<br />
two abundant limpets (browsers), four macroscopic<br />
benthic algae (Porphyra, Endocladia, Rhodomela<br />
<strong>and</strong> Corallina), <strong>and</strong> the sponge Haliclona (<strong>of</strong>ten<br />
browsed upon by Anisodoris, a nudibranch) all present.<br />
Where the Pisaster were excluded, however, the<br />
situation changed markedly. Balanus gl<strong>and</strong>ula settled<br />
successfully throughout much <strong>of</strong> the area, <strong>and</strong> by<br />
September 1963 it had occupied 60-80010 <strong>of</strong> the<br />
available space. By the following June, however, the<br />
Balanus themselves were being crowded out by small,<br />
rapidly growing Mytilus <strong>and</strong> Mitella; <strong>and</strong> this process<br />
<strong>of</strong> successive replacement by more efficient occupiers<br />
<strong>of</strong> space continued, leading eventually to an experimental<br />
area dominated by Mytilus, its epifauna, <strong>and</strong><br />
scattered clumps <strong>of</strong> adult Mitella. The benthic algae,<br />
with the exception <strong>of</strong> Porphyra, tended to disappear<br />
due to a lack <strong>of</strong> space, while the chitons <strong>and</strong> larger<br />
limpets tended to emigrate because <strong>of</strong> an absence <strong>of</strong><br />
space <strong>and</strong> a lack <strong>of</strong> appropriate food.<br />
Interpretation <strong>of</strong> Paine's experiment must be tempered<br />
by the admission that the altered system may<br />
not have reached an equilibrium (Paine, 1966). Nevertheless,<br />
it is clear that the removal <strong>of</strong> Pisaster led to a<br />
marked decrease in diversity, despite an actual increase<br />
in the size <strong>of</strong> the st<strong>and</strong>ing crop. There was a<br />
change from a 15-species system to a trophically<br />
simpler eight-species system, <strong>and</strong> <strong>of</strong> the species that<br />
disappeared, some were <strong>and</strong> some were not in the<br />
normal diet <strong>of</strong> Pisaster. It seems, then, that the<br />
influence <strong>of</strong> Pisaster on the community is at least<br />
partly indirect; by eating masses <strong>of</strong> barnacles <strong>and</strong> the<br />
competitively dominant Mytilus, <strong>and</strong> thus keeping<br />
space open, Pisaster enhances the ability <strong>of</strong> other<br />
species to inhabit the area. When space is available,<br />
other organisms, for instance chitons, settle or move<br />
in, <strong>and</strong> form major portions <strong>of</strong> Pisaster's nutrition.<br />
Thus, in the absence <strong>of</strong> predation there is an increased
CHAPTER 7: BEYOND <strong>POPULATION</strong> <strong>ECOLOGY</strong> 219<br />
Table 7.1 Effects <strong>of</strong> density on seed mortality amongst tropical trees. All published observations <strong>and</strong> experiments known<br />
from tropical forests are included (After Connell, 1979)<br />
tendency for competition at lower trophic levels to go<br />
to completion, driving species to extinction; but by its<br />
presence, Pisaster keeps many <strong>of</strong> these populations<br />
well below their carrying-capacity. Competitive exclusion<br />
is, therefore, commonly avoided, <strong>and</strong> the diversity<br />
<strong>of</strong> the community enhanced. In short, it seems<br />
that, in the present case at least, Paine's hypothesis is<br />
correct: predation prevents competitive exclusion <strong>and</strong>,<br />
therefore, increases community diversity.<br />
In theory, predation can have an even more potent<br />
effect on species diversity when it is frequencydependent,<br />
i.e. when there is predator switching<br />
leading to a 'type 3' functional response (section<br />
5.7 -4). Prey species will then be disproportionately<br />
affected when they are common, <strong>and</strong> this should lead<br />
to a large number <strong>of</strong> rare prey species. Unfortunately,<br />
in practice, there is little positive evidence that this<br />
occurs (Connell, 1979). Nevertheless, by examining all<br />
the available data on seed <strong>and</strong> seedling mortality in<br />
tropical trees, Connell(1979) was able to show that, in<br />
many cases, there is decreased survivorship (i) when<br />
density is high (Table 7.1), <strong>and</strong> (ii) in the immediate<br />
presence <strong>of</strong> established adults (Table 7.2). Conversely,<br />
these tables also show that there were several other<br />
cases when this was not so. Overall, while it is clear<br />
that such frequency-dependent predation does occur<br />
in nature (leading, no doubt to increased diversity), it<br />
is equally clear that its occurrence is by no means the<br />
general rule.<br />
7.3.3 The role <strong>of</strong> disturbance<br />
Following Connell(1979), we shall take 'disturbance'<br />
to be the indiscriminate, catastrophic removal <strong>of</strong> all<br />
individuals from an area. As such it may take a wide<br />
variety <strong>of</strong> forms: e.g. lightning, storms, l<strong>and</strong>-slips or<br />
even indiscriminate predation. In general terms, its<br />
effect will be to prevent communities from reaching an<br />
equilibrium; parts <strong>of</strong> them, at least, will be repeatedly<br />
returned to early, colonizing stages <strong>of</strong> succession. Its<br />
more specific effect on species diversity, however, will<br />
depend on the nature <strong>of</strong> the equilibrium community<br />
itself; <strong>and</strong> this, in turn, will depend on the various<br />
processes-competition, predation <strong>and</strong> so on-also<br />
discussed in this chapter. Nevertheless, a plausible,<br />
general reationship between disturbance <strong>and</strong> diversity<br />
has been proposed by Connell(1979)-the 'intermediate<br />
disturbance hypothesis'--<strong>and</strong> the role <strong>of</strong> disturbance<br />
in determining community structure can be<br />
usefully discussed in this context.<br />
Connell recognized, essentially, three levels <strong>of</strong> disturbance<br />
(Fig. 7.9a). Where disturbances are frequent<br />
<strong>and</strong> large, the community will tend to be dominated<br />
by opportunistic, fast-colonizing species, with, perhaps,<br />
a few individuals <strong>of</strong> intermediate, secondarily<br />
colonizing species, probably present as juveniles. Such<br />
a community will have a simple structure <strong>and</strong> a low<br />
diversity (left-h<strong>and</strong> side <strong>of</strong> Fig. 7.9a). At the other<br />
extreme, where disturbances are rare <strong>and</strong> small, the<br />
diversity will depend on the importance <strong>of</strong> what<br />
Connell calls 'compensatory mechanisms', i.e. predation,<br />
resource partitioning, <strong>and</strong> so on. As we have<br />
seen, where these are prevalent diversity will be high.<br />
In their absence, however, only highly competitive,<br />
late-succession species will be able to survive, <strong>and</strong><br />
diversity will be low (right-h<strong>and</strong> side <strong>of</strong> Fig. 7.9a).<br />
Conversely, at intermediate levels <strong>of</strong> disturbance, even<br />
in the absence <strong>of</strong> compensatory mechanisms, there
220 PART 3: SYNTHESIS<br />
Table 7.2 Survivorship <strong>of</strong> seeds or seedlings either near or far from adult trees <strong>of</strong> the same species. All known published<br />
field experiments or observations in tropical forests are listed, but in some cases typical, rather than total, results are<br />
presented. (After Connell, 1979.)<br />
will probably be a few adults <strong>of</strong> fast-colonizing species,<br />
many individuals <strong>of</strong> mid-succession, secondarily colonizing<br />
species, <strong>and</strong> even some individuals, possibly<br />
juveniles, <strong>of</strong> late-succession species. Overall, therefore,<br />
diversity will be high (centre <strong>of</strong> Fig. 7.9a); in the<br />
comparative absence <strong>of</strong> compensatory mechanisms,<br />
the species diversity <strong>of</strong> communities will be highest at<br />
intermediate levels <strong>of</strong> disturbance.<br />
Some <strong>of</strong> Connell's evidence in support <strong>of</strong> this<br />
hypothesis is shown in Fig. 7.9b, where the data come<br />
from observations on a coral reef <strong>of</strong>f the coast <strong>of</strong><br />
Queensl<strong>and</strong>, Australia. Disturbance, resulting either<br />
from hurricane damage or from the effects <strong>of</strong> anchoring<br />
boats on the reef, is measured as the percentage <strong>of</strong><br />
a site that is devoid <strong>of</strong> any live coral, <strong>and</strong> it is indeed<br />
apparent that diversity (number <strong>of</strong> species per sample)<br />
is highest at intermediate levels <strong>of</strong> disturbance. As<br />
further evidence, Connell points out that even in<br />
tropical rainforests, which we tend to think <strong>of</strong> as<br />
exhibiting very high diversity, areas that are largely<br />
undisturbed (like the Bindongo forest in Ug<strong>and</strong>a) come<br />
to be dominated by a single species <strong>of</strong> tree (in this case,<br />
ironwood).<br />
Overall, therefore, we can accept that, in some<br />
cases, diversity will be highest at intermediate levels <strong>of</strong><br />
disturbance; <strong>and</strong> that generally, large frequent disturbances<br />
will tend to decrease diversity. Conversely, the<br />
effects <strong>of</strong> disturbance on diversity will be much less<br />
clear-cut whenever compensatory mechanisms are<br />
sufficiently potent to ensure that stable climax communities<br />
exhibit a high degree <strong>of</strong> diversity themselves.<br />
7.3.4 The role <strong>of</strong> instability<br />
All populations are, to a greater or lesser extent, liable<br />
to become extinct; <strong>and</strong> whenever this occurs, the<br />
structure <strong>of</strong> the community containing that population<br />
will obviously change. However, this liability is
CHAPTER 7: BEYOND <strong>POPULATION</strong> <strong>ECOLOGY</strong> 221<br />
Fig. 7.9 (a) Connell's 'intermediate<br />
disturbance' hypothesis, involving<br />
(A) opportunistic species,<br />
(B) secondarily colonizing species,<br />
<strong>and</strong> (C) climax species. (b) Data in<br />
support <strong>of</strong> the hypothesis from<br />
Heron Isl<strong>and</strong>, Queensl<strong>and</strong> from<br />
damaged (A) <strong>and</strong> undamaged (0)<br />
sites. (After Comell, 1979.)<br />
bound to be greater in some communities than others,<br />
<strong>and</strong> in this sense some communities must be more<br />
unstable than others. Yet the communities with structures<br />
conferring stability are the ones most likely to be<br />
observed, because they persist. Structural instability<br />
must, therefore, be an important determinant <strong>of</strong><br />
observed community structure.<br />
The search for what, inherently, leads to instability<br />
has been the province <strong>of</strong> theoretical ecologists, <strong>and</strong>, to<br />
paraphrase May (1979), two intertwined conclusions<br />
have emerged.<br />
1 In 'r<strong>and</strong>omly constructed' model ecosystems,<br />
an increase in the number <strong>of</strong> species in a community<br />
is associated with an increased dynamical fragility <strong>and</strong><br />
a diminished ability to withst<strong>and</strong> a given level <strong>of</strong><br />
environmental disturbance. Thus, relatively stable or
222 PART 3: SYNTHESIS<br />
predictable environments may permit fragile, speciesrich<br />
communities to exist; while relatively unstable or<br />
unpredictable environments will support only a dynamically<br />
robust, <strong>and</strong> therefore relatively simple,<br />
ecosystem.<br />
2 Real ecosystems are not assembled r<strong>and</strong>omly. They<br />
are the products <strong>of</strong> long-running evolutionary processes.<br />
We are therefore bound to ask: what special<br />
structural features <strong>of</strong> real ecosystems may help to<br />
reconcile community complexity with dynamical stability?<br />
In other words, since instability will tend to<br />
simplify communities, what observable features <strong>of</strong><br />
community structure can be deemed to exist by virtue<br />
<strong>of</strong> the stability they confer on complex, species-rich<br />
systems? The proposed 'role <strong>of</strong> instability' will then be<br />
the 'selection' <strong>of</strong> these features.<br />
Attempting to discover what these features might be<br />
has also been the province <strong>of</strong> theoretical ecologists;<br />
<strong>and</strong>, as yet, these attempts have been largely speculative.<br />
Nevertheless, there are several interesting possibilities<br />
(May, 1979). May (1 972), for instance, <strong>and</strong> Goh<br />
(1978) have suggested (from the analysis <strong>of</strong> models)<br />
that ecosystems will be more robust if they consist <strong>of</strong><br />
'loosely coupled subsystemsT. This term describes a<br />
situation in which a community consists <strong>of</strong> several<br />
parts ('subsystems'), within which there is considerable<br />
biological interaction, but between which there is<br />
very little interaction. This, according to Lawton <strong>and</strong><br />
Pimm (1 978) <strong>and</strong> Beddington <strong>and</strong> Lawton (1 978), is at<br />
least consistent with the observation that most insect<br />
herbivores are monophagous or oligophagous, giving<br />
rise to relatively discrete food chains even in speciesrich<br />
plant communities. However, empirical evidence<br />
generally fails to give positive support to the hypothesis<br />
(Pimrn & Lawton, 1980).<br />
Another feature <strong>of</strong> natural communities possibly<br />
subject to selection by instability is the length <strong>of</strong> food<br />
chains, which rarely consist <strong>of</strong> more than four or five<br />
trophic levels. The conventional explanation for this is<br />
that length is limited by the inefficiency <strong>of</strong> energy flow<br />
from one trophic level to the next (there is insufficient<br />
energy left to support the higher trophic levels). Yet, as<br />
Pirnrn <strong>and</strong> Lawton (1977) have pointed out,, this<br />
cannot, by itself, explain why food chains are about as<br />
long in the tropics (where energy input is high) as they<br />
are in the barren Arctic (where energy input is low).<br />
An alternative explanation, however, was provided by<br />
Pimm <strong>and</strong> Lawton themselves. By studying the stability<br />
properties <strong>of</strong> various Lotka-Volterra models, they<br />
argued that long food chains may typically result in<br />
population fluctuations that are too severe for top<br />
predators to exist. In other words, only relatively short<br />
food chains are sufficiently stable to be observed in<br />
natural communities.<br />
Finally, Pimm <strong>and</strong> Lawton (1978) have explored the<br />
relationship between omnivory <strong>and</strong> stability by studying<br />
model ecosystems based on Lotka-Volterra equations.<br />
Broadly speaking, they conclude that omnivory<br />
<strong>and</strong> overall dynamical stability are easier to reconcile<br />
if the omnivores <strong>and</strong> their prey are <strong>of</strong> similar size <strong>and</strong><br />
population density, a situation that most commonly<br />
pertains to insect parasitoids. As May (1978b, 1979)<br />
suggested, this may account for the diversity <strong>of</strong> insects<br />
in general <strong>and</strong> the diversity <strong>of</strong> parasitoids in particular.<br />
Overall, then, while its precise role remains largely<br />
the subject <strong>of</strong> theoretical speculation, it is quite clear<br />
that instability can play a crucial part in determining<br />
the structure <strong>of</strong> natural communities.<br />
7.3.5 The role <strong>of</strong> habitat size <strong>and</strong> diversity<br />
As Gorman (1979) has pointed out, Great Britain has<br />
44 species <strong>of</strong> indigenous terrestrial mammals, extant<br />
or recently extinct, but Irel<strong>and</strong>, just 20 miles farther<br />
into the Atlantic, has only 22; <strong>and</strong> while this might<br />
conceivably reflect the difficulties the mammals have<br />
in crossing water, it actually affects bats as much as<br />
any other group: only seven <strong>of</strong> Britain's 13 species<br />
breed in Irel<strong>and</strong>. Furthermore, <strong>of</strong> Britain's 171 species<br />
<strong>of</strong> breeding birds, only 126 are recorded as breeding in<br />
Irel<strong>and</strong>, <strong>and</strong> 24 <strong>of</strong> these do so only occasionally. For<br />
example, there are no woodpeckers in Irel<strong>and</strong> (though<br />
there are plenty <strong>of</strong> trees), no little or tawny owls, <strong>and</strong><br />
no marsh or willow tits.<br />
The most likely explanation is that Great Britain is<br />
far larger than Irel<strong>and</strong>. But size can exert its effects in<br />
two quite separate ways. Perhaps the most obvious<br />
explanation is that differences in habitat size are<br />
important because large habitats are more diverse.
CHAPTER 7: BEYOND <strong>POPULATION</strong> <strong>ECOLOGY</strong> 223<br />
Fig. 7.10 The number <strong>of</strong> amphibian <strong>and</strong> reptile species Fig. 7.11 The species area curve for the number <strong>of</strong><br />
living on oceanic West Indian isl<strong>and</strong>s <strong>of</strong> various sizes. (After flowering plants found in sample areas <strong>of</strong> Engl<strong>and</strong><br />
MacArthur & Wilson, 1967.) (Williams, 1964). (After Gorman, 1979.)<br />
But there is a second explanation that applies whenever<br />
habitats can be thought <strong>of</strong> as isl<strong>and</strong>s (either real<br />
isl<strong>and</strong>s, or 'habitat isl<strong>and</strong>s' <strong>of</strong> one type surrounded by<br />
a 'sea' <strong>of</strong> another habitat type). Larger isl<strong>and</strong>s support<br />
larger populations that have a relatively low probability<br />
<strong>of</strong> becoming extinct. In addition, larger isl<strong>and</strong>s<br />
represent a larger 'target' for colonization by species<br />
not already present (MacArthur & Wilson, 1967). On<br />
two counts, therefore, extinction <strong>and</strong> immigration, we<br />
can expect larger isl<strong>and</strong>s (i.e. larger habitats) to<br />
support more species. Note, too, that this is an<br />
explanation for the fact that (small) isl<strong>and</strong>s generally<br />
support fewer species than a nearby (larger) mainl<strong>and</strong>.<br />
A typical relationship between the number <strong>of</strong> species<br />
living on an isl<strong>and</strong> <strong>and</strong> the isl<strong>and</strong>'s area is<br />
illustrated in Fig. 7.10, for the amphibians <strong>and</strong> reptiles<br />
living on oceanic isl<strong>and</strong>s in the West Indies (Mac-<br />
Arthur & Wilson, 1967). The logarithm <strong>of</strong> species<br />
number rises with the logarithm <strong>of</strong> isl<strong>and</strong> area in a<br />
remarkably linear fashion, <strong>and</strong> the slope (0.30) is very<br />
much in line with those obtained in other examples.<br />
For organisms ranging from birds to ants to l<strong>and</strong><br />
plants, in both real <strong>and</strong> habitat isl<strong>and</strong>s, the slopes <strong>of</strong><br />
such log-log plots mostly fall within the range 0.24-<br />
0.34 (Gorman, 1979). The role <strong>of</strong> isl<strong>and</strong> (i.e. habitat)<br />
size as a determinant <strong>of</strong> species number (<strong>and</strong> thus<br />
community structure) is therefore, well established.<br />
An indication <strong>of</strong> the fact that size acts through two<br />
mechanisms, however, is provided by data in Fig. 7.1 1<br />
(Williams, 1964). This, too, is a plot <strong>of</strong> log species<br />
number against log habitat size, but size in this case<br />
pertains to arbitrary sampling areas within a mainl<strong>and</strong>.<br />
Once again, on this log-log plot, the number <strong>of</strong><br />
flowering plants rises linearly with the size <strong>of</strong> sampling<br />
areas in Engl<strong>and</strong>. But the slope-around 0.1-is noticeably<br />
lower than those from the isl<strong>and</strong> examples,<br />
<strong>and</strong> falls near the range typical for mainl<strong>and</strong> studies:<br />
0.1 2-0.17 (MacArthur & Wilson, 1967). The crucial<br />
point is that habitat size can only act via habitat<br />
diversity in such cases. These arbitrary areas are<br />
continually exchanging organisms with surrounding<br />
areas, <strong>and</strong> they are not, therefore, subject to the<br />
considerations <strong>of</strong> extinction <strong>and</strong> colonization that<br />
apply to isolated isl<strong>and</strong>s. Thus, mainl<strong>and</strong> slopes from<br />
0.12 to 0.17 reflect the effects <strong>of</strong> habitat diversity,<br />
while the increased slopes on isl<strong>and</strong>s react the additional<br />
size effects peculiar to isl<strong>and</strong> biogeography.<br />
Overall we can see that an increase in habitat size<br />
will lead to an increase in species number, <strong>and</strong> thus to<br />
an increase in the complexity <strong>of</strong> community structure.<br />
This may result from the indirect effects <strong>of</strong> habitat<br />
diversity, or from effects peculiar to the isl<strong>and</strong> nature<br />
<strong>of</strong> many habitats; <strong>and</strong> while it is <strong>of</strong>ten difficult to<br />
partition the total effect into these two components,<br />
there is no doubt that both are <strong>of</strong> very widespread<br />
importance.
224 PART 3: SYNTHESIS<br />
7.3.6 Conclusions<br />
We have seen that a variety <strong>of</strong> factors can influence<br />
community structure. Yet, in truth, it has to be<br />
admitted that precise statements as to their relative<br />
potencies must await further advances in our knowledge<br />
<strong>and</strong> underst<strong>and</strong>ing. Nevertheless, certain tentative<br />
conclusions can be drawn.<br />
Perhaps the most significant <strong>of</strong> these is that a good<br />
case can be made for the constanc&, predictability <strong>and</strong><br />
productivity <strong>of</strong> the abiotic environment being <strong>of</strong> absolutely<br />
crucial importance in determining community<br />
structure. This conclusion stems from a number <strong>of</strong><br />
considerations.<br />
1 In general terms, diverse, basically fragile ecosystems<br />
appear to be relatively stable in constant, predictable<br />
environments (section 7.3 -4).<br />
2 More specifically, niches can be stably packed more<br />
tightly in predictably productive environments (section<br />
4.15). This suggests that interspecific competition<br />
will be most potent as a mechanism promoting diversity<br />
under such circumstances (section 7.3.1).<br />
3 Equally specifically, the stable existence <strong>of</strong> top<br />
predators will be favoured in predictably productive<br />
environments (Paine, 1966). It is, therefore, in such<br />
cases that they will be most potent in keeping potential<br />
competitors below their carrying-capacities, <strong>and</strong><br />
thus promoting diversity still further (section 7.3.2).<br />
4 Finally, these other mechanisms will tend to reinforce<br />
one another. High diversity at a lower trophic<br />
level will certainly provide for niche diversification<br />
(<strong>and</strong> thus increased diversity) at the next highest<br />
trophic level; <strong>and</strong> it is possible that this will lead to an<br />
increased intensity <strong>of</strong> predation, <strong>and</strong> thus a further<br />
increase in diversity, at the lower trophic level. Small<br />
'inherent' differences in community structure are,<br />
therefore, likely to become exaggerated. Note, however,<br />
that this reinforcement will occur whatever the<br />
cause <strong>of</strong> the inherent differences. Note, too, as another<br />
aspect <strong>of</strong> this reinforcement, that those effects <strong>of</strong><br />
habitat size that are attributable to habitat diversity<br />
(section 7.3.5) will themselves be influenced by increases<br />
in the diversity <strong>of</strong> the biotic aspects <strong>of</strong> a<br />
habitat.<br />
In short, there is good reason to believe that the<br />
constancies, predictabilities <strong>and</strong> productivities <strong>of</strong> abiotic<br />
environments are crucial, underlying determinants<br />
<strong>of</strong> community structure: <strong>and</strong> that competition,<br />
predation <strong>and</strong> ecosystem instability are mechanisms<br />
through which they exert their influence. This is<br />
almost certainly the explanation for the single most<br />
important cline <strong>of</strong> increasing diversity: from the poles<br />
to the tropics.<br />
This view is opposed, to some extent, by Connell's<br />
'intermediate disturbance hypothesis' (section 7.3.3),<br />
since a constant, predictable environment is likely to<br />
be one with a low level <strong>of</strong> disturbance. Conversely,<br />
Connell's 'disturbance' requires the indiscriminate<br />
removal <strong>of</strong> species from an area, <strong>and</strong> an environment<br />
can be inconstant <strong>and</strong> unpredictable without this<br />
happening. It is, therefore, possible that this hypothesized<br />
mechanism acts independently <strong>of</strong> the other<br />
factors considered, <strong>and</strong> influences diversity in a wide<br />
range <strong>of</strong> environments. Finally, the 'isl<strong>and</strong>' effects <strong>of</strong><br />
habitat size (section 7.3.5) are likely to superimpose<br />
their influences on community structure wherever<br />
they occur; <strong>and</strong>, to the extent that all environments<br />
are patchy, they are likely to occur everywhere.<br />
To summarize, then, we know a reasonable amount<br />
about the potentialities <strong>of</strong> the various factors determining<br />
community structure, but rather less about<br />
their actual potencies <strong>and</strong> the patterns <strong>of</strong> their action<br />
in nature. Discovering the rules through which communities<br />
are constructed from populations is one <strong>of</strong><br />
the many exciting challenges that confronts population<br />
ecology today.
Abrams P. (1976) Limiting similarity <strong>and</strong> the form <strong>of</strong> the<br />
competition coefficient. Theoretical Population Biology, 8,<br />
356-75<br />
Ackert J. E., Graham G. L., Nolf L. 0. & Porter D. A. (1931)<br />
Quantitative studies on the administration <strong>of</strong> variable<br />
numbers <strong>of</strong> nematode eggs (Ascaridia lineata) to chickens.<br />
Transactions <strong>of</strong> the American Microscopical Society, 50,<br />
206-14<br />
Agricultural Research Council (1965) The Nutritional Requirements<br />
<strong>of</strong> Farm Livestock. 2. Ruminants. Agricultural Research<br />
Council, London<br />
Akinlosotu T. A. (1973) The role <strong>of</strong> Diaeretiella rapae (McIntosh)<br />
in the control <strong>of</strong> the cabbage aphid. Unpublished PhD<br />
thesis, University <strong>of</strong> London<br />
Allee W. C. (1931) Animal Aggregations. A <strong>Study</strong> in General<br />
Sociology. University <strong>of</strong> Chicago Press, Chicago<br />
Anderson R. M. (1974) Population dynamics <strong>of</strong> the cestode<br />
Caryophyllaeus laticeps (Pallas 1781) in the bream (Abramis<br />
brama L.). Journal <strong>of</strong> Animal Ecology, 43, 305-21<br />
Anderson R. M. (1979) The influence <strong>of</strong> parasitic infection on<br />
the dynamics <strong>of</strong> host population growth. In Population<br />
Dynamics (Anderson R. M., Turner B. D. & Taylor L. R.<br />
eds), pp. 245-81. Blackwell Scientific Publications, Oxford<br />
Anderson R. M. (1981) Population ecology <strong>of</strong> infectious<br />
disease agents. In Theoretical Ecology: Principles <strong>and</strong> Applications,<br />
2nd edn (R. M. May ed.), pp. 318-55. Blackwell<br />
Scientific Publications, Oxford<br />
Anderson R. M. & May R. M. (1978) Regulation <strong>and</strong> stability<br />
<strong>of</strong> host-parasite population interactions: 1. Regulatory<br />
processes. Journal <strong>of</strong> Animal Ecology, 47, 219-47<br />
Andrewartha H. G. & Birch L. C. (1954) The Distribution <strong>and</strong><br />
Abundance <strong>of</strong> <strong>Animals</strong>. University <strong>of</strong> Chicago Press, Chicago<br />
Andrewartha H. G. & Birch L. C. (1960) Some recent<br />
contributions to the study <strong>of</strong> the distribution <strong>and</strong> abundance<br />
<strong>of</strong> insects, Annual Review <strong>of</strong> Entomology, 5, 219-42<br />
Antonovics J. & Levin D. A. (1980) The ecological <strong>and</strong> genetic<br />
consequences <strong>of</strong> density-dependent regulation in plants.<br />
Annual Reviews <strong>of</strong> Ecology <strong>and</strong> Systematics, 11, 41 1-52<br />
Archer S. & Tieszen L. L. (1983) Effects <strong>of</strong> simulated grazing<br />
on foliage <strong>and</strong> root production <strong>and</strong> biomass allocation in<br />
m arctic tundra sedge (Eriophorum vaginatum). Oecologia,<br />
58.92-102<br />
Atkinson W. D. & Shorrocks B. (1981) Competition on a<br />
divided <strong>and</strong> ephemeral resource: a simulation model.<br />
Journal <strong>of</strong> Animal Ecology, 50, 461-71<br />
Auer C. (1968) Erste Ergebnisse einfacher stochasticher<br />
Modelluntersuchungen uber die Ursachen der Populations-bewegung<br />
des grauen Larchenwicklers Zeiraphera<br />
diniana, Gn. (= Z. griseana Hb). in Oberengadin 1949166.<br />
Zeitschrift fuer Angew<strong>and</strong>te Entomologie, 62, 202-35<br />
Ayala F. J., Gilpin M. E. & Ehrenfeld J. G. (1973) Competition<br />
between species: theoretical models <strong>and</strong> experimental<br />
tests. Theoretical Population Biology, 4, 331-56<br />
Bakker K. (1961) An analysis <strong>of</strong> factors which determine<br />
success in competition for food among larvae <strong>of</strong> Drosophila<br />
melanogaster. Archives Neerl<strong>and</strong>aises de Zoologie, 14, 200-81<br />
Bakker K. (1964) Backgrounds <strong>of</strong> controversies about population<br />
theories <strong>and</strong> their terminologies. Zeitschrift fuer<br />
Angew<strong>and</strong>te Entomologie, 53, 187-208<br />
Banks C. J. (1957) The behaviour <strong>of</strong> individual coccinellid<br />
larvae on plants. Animal Behaviour, 5, 12-24<br />
Baskin J. M. & Baskin C. C. (1980) Ecophysiology <strong>of</strong> secondary<br />
dormancy in seeds <strong>of</strong> Ambrosia artemisifolia. Ecology,<br />
61,475-80<br />
Baskin J. M. & Baskin C. C. (1983) Seasonal changes in the<br />
germination response <strong>of</strong> buried seeds <strong>of</strong> Arabidopsis thaliana<br />
<strong>and</strong> ecological interpretation. Botanical Gazette, 144, 540-3<br />
Beddington J. R. (1979) Harvesting <strong>and</strong> population dynamics.<br />
In Population Dynamics (Anderson R. M., Turner B. D. &<br />
Taylor L. R. eds), pp. 307-20. Blackwell Scientific Publications,<br />
Oxford<br />
Beddington J. R., Free C. A. & Lawton J. H. (1975) Dynamic<br />
complexity in predator-prey models framed in difference<br />
equations. Nature, 225, 58-60<br />
Beddington J. R., Free C. A. & Lawton J. H. (1978) Modelling<br />
biological control: on the characteristics <strong>of</strong> successful<br />
natural enemies. Nature, 273, 513-19<br />
Beddington J. R. & Lawton J. H. (1978) On the structure <strong>and</strong><br />
behaviour <strong>of</strong> ecosystems. Journal de Physique, 39(c), 5-39<br />
Begon M. (1984) Density <strong>and</strong> individual fitness: asymmetric<br />
competition. In Evolutionary Ecology (Shorrocks B., ed),<br />
pp. 175-194. Blackwell Scientific Publications, Oxford<br />
Begon M., Harper J. L. & Townsend C. R. (1990) Ecology.<br />
Individuals, Populations <strong>and</strong> Communities (2nd edn). Blackwell<br />
Scientific Publications, Oxford, 958 pp<br />
Bell A. D. & Tomlinson P. B. (1980) Adaptive architecture in<br />
rhizomatous plants. Botanical Journal <strong>of</strong> the Linnean Society,<br />
80, 125-60<br />
Bellows, T. S. & Hassell, M. P. (1988) The dynamics <strong>of</strong><br />
age-structured host-parasitoid interactions. Journal <strong>of</strong> Animal<br />
Ecology, 57, 259-68
226 REFERENCES<br />
Belsky A. J. (1986) Does herbivory benefit plants? A review <strong>of</strong><br />
the evidence. American Naturalist, 127, 870-92<br />
Bengtsson J. (1991) Interspecific competition in metapopulations.<br />
Biological Joumal <strong>of</strong> the Linnean Society, 42, 219-37<br />
Beverton R. J. H. & Holt S. J. (1957) On the dynamics <strong>of</strong><br />
exploited fish populations. Fishely Investigations, London<br />
(Series II), 19, 1-533<br />
Birkhead T. R. (1977) The effect <strong>of</strong> habitat <strong>and</strong> density on<br />
breeding success in the common guillemot (Uria aalge).<br />
Journal <strong>of</strong> Animal Ecology, 46, 751-64<br />
Blackman G. E. (1968) The applications <strong>of</strong> the concepts <strong>of</strong><br />
growth analysis to the assessment <strong>of</strong> productivity. In<br />
Functioning <strong>of</strong> Terrestrial Ecosystems at the Primaly Production<br />
Level (Eckardt F. E. ed.), pp. 243-59. Unesco, Liege<br />
Boycott A. E. (1930) A re-survey <strong>of</strong> the Freshwater Mollusca<br />
<strong>of</strong> the parish <strong>of</strong> Aldenham after ten years with special<br />
reference to the effect <strong>of</strong> drought. Transactions <strong>of</strong> the<br />
Hertfordshire Natural History Society, 19, 1-25<br />
Bradshaw A. D. (1965) Evolutionary significance <strong>of</strong> phenotypic<br />
plasticity in plants. Advances in Genetics, 13, 115-<br />
55<br />
Branch G. M. (1975) Intraspecific competition in Patella<br />
cochlear Born. Journal <strong>of</strong> Animal Ecology, 44, 263-81<br />
Brougham R. W. (1955) A study in rate <strong>of</strong> pasture growth.<br />
Australian Journal <strong>of</strong> Agricultural Research, 6, 804-12<br />
Brougham R. W. (1956) The rate <strong>of</strong> growth <strong>of</strong> short-rotation<br />
ryegrass pastures in the late autumn, winter <strong>and</strong> early<br />
spring. New Zeal<strong>and</strong> Journal <strong>of</strong> Science <strong>and</strong> Technology, A38,<br />
78-87<br />
Brown J. H. & Davidson D. W. (1977) Competition between<br />
seed-eating rodents <strong>and</strong> ants in desert ecosystems. Science,<br />
196,880-2<br />
Brown M. W. & Cameron E. A. (1979) Effects <strong>of</strong> clisparlure <strong>and</strong><br />
egg mass size on parasitism by the gypsy moth egg parasite,<br />
Ooencyrtus kuwani. Environmental Entomology, 8, 77-80<br />
Bryant J. P. (1981) Phytochemical deterrence <strong>of</strong> snowshoe<br />
hare browsing by adventitious shoots <strong>of</strong> four Alaskan trees.<br />
Science, 213, 889-90<br />
Bulmer, M. G. (1975) The statistical analysis <strong>of</strong> density<br />
dependence. Biometrics, 31, 901-1 1<br />
Burnett T. (1954) Influences <strong>of</strong> natural temperatures <strong>and</strong><br />
controlled host densities on oviposition <strong>of</strong> an insect parasite.<br />
Physiological Zoology, 27, 239-48<br />
Burnett T. (1956) Effects <strong>of</strong> natural temperatures on oviposition<br />
<strong>of</strong> various numbers <strong>of</strong> an insect parasite (Hymenoptera,<br />
Chalcididae, Tenthredinidae). Annals <strong>of</strong> the<br />
Entomological Society <strong>of</strong> America, 49, 55-9<br />
Burnett T. (1958) Dispersal <strong>of</strong> an insect parasite over a small<br />
plot. Canadian Entomologist, 90, 279-83<br />
Burrows F. M. (1991) Biomass production, structural deformation,<br />
self-thinning <strong>and</strong> thinning mechanisms in monocultures.<br />
Philosophical Transactions <strong>of</strong> the Royal Society <strong>of</strong><br />
London B, 333, 119-245<br />
Car1 E. (1971) Population control in arctic ground squirrels.<br />
Ecology, 52, 395-413<br />
Caswell H. (1989) Matrix Population Models. Sinauer Associates,<br />
New York<br />
Caughley G. & Lawton J. H. (1981) Plant-herbivore systems.<br />
In Theoretical Ecology: Principles <strong>and</strong> Applications, 2nd edn<br />
(May R.M. ed.), pp. 132-66. Blackwell Scientific Publications,<br />
Oxford<br />
Charles-Edwards P. A. (1984) On the ordered development <strong>of</strong><br />
plants 2. Self-thinning in plant communities. Annals <strong>of</strong><br />
Botany 53, 709-14<br />
Chesson P. L. & Murdoch W. W. (1986) Aggregation <strong>of</strong> risk:<br />
relationships among host-parasitoid models. American<br />
Naturalist, 127, 696-715<br />
Clark L. R. (1963) The influence <strong>of</strong> predation by Syrphus spp.<br />
on the numbers <strong>of</strong> Cardiaspina albitextura (Psyllidae). Australian<br />
Journal <strong>of</strong> Zoology, 11, 470-87<br />
Clark L. R., Geier P. W., Hughes R. D. & Morris R. F. (1967)<br />
The Ecology <strong>of</strong> Insect Populations in Theory <strong>and</strong> Practice.<br />
Methuen, London<br />
Clarke T. A. (1970) Territorial behaviour <strong>and</strong> population<br />
dynamics <strong>of</strong> a pomacentrid fish, the Garibaldi, Hypsypops<br />
rubicunda. Ecological Monographs, 40, 189-212<br />
Clements F. E., Weaver J. E. & Hanson H. C. (1929)<br />
Competition in cultivated crops. Carnegie Institute <strong>of</strong> Washington<br />
Publications, 398, 202-33<br />
Comins H. N. & Hassell M. P. (1979) The dynamics <strong>of</strong><br />
optimally foraging predators <strong>and</strong> parasitoids. Journal <strong>of</strong><br />
Animal Ecology, 48, 335-51<br />
Connell J. H. (1961) The influence <strong>of</strong> interspecific competition<br />
<strong>and</strong> other factors on the distribution <strong>of</strong> the barnacle<br />
Chthamalus stellatus. Ecology, 42, 710-23<br />
Connell J. H. (1970) A predator-prey system in the marine<br />
intertidal region. I. Balanus gl<strong>and</strong>ula <strong>and</strong> several predatory<br />
species <strong>of</strong> Thais. Ecological Monographs, 40, 49-78<br />
Connell J. H. (1971) On the role <strong>of</strong> natural enemies in<br />
preventing competitive exclusion in some marine animals<br />
<strong>and</strong> in rain forest trees. In Dynamics <strong>of</strong> Populations<br />
(den Boer P. J. & Gradwell G. R. eds), pp. 298-312. Centre<br />
for Agricultural Publishing <strong>and</strong> Documentation, Wageningen<br />
Connell J. H. (1973) Biology <strong>and</strong> Geology <strong>of</strong> Coral Reefs. Vol. 2.<br />
(Jones, 0. A. & Endean, R. eds), Academic Press, New York<br />
Connell J. H. (1979) Tropical rain forests <strong>and</strong> coral reefs as<br />
open non-equilibrium systems. In Population Dynamics<br />
(Anderson R. M., Turner B. D. & Taylor L. R. eds),<br />
pp. 141-63. Blackwell Scientific Publications, Oxford<br />
Connolly J. (1986) On difficulties with replacement series<br />
methodology in mixture experiments. Joumal <strong>of</strong> Applied<br />
Ecology, 23, 125-37<br />
Cook R. M. & Cockrell B. J. (1978) Predator ingestion rate <strong>and</strong><br />
its bearing on feeding time <strong>and</strong> the theory <strong>of</strong> optimal diets.<br />
Journal <strong>of</strong> Animal Ecology, 47, 529-48
REFERENCES 227<br />
Cousens R. (1985) A simple model relating yield loss to weed<br />
density Annals <strong>of</strong> Applied Biology, 107, 239-52<br />
Crawley, M. J. (1983) Herbivory. The Dynamics <strong>of</strong> Animal-Plant<br />
Interactions. Blackwell Scientific Publications, Oxford<br />
Crawley M. J. (1985) Reduction <strong>of</strong> oak fecundity by lowdensity<br />
herbivore populations. Nature, 314, 163-4<br />
Crawley M. J. (1989) Insect herbivores <strong>and</strong> plant population<br />
dynamics Annual Review Entomology, 34, 531-64<br />
Crawley M. J. (1993) The population dynamics <strong>of</strong> plants.<br />
Philosophical Transactions <strong>of</strong> the Royal Society <strong>of</strong> London B,<br />
330,125-40<br />
Crawley M. J. & Pacala S. (1991) Herbivores, plant parasites<br />
<strong>and</strong> plant diversity. In Parasitism: Conflict or Coexistence<br />
(T<strong>of</strong>t C. ed.), pp. 157-74. Oxford University Press, Oxford<br />
Crisp D. J. (1961) Territorial behaviour in barnacle settlement.<br />
Journal <strong>of</strong> Experimental Biology, 38, 42946<br />
Cr<strong>of</strong>ton H. D. (1971) A model <strong>of</strong> host-parasite relationships.<br />
Parasitology, 63, 343-64<br />
Crombie A. C. (1947) Interspecific competition. Journal <strong>of</strong><br />
Animal Ecology, 16, 44-73<br />
Curio E. (1976) The Ethology <strong>of</strong> Predation. Springer-Verlag,<br />
Berlin<br />
Davidson D. W. (1977a) Species diversity <strong>and</strong> community<br />
organization in desert seed-eating ants. Ecology, 58,711-24<br />
Davidson D. W. (1977b) Foraging ecology <strong>and</strong> community<br />
organization in desert seed-eating ants. Ecology. 58,<br />
725-37<br />
Davidson D. W. (1978) Size variability in the worker caste <strong>of</strong><br />
a social insect (Veromessor perg<strong>and</strong>ei Mayr) as a function <strong>of</strong><br />
the competitive environment. American Naturalist, 112,<br />
523-32<br />
Davidson J. (1938) Ori the growth <strong>of</strong> the sheep population in<br />
Tasmania. Transactions <strong>of</strong> the Royal Society <strong>of</strong> South Australia,<br />
62, 342-6<br />
Davidson J. & Andrewartha H. G. (1948a) Annual trends in a<br />
natural population <strong>of</strong> Thrips imaginis (Thysanoptera). Journal<br />
<strong>of</strong> Animal Ecology, 17, 193-9<br />
Davidson J. & Andrewartha H. G. (1948b) The influence <strong>of</strong><br />
rainfall, evaporation <strong>and</strong> atmospheric temperature on<br />
fluctuations in the size <strong>of</strong> a natural population <strong>of</strong> Thrips<br />
irnaginis (Thysanoptera). Journal <strong>of</strong> Animal Ecology, 17,<br />
200-22<br />
Davies N. B. (1977) Prey selection <strong>and</strong> social behaviour in<br />
wagtails (Aves: Motacillidae). Journal <strong>of</strong> Animal Ecology, 46,<br />
37-57<br />
Davies N. B. (1978a) Ecological questions about territorial<br />
behaviour. In Behavioural Ecology: an Evolutionary Approach<br />
(Krebs J. R. & Davies N. B. eds), pp. 317-50. Blackwell<br />
Scientific Publications, Oxford<br />
Davies N. B. (1978b) Territorial defence in the speckled wood<br />
butterfly (Pamrge aegeria), the resident always wins. Animal<br />
Behaviour, 36, 138-47<br />
Davy A. J. & Jeffries R. L. (1981) Approaches to the<br />
monitoring <strong>of</strong> rare plant populations. In The Biological<br />
Aspects <strong>of</strong> Rare Plant Conservation (Synge H. ed.), pp. 219-<br />
232. John Wiley & Sons, New York<br />
DeBach P. & Smith H. S. (1941) The effect <strong>of</strong> host density on<br />
the rate <strong>of</strong> reproduction <strong>of</strong> entomophagous parasites.<br />
Journal <strong>of</strong> Economic Entomology, 34, 741-5<br />
Dempster, J. P. (1983) The natural control <strong>of</strong> populations <strong>of</strong><br />
butterflies <strong>and</strong> moths. Biological Reviews, 58, 461-81<br />
de Wit C. T. (1960) On competition. Verslagen van L<strong>and</strong>bouwkundige<br />
Onderzoekinigen, 66, 1-82<br />
de Wit C. T., Tow P. G. & Ennik G. C. (1966) Competition<br />
between legumes <strong>and</strong> grasses. Verslagen van L<strong>and</strong>bouwkundige<br />
Onderzoekingen, 687, 3-30<br />
Diamond J. M. (1975) Assembly <strong>of</strong> species communities. In<br />
Ecology <strong>and</strong> Evolution <strong>of</strong> Communities (Cody M. L. & Diamond<br />
J. M. eds), pp. 342-444. Harvard University Press,<br />
Cambridge<br />
Diamond J. M. & May R. M. (1981) Isl<strong>and</strong> biogeography <strong>and</strong><br />
the design <strong>of</strong> nature reserves. In Theoretical Ecology: Principles<br />
<strong>and</strong> Applications. (R.M. May ed.), pp. 228-52. Blackwell<br />
Scientific Publications, Oxford<br />
Dixon A. F. G. (1971a) The role <strong>of</strong> aphids in wood formation.<br />
I. The effect <strong>of</strong> the sycamore aphid Drepanosiphum platanoides<br />
(Schr.) (Aphididae) on the growth <strong>of</strong> sycamore,<br />
Acer pseudoplatanus (L.). Journal <strong>of</strong> Applied Ecology, 8,<br />
165-79<br />
Dixon A. F. G. (1971b) The role <strong>of</strong> aphids in wood formation<br />
11. The effect <strong>of</strong> the lime aphid Eucallipterus tiliae L.<br />
(Aphididae), on the growth <strong>of</strong> the lime, Tilia X vulgaris<br />
Hayne. Journal <strong>of</strong> Applied Ecology, 8, 393-409<br />
Donald C. M. (1951) Competition among pasture plants.<br />
I Intraspecfic competition among annual pasture plants.<br />
Australian Journal <strong>of</strong> Agricultural Research, 2, 35 5-76<br />
Donald C. M. (1961) Competition for light in crops <strong>and</strong><br />
pastures. In Mechanisms in Biological Competition<br />
(Milnthorpe F. L. ed.), Symposium <strong>of</strong> the Society <strong>of</strong> Experimental<br />
Biology, No. 15, pp. 283-313<br />
Dunn E. (1977) Predation by weaseIs (Mustela nivalis) on<br />
breeding tits (Parus spp.) in relation to the density <strong>of</strong> tits<br />
<strong>and</strong> rodents, Journal <strong>of</strong> Animal Ecology, 46, 634-52<br />
Eberhardt L. (1960) Michigan Department <strong>of</strong> Conservation Game<br />
Division Report No 2282<br />
Ehler L. E. (1987) Patch-exploitation efficiency in a torymid<br />
parasite <strong>of</strong> a gall midge. Environmental Entomology, 16,<br />
198-201<br />
Elner R. W. & Hughes R. N. (1978) Energy maximisation in<br />
the diet <strong>of</strong> the shore crab. Carcinus maenas (L.). Journal <strong>of</strong><br />
Animal Ecology, 47, 103-16<br />
Ennos R. (1985) The significance <strong>of</strong> genetic variation for root<br />
growth within a natural population <strong>of</strong> white clover (Trifolium<br />
repens). Journal <strong>of</strong> Ecology, 73, 615-24
228 REFERENCES<br />
Errington P. L. (1946) Predation <strong>and</strong> vertebrate populations.<br />
Quarterly Review <strong>of</strong> Biology, 21, 144-77<br />
Erwin T. L. & Scott J. C. (1980) Seasonal <strong>and</strong> size patterns,<br />
trophic structure, <strong>and</strong> richness <strong>of</strong> Coleoptera in the tropical<br />
arboreal ecosystem: the fauna <strong>of</strong> the tree Luehea seemannii<br />
Triana <strong>and</strong> Planch in the Canal Zone <strong>of</strong> Panama. Coleopterists'<br />
Bulletin, 34, 305-22<br />
Esau K. (1953) Plant Anatomy. Wiley, New York<br />
Fenchel T. (1975) Character displacement <strong>and</strong> coexistence in<br />
mud snails (Hydrobiidae). Oecologia, 20, 19-32<br />
Fern<strong>and</strong>o M. H. J. P. (1977) Predation <strong>of</strong> the glasshouse red<br />
spider mite by Phytoseiulus persmilis A.-H. Unpublished<br />
PhD thesis, University <strong>of</strong> London<br />
Finlayson L. H. (1949) Mortality <strong>of</strong> Laemophloeus (Coleoptera.<br />
Cucujidae) infected with Mattesia dispora Naville (Protozoa,<br />
Schizogregarinaria). Parasitology, 40, 261-4<br />
Firbank L. G., Cousens R., Mortimer A. M. & Smith R. R.<br />
(1990) Effects <strong>of</strong> soil type on crop yield-weed density<br />
relationships. Joumal <strong>of</strong> Applied Ecology, 27, 308-318<br />
Firbank L. G. & Watkinson A. R. (1985) On the analysis <strong>of</strong><br />
competition within two-species mixtures <strong>of</strong> plants. Journal<br />
<strong>of</strong> Applied Ecology, 22, 503-17<br />
Firbank L. G. & Watkinson A. R. (1990) On the effects <strong>of</strong><br />
competition: from monocultures to mixtures. In Perspectives<br />
on Plant Competition (Grace J. B. & Tilman D. eds),<br />
pp. 165-92. Academic Press, San Diego<br />
Ford E. D. (1975) Competition <strong>and</strong> st<strong>and</strong> structure in some<br />
even-aged plant monocultures. Joumal <strong>of</strong> Ecology, 63,<br />
311-33<br />
Free C. A., Beddington J. R. & Lawton J. H. (1977) On the<br />
inadequacy <strong>of</strong> simple models <strong>of</strong> mutual interference for<br />
parasitism <strong>and</strong> predation. Journal <strong>of</strong> Animal Ecology, 46,<br />
543-54<br />
Fujii K. (1967) Studies on interspecies competition between<br />
the azuki bean weevil Callosobruchus chinensis <strong>and</strong> the<br />
southern cowpea weevil, C. maculatus. 11. Competition<br />
under different environmental conditions. Researches in<br />
Population Ecology, 9, 192-200<br />
Fujii K. (1968) Studies on interspecies competition between<br />
the azuki bean weevil <strong>and</strong> the southern cowpea weevil: 111,<br />
some characteristics <strong>of</strong> strains <strong>of</strong> two species. Researches in<br />
Population Ecology, 10, 87-98<br />
Garwood N. C. (1989) Tropical soil seed banks: a review. In<br />
Ecology <strong>of</strong> soil seed banks (Leck M. A., Parker V. T. & Simpson<br />
R. L. eds), pp. 149-210. Academic Press, San Diego<br />
Gaston K. J. & Lawton J. H. (1990) Effects <strong>of</strong> scale <strong>and</strong> habitat<br />
on the relationship between regional distribution <strong>and</strong> local<br />
abundance. Oikos, 58, 329-35<br />
Gatsuk, L. E., Smirnova, 0. V., Vorontzova, L. I., Zaugolnova,<br />
L. B. & Zhukova, L. A. (1980) Age states <strong>of</strong> plants <strong>of</strong> various<br />
growth forms: a review. Journal <strong>of</strong> Ecology, 68, 675-96<br />
Gause G. F. (1934) The Struggle for Existence. Williarns <strong>and</strong><br />
Wilkins, Baltimore. (Reprinted 1964, by Hafner, New<br />
York)<br />
Gill F. B. & Wolf L. L. (1975) Economics <strong>of</strong> feeding territoriality<br />
in the golden-winged sunbird. Ecology, 56, 33345<br />
Gilpin M. & Hanski I. (1991) Metapopulation Dynamics:<br />
Empirical <strong>and</strong> Theoretical Investigations. Academic Press,<br />
London<br />
Godfray H. C. J., Cook L. M. & Hassell M. P. (1991) Population<br />
dynamics, natural selection <strong>and</strong> chaos. In Genes in Ecology.<br />
(Berry R. J., Crawford T. J. & Hewitt G. M. eds), Symposium<br />
<strong>of</strong> the British Ecological Society No. 33, pp. 55-86 Blackwell<br />
Scientific Publications, Oxford<br />
Goh B. S. (1978) Robust stability concepts for ecosystem<br />
models. In Theoretical Systems Ecology (Halfon E. led.),<br />
Academic Press, New York<br />
Gold W. G. & Caldwell M. M. (1989) The effects <strong>of</strong> the spatial<br />
pattern <strong>of</strong> defoliation on regrowth <strong>of</strong> a tussock grass. I1<br />
Canopy gas exchange. Oecologia, 81, 43 7-42<br />
Goldberg D. E. (1987) Neighborhood competition in an<br />
old-field plant community. Ecology, 68, 121 1-33<br />
Goldberg D. E. (1990) Components <strong>of</strong> resource competition in<br />
plant communities. In Perspectives on Plant Competition<br />
(Grace J. B. & Tilman D. eds), pp. 27-50. Academic Press,<br />
San Diego<br />
Gorman M. L. (1979) Isl<strong>and</strong> Ecology. Chapman <strong>and</strong> Hall,<br />
London<br />
Gotelli N. J. (1991) Metapopulation models: the rescue eflkct,<br />
the propagule rain, <strong>and</strong> the core-satellite hypothesis.<br />
American Naturalist, 138, 768-76<br />
Gottleib L. D. (1984) Genetics <strong>and</strong> morphological evolution in<br />
plants. American Naturalist, 123, 681-709<br />
Griffiths K. J. (1969) Development <strong>and</strong> diapause in Pleolophus<br />
basizonus (Hymenoptera: Ichneumonidae). Canadian Entomologist,<br />
101, 907-14<br />
Grubb P. J. (1977) The maintenance <strong>of</strong> species richness in<br />
plant communities: the importance <strong>of</strong> the regeneration<br />
niche. Biological Reviews, 52, 107-45<br />
Gull<strong>and</strong> J. A. (1962) The application <strong>of</strong> mathematical models<br />
to fish populations. In The Exploitation <strong>of</strong> Natural Animal<br />
Populations (Le Cren E. D. & Holdgate M. W. eds), Symposium<br />
<strong>of</strong> the British Ecological Society No. 2, pp. 204-17.<br />
Blackwell Scientific Publications. Oxford<br />
Haines B. (1975) Impact <strong>of</strong> leaf cutting ants on vegetation<br />
development at Barro Colorado Isl<strong>and</strong>. In Tropical Ecological<br />
Systems-Trends in Terrestrial <strong>and</strong> Aquatic Research (Golley<br />
F. B. & Medina E. eds), pp. 99-111. Springer-Verlag,<br />
New York<br />
Haldane J. B. S. (1949) Disease <strong>and</strong> evolution. Symposium sui<br />
fattori ecologici e genetici della speciazone negli animali.<br />
Ric. Sci. 19 (suppl.). 3-11<br />
Hancock D. A. (1979) Population dynamics <strong>and</strong> management <strong>of</strong>
REFERENCES 229<br />
shellfish stocks. ICES Special Meeting on Population Assessment<br />
<strong>of</strong> Shellfish<br />
Hanski I. (1981) Coexistence <strong>of</strong> competitors in patchy environments<br />
with <strong>and</strong> without predation. Oikos, 37, 306-12<br />
Hanski I. (1982) Dynamics <strong>of</strong> regional distribution: the core<br />
<strong>and</strong> satellite hypothesis. Oikos, 38, 210-21<br />
Hanski I. (1987) Colonisation <strong>of</strong> ephemeral habitats. In<br />
Colonization, Succession <strong>and</strong> Stability. (Gray A. J., Crawley<br />
M. J. & Edwards P. J, eds), Symposium <strong>of</strong> the British<br />
Ecological Society No. 26, pp. 155-85. Blackwell Scientific<br />
Publications, Oxford<br />
Hanski I. (1989) Metapopulation dynamics: does it help to<br />
have more <strong>of</strong> the same? Trends in Ecology <strong>and</strong> Evolution, 4,<br />
1l3-14<br />
Hanksi I. (1990) Density dependence, regulation <strong>and</strong> variability<br />
in animal populations. Philosophical Transactions <strong>of</strong><br />
the Royal Society <strong>of</strong> London B, 330, 141-50<br />
Hmski I. (1991) Single-species metapopulation dynamics:<br />
concepts, models <strong>and</strong> observations. Biological Journal <strong>of</strong> the<br />
Linnean Society, 42, 17-38<br />
Hatnski I. & Gilpin M. (1991) Metapopulation dynamics: brief<br />
history <strong>and</strong> conceptual domain. Biological Journal <strong>of</strong> the<br />
Linnean Society, 42, 3-16<br />
Hanski I. & Kuusela S. (1977) An experiment on competition<br />
<strong>and</strong> diversity in the carrion fly community. Annales Zoologici<br />
Fennici, 43, 108-15<br />
Hanski I., Turchin P., Korpimaki E. & Henttonen H. (1993)<br />
Population oscillations <strong>of</strong> boreal rodents: regulation by<br />
mustelid predators leads to chaos. Nature, 364, 232-5<br />
Hanski I. & Woiwod I. P. (1991) Delayed density dependence<br />
Nature, 350, 28<br />
Hara T. (1988) Dynamics <strong>of</strong> size structure in plant population~.<br />
Trends in Ecology <strong>and</strong> Evolution 3, 129-33<br />
Harberd D. J. (1961) Some observations on natural clones in<br />
Festuca ovina L. New Phytologist, 60, 184-206<br />
Harcourt D. G. (1964) Population dynamics <strong>of</strong> Leptinotarsa<br />
decemlineata (Say) in eastern Ontario. 11. Population <strong>and</strong><br />
mortality estimation during six age intervals. Canadian<br />
Entomologist, 96, 1190-8<br />
Harcourt D. G. (1971) Population dynamics <strong>of</strong> Leptinotarsa<br />
decemlineata (Say) in eastern Ontario. 111. Major population<br />
processes. Canadian Entomologist, 103, 1049-61<br />
Harper J. L. (1977) The Population Biology <strong>of</strong> <strong>Plants</strong>. Academic<br />
Press, London <strong>and</strong> New York<br />
Harper J. L. (1981) The concept <strong>of</strong> population in modular<br />
organisms. In Theoretical Ecology (May R. ed.), Blackwell<br />
Scientific Publications, Oxford<br />
Harper J. L. (1985) Modules, branches <strong>and</strong> the capture <strong>of</strong><br />
resources. In Population Biology <strong>and</strong> Evolution <strong>of</strong> Clonal<br />
Organisms (Jackson J. B. C., Buss L. W. & Cook R. E. eds),<br />
pp 1-34. Yale University Press, New Haven<br />
Harper J. L. (1989) The value <strong>of</strong> a leaf. Oecologia, 80, 53-8<br />
Harper J. L. & Bell A. D. (1979) The population dynamics <strong>of</strong><br />
growth form in organisms with modular construction. In<br />
Population Dynamics (Anderson R. M., Turner B. D. &<br />
Taylor L. R. eds), pp. 29-52. Blackwell Scientific Publications,<br />
Oxford<br />
Harrison S. (1991) Local extinction in a metapopulation<br />
context: an empirical evaluation. Biological Journal <strong>of</strong> the<br />
Linnean Society, 42, 73-88<br />
Harrison S., Murphy D. D. & Ehrlich P. R. (1988) Distribution<br />
<strong>of</strong> the bay checkerspot butterfly, Euphydqas editha<br />
bayensis: evidence for a metapopulation model. American<br />
Naturalist, 132, 360-82.<br />
Hassell M. P. (1971a) Mutual interference between searching<br />
insect parasites. Journal <strong>of</strong> Animal Ecology, 40, 473-86<br />
Hassell M. P. (1971b) Parasite behaviour as a factor contributing<br />
to the stability <strong>of</strong> insect host-parasite interactions. In<br />
Dynamics <strong>of</strong> Populations, (den Boer P. J. & Gradwell G. R.<br />
eds), pp. 366-79. Centre for Agricultural Publishing <strong>and</strong><br />
Documentation, Wageningen<br />
Hassell M. P. (1975) Density-dependence in single-species<br />
populations. Journal <strong>of</strong> Animal Ecology, 44, 283-95<br />
Hassell M. P. (1976) The Dynamics <strong>of</strong> Competition <strong>and</strong> Predation.<br />
Edward Arnold, London<br />
Hassell M. P. (1978) The Dynamics <strong>of</strong> Arthropod Predator-Prey<br />
Systems. Princeton University Press, Princeton<br />
Hassell M. P. (1985) Insect natural enemies as regulating<br />
factors. Journal <strong>of</strong> Animal Ecology, 54, 323-34<br />
Hassell M. P. & Comins, H. N. (1976) Discrete time models for<br />
two-species competition. Theoretical Population Biology, 9,<br />
202-21<br />
Hassell M. P. & Comins H. N. (1978) Sigmoid functional<br />
responses <strong>and</strong> population stability. Theoretical Population<br />
Biology, 14, 62-7<br />
Hassell M. P., Latto J. & May R. M. (1989) Seeing the wood for<br />
the trees: detecting density dependence from existing<br />
life-table studies. Journal <strong>of</strong> Animal Ecology, 58, 883-92<br />
Hassell M. P., Lawton J. H. & Beddington J. R. (1977) Sigmoid<br />
functional responses by invertebrate predators <strong>and</strong> parasitoids.<br />
Journal <strong>of</strong> Animal Ecology, 46, 249-62<br />
Hassell M. P., Lawton J. H. & May R. M. (1976) Patterns <strong>of</strong><br />
dynamical behaviour in single species populations. Journal<br />
<strong>of</strong> Animal Ecology, 45, 471-86<br />
Hassell M. P. & May R. M. (1973) Stability in insect hostparasite<br />
models. Journal <strong>of</strong> Animal Ecology, 42, 693-736<br />
Hassell M. P. & May R. M. (1974) Aggregation <strong>of</strong> predators<br />
<strong>and</strong> insect parasites <strong>and</strong> its effect on stability. Journal <strong>of</strong><br />
Animal Ecology, 43, 567-94<br />
Hassell, M. P. & Pacala, S. W. (1990) Heterogeneity <strong>and</strong> the<br />
dynamics <strong>of</strong> host-parasitoid interactions. Philosophical<br />
Transactions <strong>of</strong> the Royal Society <strong>of</strong> London, B, 330, 203-20<br />
Hassell M. P., Pacala S. W., May R. M. & Chesson P. L. (1991)<br />
The persistence <strong>of</strong> host-parasitoid associations in patchy<br />
environments. I. A general criterion. American Naturalist,<br />
138, 568-83
230 REFERENCES<br />
Hassell M. P. & Rogers D. J. (1972) Insect parasite responses<br />
in the development <strong>of</strong> population models. Journal <strong>of</strong> Animal<br />
Ecology, 41, 661-76<br />
Hassell M. P., Southwood T. R. E. & Reader P. M. (1987) The<br />
dynamics <strong>of</strong> the viburnum whitefly (Aleurotrachelus<br />
jelinekii): a case study <strong>of</strong> population regulation. Journal <strong>of</strong><br />
Animal Ecology, 56, 283-300<br />
Hassell M. P. & Varley G. C. (1969) New inductive population<br />
model for insect parasites <strong>and</strong> its bearing on biological<br />
control. Nature, 223, 1133-6<br />
Hastings A., Hom C. L., Ellner S., Turchin P. & Godfray H. C.<br />
J. (1993) Chaos in ecology: is mother nature a strange<br />
attractor? Annual Review <strong>of</strong>Ecology <strong>and</strong> Systematics, 24,l-33<br />
Hatto J. & Harper J. L. (1969) The control <strong>of</strong> slugs <strong>and</strong> snails<br />
in British cropping systems, specially grassl<strong>and</strong>. International<br />
Copper Research Association Project 115(A), 1-25<br />
Heads P. A. & Lawton J. H. (1983) Studies on the natural<br />
enemy complex <strong>of</strong> the holly leaf-miner: the effect <strong>of</strong> scale<br />
on the aggregative responses <strong>and</strong> the implications for<br />
biological control. Oikos, 40, 267-76<br />
Healey M. C. (1967) Aggression <strong>and</strong> self regulation <strong>of</strong><br />
population size in deermice. Ecology, 48, 377-92<br />
Heed W. B., Starmer W. T., Mir<strong>and</strong>a M., Miller M. W. & Phaff'<br />
H. S. (1976) An analysis <strong>of</strong> the yeast flora associated with<br />
cactiphilic Drosophila <strong>and</strong> their host plants in the Sonoran<br />
Desert <strong>and</strong> its relation to temperate <strong>and</strong> tropical associations.<br />
Ecology, 57, 151-60<br />
Hodgson G. L. & Blackman G. E. (1956) An analysis <strong>of</strong> the<br />
influence <strong>of</strong> plant density on the growth <strong>of</strong> Vicia faba 1. The<br />
influence <strong>of</strong> density <strong>of</strong> the pattern <strong>of</strong> development. Journal<br />
<strong>of</strong> experimental Botany. 7, 147-65<br />
Holling C. S. (1959) Some characteristics <strong>of</strong> simple types <strong>of</strong><br />
predation <strong>and</strong> parasitism. Canadian Entomologist, 91,<br />
385-98<br />
Holling C. S. (1965) The functional response <strong>of</strong> predators to<br />
prey density <strong>and</strong> its role in mimicry <strong>and</strong> population<br />
regulation. Memoirs <strong>of</strong> the Entomological Society <strong>of</strong> Canada,<br />
45.43-60<br />
Holling C. S. (1966) The functional response <strong>of</strong> invertebrate<br />
predators to prey density. Memoirs <strong>of</strong> the Entomological<br />
Society <strong>of</strong> Canada, 48, 1-86<br />
Hoppensteadt F. C. (1982) Mathematical Methods <strong>of</strong> Population<br />
Biology. Cambridge University Press, Cambridge<br />
Horn H. S. (1971) The Adaptive Geometry <strong>of</strong> Trees. Princeton<br />
University Press, Princeton<br />
Horton K. W. (1964) Deer prefer Jack Pine. Journal <strong>of</strong>Forestry,<br />
62,497-9<br />
Hubbard S. F. (1977) Studies on the natural control <strong>of</strong> Pieris<br />
brassicae with particular reference to parasitism by Apanteles<br />
glomeratus. Unpublished D Phi1 thesis, University <strong>of</strong><br />
Oxford<br />
Huffaker C. B. (1958) Experimental studies on predation:<br />
dispersion factors <strong>and</strong> predator-prey oscillations. Hilgardia,<br />
27, 343-83<br />
Huffaker C. B. & Kennett C. E. (1959) A 10 year study <strong>of</strong><br />
vegetational changes associated with biological control <strong>of</strong><br />
Klamath weed species. Journal <strong>of</strong> Range Management, 12,<br />
69-82<br />
Huffier C. B., Shea K. P. & Herman S. G. (1963) Experirnental<br />
studies on predation. Hilgardia, 34, 305-30<br />
Hughes T. P. (1984) Population dynamics based on individual<br />
size rather than age: a general model with a reef coral<br />
example. American Naturalist, 123, 778-95<br />
Hutchings M. J. (1985) The structure <strong>of</strong> plant populations In<br />
Plant Ecology (Crawley, M. J. ed.), pp. 97-136. Blackwell<br />
Scientific Publications, Oxford<br />
Hutchinson G. E. (1957) Concluding remarks. Cold Spring<br />
Harbour Symposium on Quantitative Biology, 22, 415-2'7<br />
Iles T. D. (1973) Interaction <strong>of</strong> environment <strong>and</strong> parent stock<br />
size in determing recruitment in the Pacific sardine as<br />
revealed by analysis <strong>of</strong> density-dependent 0-group growth.<br />
Rappouts et Procesverbaux, Conseil International pour I'Explortion<br />
de la Mer, 164, 228-40<br />
Inouye D. W. (1978) Resource partitioning in bumblebees:<br />
experimental studies <strong>of</strong> foraging behaviour. Ecology, 59,<br />
672-8<br />
Ives A. R. (1991) Aggregation <strong>and</strong> coexistence in a carrion fly<br />
community. Ecological Monographs, 61, 75-94<br />
Ives A. R. (1992a) Continuous-time models <strong>of</strong> host-parasiltoid<br />
interactions. American Naturalist, 140, 1-29<br />
Ives A. R. (1992b) Density-dependent <strong>and</strong> densityindependent<br />
parasitoid aggregation in model hostparasitoid<br />
systems. American Naturalist, 140, 912-37<br />
Janzen D. H. (1966) Coevolution <strong>of</strong> mutualism between ants<br />
<strong>and</strong> acacias in Central America. Evolution, 20, 249-75<br />
Janzen D. H. (1971) Escape <strong>of</strong> juvenile Dioclea megacarpa<br />
(Leguminosae) vines from predators in a deciduous tropical<br />
forest. American Naturalist, 105, 97-112<br />
Janzen D. H. (1972a) Association <strong>of</strong> a rainforest palm <strong>and</strong><br />
seed-eating beetles in Puerto Rica. Ecology, 53, 258-61<br />
Janzen D. H. (1972b) Escape in space by Sterculia apetala<br />
seeds from the bug Dysdercus fasciatus in a Costa Kcan<br />
deciduous forest. Ecology, 53, 3 50-61<br />
Janzen D. H. (1975) Interactions <strong>of</strong> seeds <strong>and</strong> their insect<br />
predatorslparasitoids in a tropical deciduous forest. In<br />
Evolutionary Strategies <strong>of</strong> Parasitic Insects <strong>and</strong> Mites (Price<br />
P. W. ed.), pp. 154-86. Plenum, New York<br />
Jonsdottir I. S. & Callaghan T. V. (1988) Interrelationships<br />
between different generations <strong>of</strong> interconnected tillers <strong>of</strong><br />
Carex bigelowii. Oikos, 52, 120-8<br />
Jordano D. & Thomas C. D. (1992) Specificity <strong>of</strong> an =antlycaenid<br />
interaction. Oecologia, 91, 43 1-8<br />
Kaban R. & Myers J. H. (1989) Induced plant responses to<br />
herbivory. Annual Review Ecology <strong>and</strong> Systematics, 20,<br />
331-48
REFERENCES 231<br />
Kays S. & Harper J. L. (1974) The regulation <strong>of</strong> plant <strong>and</strong> tiller<br />
density in a grass sward. Journal <strong>of</strong> Ecology, 62, 97-105<br />
Keddy P. A. (1981) Experimental demography <strong>of</strong> the s<strong>and</strong><br />
dune annual Cakile edentula growing along an environmental<br />
gradient in Nova Scotia. Journal <strong>of</strong> Ecology, 69, 615-30<br />
Keith L. B. (1963) Wildlije's Ten-year Cycle. University <strong>of</strong><br />
Wisconsin Press, Madison<br />
Kira T.. Ogawa H. & Shinozaki K. (1953) Intraspecific<br />
competition among higher plants. I. Competition-densityyield<br />
interrelationships in regularly dispersed populations.<br />
Journal <strong>of</strong> the Polytechnic Institute, Osaka City University,<br />
4(4), 1-16<br />
Klomp H. (1964) Intraspecific competition <strong>and</strong> the regulation<br />
<strong>of</strong> insect numbers. Annual Review <strong>of</strong> Entomology, 9, 17-40<br />
Kluyver H. N. (1951) The population ecology <strong>of</strong> the great tit,<br />
Parus m. major L. Ardea, 38, 1-135.<br />
Konthanen P. (1950) Quantitative <strong>and</strong> seasonal studies on<br />
the leafhopper fauna <strong>of</strong> the field stratum on open areas <strong>of</strong><br />
North Karelia. Annales Zoologici Society 'Vanamo', 13, 1-91<br />
Krebs J. R. (1971) Territory <strong>and</strong> breeding density in the great<br />
tit, Parus major L. Ecology, 52, 2-22<br />
Krebs J. R. (1978) Optimal foraging: decision rules for<br />
predators. In Behavioural Ecology: an Evolutionary Approach<br />
(Krebs J. R. & Davies N. B. eds), pp. 23-63. Blackwell<br />
Scientific Publications, Oxford<br />
Krebs J. R., Kacelnik A. & Taylor P. J. (1978) Test <strong>of</strong> optimal<br />
sampling by foraging great tits. Nature, 275, 27-31<br />
Kuchlein J. H. (1966) Mutual interference among the predacious<br />
mite Typhlodromus longipilus Nesbitt (Acari, Phytoseiidae).<br />
I. Effects <strong>of</strong> predator density on oviposition rate <strong>and</strong><br />
migration tendency. Mededelingen Rijksfaculteit L<strong>and</strong>bouwwetenschappen<br />
te Gent, 31, 740-6<br />
Lack D. (1971) Ecological Isolation in Birds. Blackwell Scientific<br />
Publications, Oxford<br />
Lanciani C. A. (1975) Parasite-induced alterations in host<br />
reproduction <strong>and</strong> survival. Ecology, 56, 689-95<br />
Langer R. H. M. (1956) Growth <strong>and</strong> nutrition <strong>of</strong> timothy<br />
(Phleum pratense). The life history <strong>of</strong> individual tillers.<br />
Annals <strong>of</strong> Applied Biology, 44, 166-87<br />
Law R. (1975) Colonisation <strong>and</strong> the evolution <strong>of</strong> life histories<br />
in Poa annua. Unpublished PhD thesis, University <strong>of</strong> Liverpool<br />
Law R. (1979) Harvest optirnisation in populations with age<br />
distributions. American Naturalist, 114, 250-9<br />
Law R. & Watkinson A. R. (1987) Response-surface analysis <strong>of</strong><br />
two-species competition: an experiment on Phleum arenarium<br />
<strong>and</strong> Vulpia fasiculata. Journal <strong>of</strong> Ecology, 75, 871-86<br />
Lawrence W. H. & Rediske J. H. (1962) Fate <strong>of</strong> sown<br />
douglas-fir seed, Forest Science, 8, 211-18<br />
Lawton J. H., Beddington J. R. & Bonser R. (1974) Switching<br />
in invertebrate predators. In Ecological Stability (Usher M.<br />
B. & Williamson M. H. eds), pp. 141-58. Chapman & Hall,<br />
London<br />
Lawton J. H. & McNeill S. (1979) Between the devil <strong>and</strong> the<br />
deep blue sea: on the problem <strong>of</strong> being a herbivore. In<br />
Population Dynamics (Anderson R. M., Turner B. D. &<br />
Taylor L. R. eds), pp. 22344. Blackwell Scientific Publications,<br />
Oxford<br />
Lawton J. H. & Pimm S. L. (1978) Population dynamics <strong>and</strong><br />
the length <strong>of</strong> food chains. Nature, 272, 190<br />
Leslie P. H. (1945) On the use <strong>of</strong> matrices in certain<br />
population mathematics. Biometrika, 33, 183-212<br />
Levins R. (1968) Evolution in Changing Environments. Princeton<br />
University Press, Princeton<br />
Levins R. (1969) Some demographic <strong>and</strong> genetic consequences<br />
<strong>of</strong> environmental heterogeneity for biological control. Bulletin<br />
<strong>of</strong> the EntomologicaI Society <strong>of</strong> America, 15, 237-40<br />
Levins R. (1970) Extinction. In Some mathematical problems<br />
in biology. (Gerstenhaber M. ed.), pp. 77-107, American<br />
Mathematical Society, Providence, R.I.<br />
Lonsdale W. M. (1990) The self-thinning rule: dead or alive?<br />
Eco~o~~, 71, 1373-88<br />
Lonsdale W. M. & Watkinson A. R. (1982) Light <strong>and</strong><br />
self-thinning. New Phytologist, 90, 431-45<br />
Lotka A. J. (1925) Elements <strong>of</strong> Physical Biology. Williams &<br />
Wilhs, Baltimore<br />
Lowe V. P. W. (1969) Population dynamics <strong>of</strong> the red deer<br />
(Cervus elaphus L.) on Rhum. Journal <strong>of</strong> Animal Ecology, 38,<br />
425-57<br />
MacArthur R. H. (1965) Patterns <strong>of</strong> species diversity. Biological<br />
Reviews, 40, 1510-33<br />
MacArthur R. H. (1972) Geographical Ecology. Harper Row,<br />
New York<br />
MacArthur R. H. & Levins R. (1967) The limiting similarity,<br />
convergence <strong>and</strong> divergence <strong>of</strong> coexisting species. American<br />
Naturalist, 101, 377-85<br />
MacArthur R. H. & Pianka E. R. (1966) On optimal use <strong>of</strong> a<br />
patchy environment. American Naturalist, 100, 603-9<br />
MacArthur R. H. & Wison E. 0. (1967) The Theory <strong>of</strong> Isl<strong>and</strong><br />
Biogeography. Princeton University Press, Princeton<br />
MacLulick D. A. (1937) Fluctuations in the numbers <strong>of</strong> the<br />
varying hare (Lepus americanus). University <strong>of</strong> Toronto Studies,<br />
Biology Series, 43, 1-136<br />
Manlove, R. J. (1985) On the population ecology <strong>of</strong> Avena fatua<br />
L. Unpublished PhD thesis, University <strong>of</strong> Liverpool<br />
Marshall D. R. & Jain S. K. (1969) Interference in pure <strong>and</strong><br />
mixed populations <strong>of</strong> Avena fatua <strong>and</strong> A. barbata. Journal <strong>of</strong><br />
Ecology, 57, 251-70<br />
May R. M. (1972) Will a large complex system be stable?<br />
Nature, 238, 13-14<br />
May R. M. (1973) Stability <strong>and</strong> Complexity in Model Ecosystems.<br />
Princeton University Press, Princeton<br />
May R. M. (1974) Biological populations with nonoverlapping<br />
generations: stable points, stable cycles <strong>and</strong><br />
chaos. Science, 186, 645-7<br />
May R. M. (1975) Biological populations obeying difference
232 REFERENCES<br />
equations: stable points, stable cycles <strong>and</strong> chaos. Journal <strong>of</strong><br />
Theoretical Biology, 49, 5 11-24<br />
May R. M. (1976) Simple mathematical models with very<br />
complicated dynamics. Nature, 261, 459-67<br />
May R. M. (1977) Thresholds <strong>and</strong> breakpoints in ecosystems<br />
with a multiplicity <strong>of</strong> stable states. Nature, 269, 471-7<br />
May R. M. (1978a) Host-parasitoid systems in patchy<br />
environments: a phenomenological model. Journal <strong>of</strong> Animal<br />
Ecology, 47, 833-43<br />
May R. M. (1978b) The dynamics <strong>and</strong> diversity <strong>of</strong> insect<br />
faunas. In Diversity <strong>of</strong> Insect Faunas. (Mound L. A. & Wal<strong>of</strong>f<br />
N. eds), pp. 188-204. Blackwell Scientific Publications,<br />
Oxford<br />
May R. M. (1979) The structure <strong>and</strong> dynamics <strong>of</strong> ecological<br />
communities. In Population Dynamics (Anderson R. M.,<br />
Turner B. D. & Taylor L. R. eds), pp. 385-407. Blackwell<br />
Scientific Publications, Oxford<br />
May R. M. (1988) How many species are there on Earth?<br />
Science, 241, 1441-9<br />
May R. M. & Anderson R. M. (1978) Regulation <strong>and</strong> stability<br />
<strong>of</strong> host-parasite population interactions. 11. Destabilizing<br />
processes. Journal <strong>of</strong> Animal Ecology, 47, 249-68<br />
May R. M. & Oster G. F. (1976) Bifurcations <strong>and</strong> dynamic<br />
complexity in simple ecological models. American Naturalist,<br />
110, 573-99<br />
Maynard Smith J. (1976) Group selection. Quarterly Review <strong>of</strong><br />
Biology, 51, 277-83<br />
McClure M. S. (1977) Parasitism <strong>of</strong> the scale insect, Fiorinia<br />
externa (Hornoptera: Diaspididae) by Aspidiotiphagus citrinus<br />
(Hymenoptera: Eulophidae), in a hemlock forest: density<br />
dependence. Environmental Entomology, 6, 5 5 1-55<br />
McNaughton S. J. (1983) Physiological <strong>and</strong> ecological irnplicaitons<br />
<strong>of</strong> herbivory. Encyclopaedia <strong>of</strong> Plant Physiology:<br />
Physiological Plant Ecology 111 Responses to the chemical <strong>and</strong><br />
biological environment (Lange 0. L., Nobel P. S., Osmond<br />
C. B. & Zeigler H. eds), pp. 657-77. Springer-Verlag, Berlin<br />
McNeill S. & Southwood T. R. E. (1978) The role <strong>of</strong> nitrogen in<br />
the development <strong>of</strong> insectlplant relationships. In Biochemical<br />
Aspects <strong>of</strong> Plant <strong>and</strong> Animal Coevolution (Harborne J. B.<br />
ed.), pp. 77-98. Academic Press, London <strong>and</strong> New York<br />
Mead-Briggs A. R. & Rudge A. J. B. (1960) Breeding <strong>of</strong> the<br />
rabbit flea, Spilopsyllus cuniculi (Dale): requirement <strong>of</strong> a<br />
'factor' from a pregnant rabbit for ovarian maturation.<br />
Nature, 187, 1136-7<br />
Mertz R. W. & Boyce S. G. (1956) Age <strong>of</strong> oak 'seedlings'.<br />
Journal <strong>of</strong> Forestry, 54, 774-75<br />
Michelakis S. (1973) A study <strong>of</strong> the laboratory interaction<br />
between Coccinella septempunctata larvae <strong>and</strong> its prey<br />
Myzus persicae. Unpublished MSc thesis, University <strong>of</strong><br />
London<br />
Monro J. (1967) The exploitation <strong>and</strong> conservation <strong>of</strong> resources<br />
by populations <strong>of</strong> insects. Journal <strong>of</strong> Animal Ecology,<br />
36, 531-47<br />
Moore N. W. (1964) Intra- <strong>and</strong> interspecific competition<br />
among dragonflies. Journal <strong>of</strong> Animal Ecology, 33, 49-71<br />
Morris R. F. (1959) Single-factor analysis in population<br />
dynamics. Ecology, 40, 580-8<br />
Mortimer A. M., Sutton J. J. & Gould P. (1989) On robust<br />
weed population models. Weed Reseach, 29, 229-3 8<br />
Mueller L. D. & Ayala F. J. (1981) Dynamics <strong>of</strong> single-species<br />
population growth: stability or chaos? Ecology, 62,<br />
1148-54<br />
Murdoch W. W. (1969) Switching in general predators:<br />
experiments on predator specificity <strong>and</strong> stability <strong>of</strong> prey<br />
populations. Ecological Monographs, 39, 3 3 5-54<br />
Murdoch W. W. & Oaten A. (1975) Predation <strong>and</strong> population<br />
stability. Advances in Ecological Research, 9, 2-131<br />
Murdoch W. W. & Stewart-Oaten A. (1989) Aggregation by<br />
parasitoids <strong>and</strong> predators: effects on equilibrium <strong>and</strong><br />
stability. American Naturalist, 134, 288-310<br />
Murphy G. I. (1967) Vital statistics <strong>of</strong> the Pacific sardine<br />
(Sardinops caerulea) <strong>and</strong> the population consequences. Ecology,<br />
48, 731-6<br />
Murton R. K. (1971) The significance <strong>of</strong> a specific search<br />
image in the feeding behaviour <strong>of</strong> the wood pigeon.<br />
Behaviour, 40, 10-42<br />
Murton R. K., Westwood N. J. & Isaacson A. J. (1964) The<br />
feeding habits <strong>of</strong> the wood pigeon Columba palumbus, stock<br />
dove, C. oenas <strong>and</strong> the turtle dove, Streptopelia turtur. Ibis,<br />
106,174-88<br />
Nault A. & Gagnon D. (1993) Ramet demography <strong>of</strong> Allium<br />
tricoccum a spring ephemeral, perennial forest herb. Journal<br />
<strong>of</strong> Ecology, 81, 101-19<br />
Newsome A. E. (1969a) A population study <strong>of</strong> house-mice<br />
temporarily inhabiting a South Australian wheatfield.<br />
Journal <strong>of</strong> Animal Ecology. 38, 341-60<br />
Newsome A. E. (1969b) A population study <strong>of</strong> house-]mice<br />
permanently inhabiting a reed-bed in South Australia.<br />
Journal <strong>of</strong> Animal Ecology, 38, 361-77<br />
Nicholson A. J. (1933) The balance <strong>of</strong> animal populations.<br />
Journal <strong>of</strong> Animal Ecology, 2, 131-78<br />
Nicholson A. J. (1954a) Compensatory reactions <strong>of</strong> populations<br />
to stress, <strong>and</strong> their evolutionary significance. Australian<br />
Journal <strong>of</strong> Zoology, 2, 1-8<br />
Nicholson A. J. (1954b) An outline <strong>of</strong> the dynamics <strong>of</strong> animal<br />
populations. Australian Journal <strong>of</strong> Zoology, 2, 9-65<br />
Nicholson A. J. (1957) The Self-adjustment <strong>of</strong> Populations to<br />
Change. Cold Spring Harbour Symposium in Quantitative<br />
Biology, No. 22, pp. 153-72<br />
Nicholson A. J. (1958) Dynamics <strong>of</strong> insect populations.<br />
Annual Review <strong>of</strong> Entomology, 3, 107-36<br />
Nicholson A. J. & Bailey V. A. (1935) The balance <strong>of</strong> animal<br />
populations. Proceedings <strong>of</strong> the Zoological Society <strong>of</strong> Lorndon,<br />
3, 551-98<br />
Noyes J. S. (1974) The biology <strong>of</strong> the leek moth, Acrolepia
REFERENCES 233<br />
assectella (Zeller). Unpublished PhD thesis, University <strong>of</strong><br />
London<br />
Noy-Meir I. (1975) Stability <strong>of</strong> grazing sytems: an application<br />
<strong>of</strong> predator-prey graphs. Journal <strong>of</strong> Ecology, 63, 459-83<br />
Obeid M., Machin D. & Harper J. L. (1967) Influence <strong>of</strong><br />
density on plant to plant variations in Fiber Flax, Linum<br />
usitatissimum. Crop Science, 7, 471-3<br />
Oinonen E. (1967) The correlation between the size <strong>of</strong> Finnish<br />
bracken (Pteridium aquilinum (L.) Kuhn) clones <strong>and</strong> certain<br />
periods <strong>of</strong> site history. Acta Forestalia Fennica, 83, 1-51<br />
Osawa A. & Sugita S. (1989) The self-thinning rule: another<br />
interpretation <strong>of</strong> Weller's results. Ecology, 70, 279-83<br />
Pacala S. W. & Hassell M. P. (1991) The persistence <strong>of</strong><br />
host-parasitoid associations in patchy environments. 11.<br />
Evaluation <strong>of</strong> field data. American Naturalist, 138, 584-605<br />
Pacala S. W., Hassell M. P. & May R. M. (1990) Hostparasitoid<br />
associations in patchy environments. Nature,<br />
344,150-3<br />
Pacala S. W. & Sil<strong>and</strong>er J. A. (1985) Neighbourhood models <strong>of</strong><br />
plant population dynamics. I. Single-species models <strong>of</strong><br />
annuals. American Naturalist, 125, 385-41 1<br />
Paine R. T. (1966) Food web complexity <strong>and</strong> species diversity.<br />
American Naturalist, 100, 65-75<br />
Palrnblad I. G. (1968) Competition studies on experimental<br />
populations <strong>of</strong> weeds with emphasis on the regulation <strong>of</strong><br />
population size. Ecology, 49, 26-34<br />
Park T. (1954) Experimental studies <strong>of</strong> interspecific competition.<br />
11. Temperature, humidity <strong>and</strong> competition in two<br />
species <strong>of</strong> Tribolium. Physiological Zoology, 27, 177-238<br />
Pearl R. (1927) The growth <strong>of</strong> populations. Quarterly Review <strong>of</strong><br />
Biology, 2, 532-48<br />
Pearl R. (1928) The Rate <strong>of</strong> Living. Knopf, New York<br />
Perrins C. M. (1965) Population fluctuation <strong>and</strong> clutch-size in<br />
the great tit (Parus major L.). Journal <strong>of</strong> Animal Ecology, 34,<br />
601-47<br />
Perry J. N., Woiwod I. P. & Hanski I. (1993) Using responsesurface<br />
methodology to detect chaos in ecological time<br />
series. Oikos, 68, 329-39<br />
Pilbeam C. J., Hebblethwaite P. D., Ricketts, H. E. & Nyongesa<br />
T. E. (1991) Effects <strong>of</strong> plant population density on determinate<br />
<strong>and</strong> indeterminate growth forms <strong>of</strong> winter field beans<br />
(Vicia faba) 1. Yield <strong>and</strong> yield components. Journal <strong>of</strong><br />
Agricultural Science, 116, 3 75-84<br />
Pimentel D. (1961) On a genetic feed-back mechanism<br />
regulating populations <strong>of</strong> herbivores, parasites <strong>and</strong> predators.<br />
American Naturalist, 95, 67-79.<br />
Pimm S. L. & Lawton J. H. (1977) Number <strong>of</strong> trophic levels in<br />
ecological communities. Nature, 268, 329-3 1<br />
Pimm S. L. & Lawton J. H. (1978) On feeding on more than<br />
one trophic level. Nature, 275, 542-4<br />
Pimm S. L. & Lawton J. H. (1980) Are foodwebs divided into<br />
compartments? Journal <strong>of</strong> Animal Ecology, 49, 879-98<br />
Piper E. L. & Weiss A. (1993) Defoliation during vegetative<br />
growth <strong>of</strong> corn-the shoot-root ratio <strong>and</strong> yield implications.<br />
Field Crops Research, 31, 145-53<br />
Podoler H. & Rogers D. (1975) A new method for the<br />
identification <strong>of</strong> key factors from life-table data. Journal <strong>of</strong><br />
Animal Ecology, 44, 85-114<br />
Pollard E., Lakhani K. L. & Rothery P. (1987) The detection <strong>of</strong><br />
density dependence from a series <strong>of</strong> annual censuses.<br />
Ecology, 68, 2046-55<br />
Poole R. W. (1978) An Introduction to Quantitative Ecology.<br />
McGraw-Hill, New York<br />
Porter J. R. (1983a) A modular approach to analysis <strong>of</strong> plant<br />
growth. I. Theory <strong>and</strong> principles. New Phytologist, 94,<br />
183-90<br />
Porter J. R. (1983b) A modular approach to analysis <strong>of</strong> plant<br />
growth. 11. Methods <strong>and</strong> results. New Phytologist, 94,<br />
191-20<br />
Pratt D. M. (1943) Analysis <strong>of</strong> population development in<br />
Daphnia at different temperatures. Biological Bulletin, 85,<br />
116-40<br />
Price P. W. (1980) Evolutionary Biology <strong>of</strong> Parasites. Princeton<br />
University Press, Princeton<br />
Puckridge D. W. & Donald C. M. (1967) Competition among<br />
wheat plants sown at a wide range <strong>of</strong> densities. Australian<br />
Journal <strong>of</strong> Agricultural Research, 17, 193-211<br />
Putwain P. D. & Harper J. L. (1970) Studies on the dynamics<br />
<strong>of</strong> plant populations. 111. The influence <strong>of</strong> associated species<br />
on populations <strong>of</strong> Rumex acetosa L. <strong>and</strong> R. acetosella L. in<br />
grassl<strong>and</strong>. Journal <strong>of</strong> Ecology, 58, 251-64<br />
Radovich J. (1962) Effects <strong>of</strong> sardine spawning stock size <strong>and</strong><br />
environment on year-class production. California Department<br />
Fish <strong>and</strong> Game Bulletin, 48, 123-40<br />
R<strong>and</strong>olph S. E. (1975) Patterns <strong>of</strong> distributions <strong>of</strong> the tick<br />
Ixodes trianguliceps Birula, on its host. Journal <strong>of</strong> Animal<br />
Ecology, 44, 451-74<br />
Raup M. J. & Tallamy, D. W. (1990). Phytochemical Induction<br />
by Herbivores. John Wiley & Sons, New York<br />
Redfern M., Jones T. H. & Hassell M. P. (1992) Heterogeneity<br />
<strong>and</strong> density dependence in a field study <strong>of</strong> a tephritidparasitoid<br />
interaction. Ecological Entomology, 17, 25 5-62<br />
Rees M. & Crawley M. J. (1989) Growth, reproduction <strong>and</strong><br />
population dynamics. Functional Ecology, 3, 645-53<br />
Rice B. & Westoby M. (1988) Evidence against the hypothesis<br />
that ant dispersed seeds reach nutrient-enriched microsites.<br />
Ecology, 67, 1270-4<br />
Richards 0. W. & Wal<strong>of</strong>f N. (1954) Studies on the biology <strong>and</strong><br />
population dynamics <strong>of</strong> British grasshoppers. Anti-Locust<br />
Bulletin, 17, 1-182<br />
Richman S. (1958) The transformation <strong>of</strong> energy by Daphnia<br />
pulex. Ecological Monographs, 28, 273-91<br />
Ricker W. E. (1954) Stock <strong>and</strong> recruitment. Journal <strong>of</strong> the
234 REFERENCES<br />
Fisheries Research Board <strong>of</strong> Canada, 11, 559-623.<br />
Rigler F. H. (1961) The relation between concentration <strong>of</strong><br />
food <strong>and</strong> feeding rate <strong>of</strong> Daphnia magna Straus. Canadian<br />
Journal <strong>of</strong> Zoology, 39, 857-68<br />
Roberts E. H. (1972) Dormancy: a factor affecting seed<br />
survival in the soil. In Viability <strong>of</strong> seeds (Roberts E. H. ed.),<br />
pp. 321-59. Chapman Hall, London<br />
Roberts H. A. & Dawkins P. A. (1967) Effect <strong>of</strong> cultivation on<br />
the numbers <strong>of</strong> viable weed seeds in the soil. Weed<br />
Research, 7, 290-301<br />
Root R. B. (1967) The niche exploitation pattern <strong>of</strong> the<br />
blue-gray gnatcatcher. Ecological Monographs, 37, 317-50<br />
Rosen B. R. (1979) Modules, members <strong>and</strong> communes: a<br />
postscript introduction to social organisms. In Biology <strong>and</strong><br />
Systematics <strong>of</strong> Colonial Organisms (Larwood G. & Rosen B. R.<br />
eds), Academic Press, London<br />
Rosenzweig M. L. & MacArthur R. H. (1963) Graphical<br />
representation <strong>and</strong> stability conditions <strong>of</strong> predator-prey<br />
interactions. American Naturalist, 97, 209-23<br />
Rosewell J.. Shorrocks B. & Edwards K. (1990) Competition on<br />
a divided <strong>and</strong> ephemeral resource: testing the assumptions.<br />
I. Aggregation. Journal <strong>of</strong>Anima1 Ecology, 59, 977-1001<br />
Ross M. A. & Harper J. L. (1972) Occupation <strong>of</strong> biological<br />
space during seedling establishment. Journal <strong>of</strong> Ecology, 60,<br />
77-88<br />
Rotheray G. E. (1979) The biology <strong>and</strong> host searching<br />
behaviour <strong>of</strong> a cynipoid parasite <strong>of</strong> aphidophagous syrphid<br />
larvae. Ecological Entomology, 4, 175-82<br />
Sagar G. R. & Mortimer A. M. (1976) An approach to the<br />
study <strong>of</strong> the population dynamics <strong>of</strong> plants with special<br />
reference to weeds. Applied Biology, 1, 1-43<br />
Sarukhan J. (1980) Demographic problems in a tropical<br />
system. In Demography <strong>and</strong> Evolution in Plant Populations<br />
(Solbrig O.T. ed.), pp. 161-88. Blackwell Scientific Publications,<br />
Oxford<br />
Sarukhan J. & Gadgil M. (1974) Studies on plant demography:<br />
Ranunculus repens L., R. bulbosus L., <strong>and</strong> R. acris L. 111. A<br />
mathematical model incorporating multiple modes or reproduction.<br />
Journal <strong>of</strong> Ecology, 62, 921-36<br />
Sarukhan J. & Harper J. L. (1973) Studies on plant<br />
demography: Ranunculus repens L., R. bulbosus L., <strong>and</strong> R<br />
acris L. I. Population flux <strong>and</strong> survivorship. Journal <strong>of</strong><br />
Ecology, 61, 675-716<br />
Schaefer M. B. (1957) A study <strong>of</strong> the dynamics <strong>of</strong> the fishery for<br />
yellowfin tuna in the eastern tropical Pacific ocean. Inter-<br />
American Tropical Tuna Commission Bulletin 2, No. 6<br />
1957<br />
Schoener T. W. (1974) Resource partitioning in ecological<br />
communities. Science, 185, 27-39<br />
Searle S. R. (1966) Matrix Algebra for the Biological Sciences.<br />
John Wiley & Sons, New York<br />
Sharitz R. R. & McCormick J. F. (1973) Population dynamics<br />
<strong>of</strong> two competing annual plant species. Ecology, 54,<br />
72340<br />
Shinozaki K. & Kira T. (1956) Intraspecific competition<br />
among higher plants. VII. Logistic theory <strong>of</strong> the C-D eflrect.<br />
Journal <strong>of</strong> Institute Polytechnic <strong>of</strong> Osaka City Universitgl, 7,<br />
35-72<br />
Shorrocks B. (1970) Population fluctuations in the fruit fly<br />
(Drosophila melanogaster) maintained in the laboratory.<br />
Journal <strong>of</strong> Animal Ecology, 39, 229-53<br />
Shorrocks B. & Rosewell J. (1987) Spatial patchiness <strong>and</strong><br />
community structure: coexistence <strong>and</strong> guild size <strong>of</strong> Drosophila<br />
on ephemeral resources. In The Organization <strong>of</strong><br />
Communities: Past <strong>and</strong> Present. (Gee J. H. R. & Giller P. S.<br />
eds), Symposium <strong>of</strong> the British Ecological Society No. 27,<br />
pp. 29-51. Blackwell Scientific Publications, Oxford<br />
Shorrocks B., Rosewell J. & Edwards K. (1990) Competition<br />
on a divided <strong>and</strong> ephemeral resource. 11. Association.<br />
Journal <strong>of</strong> Animal Ecology, 59, 1003-7<br />
Sillirnan R. P. & Gutsell J. S. (1958) Experimental exploitation<br />
<strong>of</strong> fish populations. Fishery Bulletin, Fish Wildlife Service.<br />
US., 58,215-41<br />
Silvertown J. W. (1982) Introduction to Plant Population Ecology<br />
Longmans, London<br />
Silvertown J. W. & Lovett Doust J. (1993) Introduction to Plant<br />
Population Biology. Blackwell Scientific Publications, Oxford<br />
Simberl<strong>of</strong>f D. S. (1976) Experimental zoogeography <strong>of</strong> isl<strong>and</strong>s:<br />
effects <strong>of</strong> isl<strong>and</strong> size. Ecology, 57, 62948<br />
Simberl<strong>of</strong>f D. S. & Abele L. G. (1976) Isl<strong>and</strong> biogeography <strong>and</strong><br />
conservation practice. Science, 191, 285-6<br />
Sinclair A. R. E. (1975) The resource limitation <strong>of</strong> trophic<br />
levels in tropical grassl<strong>and</strong> ecosystems. Journal <strong>of</strong> Animal<br />
Ecology, 44, 497-520<br />
Siclair A. R. E. (1989) Population regulation in animals. In<br />
Ecological Concepts. (Cherrett, J. M. ed.), Symposium <strong>of</strong> the<br />
British Ecological Society, No. 29, pp. 197-241. Blackwell<br />
Scientific Publiations, Oxford<br />
Sjogren P. (1991) Extinction <strong>and</strong> isolation gradients in<br />
metapopulations: the case <strong>of</strong> the pool frog (Rana lessonae).<br />
Biological Journal <strong>of</strong>the Linnean Society, 42, 135-47<br />
Skellam J. G. (1972) Some philosophical aspects <strong>of</strong> mathematical<br />
modelling in empirical science with special reference to<br />
ecology. In Mathematical Models in Ecology. (Jeffers J. N. R.<br />
ed.), Symposium <strong>of</strong> the British Ecological Society, No. 12,<br />
pp. 13-29. Blackwell Scientific Publiations, Oxford<br />
Slade N. A. (1977) Statistical detection <strong>of</strong> density dependence<br />
from a series <strong>of</strong> sequential censuses. Ecology, 58, 1094-<br />
1102<br />
Slobodkin L. B. & Richman S. (1956) The effect <strong>of</strong> removal <strong>of</strong><br />
fixed percentages <strong>of</strong> the newborn on size <strong>and</strong> variability in<br />
populations <strong>of</strong> Daphnia pulicaria (Forbes). Limnology <strong>and</strong><br />
Oceanography, 1, 209-37<br />
Smith F. E. (1961) Density dependence in the Australian<br />
thrips. Ecology, 42, 403-7
REFERENCES 235<br />
Snaydon R. W. (1991) Replacement or additive designs for<br />
competition studies? Journal <strong>of</strong> Applied Ecology, 28, 930-46<br />
Snyman A. (1949) The influence <strong>of</strong> population densities on<br />
the development <strong>and</strong> oviposition <strong>of</strong> Plodia interpunctella<br />
Hubn. (Lepidoptera). Journal <strong>of</strong> the Entomological Society <strong>of</strong><br />
South Africa, 12, 137-71<br />
Solomon M. E. (1949) The natural control <strong>of</strong> animal population~.<br />
Journal <strong>of</strong> Animal Ecology, 18, 1-35<br />
Solomon M. E. (1964) Analysis <strong>of</strong> processes involved in the<br />
natural control <strong>of</strong> insects. Advances in Ecological Research, 2,<br />
1-58<br />
Solomon M. E. (1969) Population Dynamics. Edward Arnold,<br />
London<br />
Southern H. N. (1970) The natural control <strong>of</strong> a population <strong>of</strong><br />
tawny owls (Strix aluco). Journal <strong>of</strong> Zoology, 162, 197-285<br />
Southwood T. R. E. & Reader P. M. (1976) Population census<br />
data <strong>and</strong> key factor analysis for the viburnum whitefly,<br />
Aleurotrachelus jelinekii (Fraunenf.), on three bushes. Journal<br />
oj Animal Ecology, 45, 313-25<br />
Spitters C. J. T. (1983) An alternative approach to the analysis<br />
<strong>of</strong> mixed cropping experiments. 1. Estimation <strong>of</strong> competition<br />
coefficients. Netherl<strong>and</strong>s Journal <strong>of</strong> Agricultural Science,<br />
31,l-11<br />
Spradbery J. P. (1970) Host finding by Rhyssa persuasoria (L.),<br />
an ichneumonid parasite <strong>of</strong> siricid woodwasps. Animal<br />
Behaviour, 18, 103-14<br />
Stephens D. W. & Krebs J. R. (1986) Foraging Theory.<br />
Princeton Unversity Press, Princeton<br />
Stiling P. (1988) Density-dependent processes <strong>and</strong> key factors<br />
in insect populations. Journal <strong>of</strong> Animal Ecology, 57, 581-93<br />
Stinnson J. S. (1973) The role <strong>of</strong> territory in the ecology <strong>of</strong> the<br />
intertidal limpet Lottia gigantea (Gray). Ecology, 54,<br />
1020-30<br />
Stubbs M. (1977) Density dependence in the life-cycles <strong>of</strong><br />
animals <strong>and</strong> its importance in K- <strong>and</strong> r-strategies. Journal <strong>of</strong><br />
Animal Ecology, 46, 677-88<br />
Sugihara G. & May R. M. (1990) Nonlinear forecasting as a<br />
way <strong>of</strong> distinguishing chaos from measurement error in a<br />
time-series. Nature, 344, 73441<br />
Symonides E. (1979) The structure <strong>and</strong> population dynamics<br />
<strong>of</strong> psarnmophytes on inl<strong>and</strong> dunes. 111. Populations <strong>of</strong><br />
compact psammophyte communities. Ekologia Polska, 27,<br />
235-57<br />
Synnonides E. (1983) Population size regulation as a result <strong>of</strong><br />
intra-population interactions. I. Effect <strong>of</strong> density on survival<br />
<strong>and</strong> development <strong>of</strong> individuals <strong>of</strong> Erophila verna (L.)<br />
C.A.M. Ekologia Polska, 31, 839-82<br />
Takahashi F. (1968) Functional response to host density in a<br />
parasitic wasp, with reference to population regulation.<br />
Researches in Population Ecology, 10, 54-68<br />
Tamm C. 0. (1956) Further observations on the survival <strong>and</strong><br />
flowering <strong>of</strong> some perennial herbs. Oikos, 7, 274-92<br />
Taylor A. D. (1993) Heterogeneity in host-parasitoid<br />
interactions: the 'aggregation <strong>of</strong> risk' <strong>and</strong> the 'CV2 > 1<br />
rule'. Trends in Ecology <strong>and</strong> Evolution, 8, 400-5<br />
Taylor L. R. (1986) Synoptic dynamics, migration <strong>and</strong> the<br />
Rotharnstead Insect Survey. Journal <strong>of</strong> Animal Ecology, 55,<br />
1-38<br />
Thomas C. D. & Harrison S. (1992) Spatial dynamics <strong>of</strong> a<br />
patchily distributed butterfly species. Journal <strong>of</strong> Animal<br />
ECO~O~Y, 61, 437-46<br />
Thomas W. R., Pomerantz M. J. & Gilpin M. E. (1980) Chaos,<br />
asymmetric growth <strong>and</strong> group selection for dynamical<br />
stability. Ecology, 61, l3 12-20<br />
Thompson D. J. (1975) Towards a predator-prey model<br />
incorporating age-structure: the effects <strong>of</strong> predator <strong>and</strong><br />
prey size on the predation <strong>of</strong> Daphnia magna by Ischnura<br />
elegans. Journal <strong>of</strong> Animal Ecology, 44, 907-16<br />
Thompson K. & Grime J. P. (1979) Seasonal variation in the<br />
seed banks <strong>of</strong> herbaceous species in ten contrasting habitats.<br />
Journal <strong>of</strong> Ecology, 67, 893-921<br />
Tilman D. (19 76) Ecological competition between algae.<br />
Experimental confirmation <strong>of</strong> resource-based competition<br />
theory. Science, 192, 463-5<br />
Than D. (1977) Resource competition between planktonic<br />
algae: an exprimental <strong>and</strong> theoretical approach. Ecology,<br />
58,338-48<br />
Tilman D. (1980) Resources: a graphical-mechanistic approach<br />
to competition <strong>and</strong> predation. American Naturalist,<br />
116,362-93<br />
Than D. (1982) Resource Competition <strong>and</strong> Community Structure.<br />
Princeton University Press, Princeton<br />
Tilman D., Kilham S. S. & Kilham P. (1982) Phytoplankton<br />
community ecology: the role <strong>of</strong> limiting nutrients. Annual<br />
Reviews <strong>of</strong> Ecology <strong>and</strong> Systematics 13, 349-72<br />
Tinbergen L. (1960) The natural control <strong>of</strong> insects in pinewoods.<br />
1: Factors influencing the intensity <strong>of</strong> predation by<br />
songbirds. Archives Neerl<strong>and</strong>aises de Zoologie 13, 266-336<br />
Turchin P. (1990) Rarity <strong>of</strong> density dependence or population<br />
regulation with lags? Nature, 344, 660-3<br />
Turchin P. & Taylor A. D. (1992) Complex dynamics in<br />
ecological time series. Ecology, 73, 289-305.<br />
Turnbull A. L. (1962) Quantitative studies <strong>of</strong> the food <strong>of</strong><br />
Linyphia triangularis Clerck (Aranaea: Linyphiidae). Canadian<br />
Entomologist, 94, 1233-49<br />
Turnbull A. L. (1964) The searching for prey by a webbuilding<br />
spider Archaeranea tepidariorum (C. L. Kock). C<strong>and</strong>aian<br />
Entomologist, 96, 568-79<br />
Tybjerg H. & Vestergaard P. (1992) Growth dynamics in the<br />
rhizomatous herb Polygonatum verticillatum Oikos, 65, 395-<br />
408<br />
Ullyett G. C. (1949a) Distribution <strong>of</strong> progeny by Chelonus<br />
texanus Cress. (Hymenoptera: Braconidae). Canadian Entomologist,<br />
81, 25-44
236 REFERENCES<br />
Ullyett G. C. (1949b) Distribution <strong>of</strong> progeny by Cryptus<br />
inornatus Pratt (Hymenoptera: Ichneumonidae). Canadian<br />
Entomologist, 81, 285-99<br />
Uranov A. A. (1975) Age spectrum <strong>of</strong> the phytocoenopopulation<br />
as a function <strong>of</strong> time <strong>and</strong> energetic wave processes.<br />
Biologicheskie Nauki, 2, 7-34<br />
Usher M. B. (1972) Developments in the Leslie matrix model.<br />
In: Mathematical Models in Ecology (Jeffers J. N. R. ed.),<br />
Symposium <strong>of</strong> the British Ecological Society, No. 12,<br />
pp. 29-60. Blackwell Scientific Publications, Oxford<br />
Usher M. B. (1974) Biological Management <strong>and</strong> Conservation.<br />
Chapman & Hall, London<br />
Usher M. B., Longstaff B. C. & Southall D. R. (1971) Studies<br />
on populations <strong>of</strong> Folsomia c<strong>and</strong>ida (Insecta: Collembola):<br />
the productivity <strong>of</strong> population in relation to food <strong>and</strong><br />
exploitation. Oecologia, 7, 68-79<br />
Utida S. (1950) On the equilibrium state <strong>of</strong> the interacting<br />
population <strong>of</strong> an insect <strong>and</strong> its parasite. Ecology, 31,<br />
165-75<br />
Utida S. (1957) Cyclic fluctuations <strong>of</strong> population density<br />
intrinsic to the host parasite system. Ecology, 38, 442-9<br />
Utida S. (1967) Damped oscillation <strong>of</strong> population density at<br />
equilibrium. Researches in Population Ecology, 9, 1-9<br />
Vance R. R. (1972a) Competition <strong>and</strong> mechanism <strong>of</strong> coexistence<br />
in three syrnpatric species <strong>of</strong> intertidal hermit crabs.<br />
Ecology, 53, 1062-74<br />
Vance R. R. (1972b) The role <strong>of</strong> shell adequacy in behavioural<br />
interactions involving hermit crabs. Ecology, 53, 1075-83<br />
V<strong>and</strong>ermeer J. H. (1972) Niche theory. Annual Review <strong>of</strong><br />
Ecology <strong>and</strong> Systematics, 3, 107-32<br />
V<strong>and</strong>ermeer J. H. (1989) Ecology <strong>of</strong> Intercropping. Cambridge<br />
University Press, Cambridge<br />
van der Meijden E. (1971) Senecio <strong>and</strong> Tyrio (Callimorpha) in a<br />
Dutch dune area. A study on an interaction between a<br />
monophagous consumer <strong>and</strong> its host plant. Proceedings <strong>of</strong><br />
the Advanced <strong>Study</strong> Institute on 'Dynamics <strong>of</strong> Numbers in<br />
Populations' (den Boer P. J. & Gradwell G. R. eds). Pudoc,<br />
Wageningen<br />
Varley G. C. (1947) The natural control <strong>of</strong> population balance<br />
in the knapweed gall-fly (Urophora jaceana). Journal <strong>of</strong><br />
Animal Ecology, 16, 139-87<br />
Varley G. C. & Gradwell G. R. (1960) Key factors in population<br />
studies. Journal <strong>of</strong> Animal Ecology, 29, 399-401<br />
Varley G. C. & Gradwell G. R. (1963) The interpretation <strong>of</strong><br />
insect population changes. Proceedings <strong>of</strong> the Ceylon Association<br />
for the Advancement <strong>of</strong> Science, 18, 142-56<br />
Varley G. C. & Gradwell G. R. (1970) Recent advances in<br />
insect population dynamics. Annual Review <strong>of</strong> Entomology,<br />
15,l-24<br />
Varley G. C., Gradwell G. R. & Hassell M. P. (1975) Insect<br />
Population Ecology. Blackwell Scientific Publications, Oxford<br />
Vickery W. L. & Nudds T. D. (1984) Detection <strong>of</strong> density<br />
dependent effects in annual duck censuses. Ecology, 65,<br />
96-104<br />
Vickery W. L. & Nudds T. D. (1991) Testing for densitydependent<br />
effects in sequential censuses. Oecologia, 85,<br />
419-23<br />
Volterra V. (1926) Variations <strong>and</strong> fluctuations <strong>of</strong> the numbers<br />
<strong>of</strong> individuals in animal species living together. (Reprinted,<br />
1931, in R. N. Chapman. Animal Ecology, McGraw-Hill,<br />
New York)<br />
Watkinson A. R. (1980) Density-dependence in single species<br />
populations <strong>of</strong> plants. Journal <strong>of</strong> Theoretical Biology, 83,<br />
345-57<br />
Watkinson A. R. (1981) Interference in pure <strong>and</strong> mixed<br />
populations <strong>of</strong> Agrostemma githago. Journal <strong>of</strong> Applied Ecology,<br />
18, 967-76.<br />
Watkinson A. R. (1983) Factors affecting the density response<br />
<strong>of</strong> Vulpia fasiculata. Journal <strong>of</strong> Ecology, 70, 149-61<br />
Watkinson A. R. (1984) Yield-density relationships: the<br />
influence <strong>of</strong> resource availability on growth <strong>and</strong> selfthinning<br />
in populations <strong>of</strong> Vulpia fasiculata. Annals <strong>of</strong><br />
Botany, 53, 469-82<br />
Watkinson A. R. (1985) On the abundance <strong>of</strong> plants along an<br />
environmental gradient, Journal <strong>of</strong> Ecology, 73, 569-78<br />
Watkinson A. R. & Harper J. L. (1978) The demography <strong>of</strong> a<br />
s<strong>and</strong> dune annual Vulpia fasiculata: I. The natural regulation<br />
<strong>of</strong> populations. Journal <strong>of</strong> Ecology, 66, 15-33<br />
Watkinson A. R. & White J. (1985). Some life history<br />
consequences <strong>of</strong> modular construction in plants. Philosophical<br />
Transactions <strong>of</strong> the Royal Society <strong>of</strong> London B, 313,<br />
31-51<br />
Watson A. (1967) Territory <strong>and</strong> population regulation in the<br />
red grouse. Nature, 215, 1274-5<br />
Watson D. (1987) Aspects <strong>of</strong> the population ecology <strong>of</strong> Senecio<br />
vulgaris L. Unpublished PhD thesis, University <strong>of</strong> Liverpool<br />
Watt K. E. F. (1968) Ecology <strong>and</strong> Resource Management.<br />
McGraw-Hill, New York<br />
Way M. J. & Cammell M. (1970) Aggregation behaviour in<br />
relation to food utilization by aphids. In Animal Populaltions<br />
in Relation to their Food Resources (Watson A. ed.), pp. 2!29-<br />
47. Blackwell Scientific Publications, Oxford<br />
Weiner J. (1993) Competition, herbivory <strong>and</strong> plant size<br />
variability: Hypochaeris radiacata grazed by snails (Helix<br />
aspersa). Functional Ecoloy, 7, 47-53<br />
Weir D. A. (1985) The population ecology <strong>and</strong> clonal structure<br />
<strong>of</strong> two grasses. Unpublished PhD thesis, University <strong>of</strong><br />
Liverpool.<br />
Weller D. E. (1990) Will the real self-thinning rule please<br />
st<strong>and</strong> up? A reply to Osawa & Sugita. Ecology, 71, 1204-7<br />
Werner P. A. (1979) Competition <strong>and</strong> coexistence <strong>of</strong> similar<br />
species. In Topics in Plant Population Biology. (Solbrig 0. T.,<br />
Jain S., Johnson G. B. & Raven P. H. eds), pp. 287-310.<br />
Macmillan, London
REFERENCES 237<br />
Werrner P. A. & Platt W. W. (1976) Ecological relationships <strong>of</strong><br />
CO-occurring golden rods (Solidago: Compositae). American<br />
Naturalist, 110, 959-71<br />
Westley L. C. (1993) The effect <strong>of</strong> inflorescence bud removal<br />
on tuber production in Helianthus tuberosus L. (Asteraceae).<br />
Ecology, 74, 2136-44<br />
Westoby M. (1984) The self-thinning rule. Advances in Ecological<br />
Research, 14, 167-225<br />
White J. (1980) Demographic factors in populations <strong>of</strong> plants.<br />
In Demography <strong>and</strong> Evolution in Plant Populations, (Solbrig<br />
0. T. ed.), pp. 21-48. Blackwell Scientific Publications,<br />
Oxford<br />
White J. (1985) The thinning rule <strong>and</strong> its application to<br />
mixtures <strong>of</strong> plant populations. In Studies on Plant Demography<br />
(White J. ed), pp. 291-309. Academic Press, London<br />
White T. C. R (1978) The importance <strong>of</strong> a relative shortage <strong>of</strong><br />
food in animal ecology. Oecologia, 33, 71-86.<br />
Whitham T. G. & Mopper, S. (1985) Chronic herbivory: impacts<br />
on architecture <strong>and</strong> sex expression on pinyon pine.<br />
Science, 228, 1089-91<br />
Whittaker J. B. (1979) Invertebrate grazing, competition <strong>and</strong><br />
plant dynamics. In Population Dynamics. (Anderson R. M.,<br />
Turner B. D. & Taylor L. R. eds), pp. 207-22. Blackwell<br />
Scientific Publications, Oxford<br />
Willey R. W. & Heath S. B. (1969) The quantitative relationships<br />
between plant population <strong>and</strong> crop yield. Advances in<br />
Agronomy, 21, 281-321<br />
Williams A. G. & Whitham T. G. (1986) Premature leaf<br />
abscission: an induced plant defense against gall aphids.<br />
Ecology, 67, 1619-27<br />
Williams C. B. (1964) Patterns in the Balance <strong>of</strong> Nature <strong>and</strong><br />
Related Problems in Quantitative Ecology. Academic Press,<br />
New York<br />
Williamson M. (1972) Analysis <strong>of</strong> Biological Populations. Edward<br />
Arnold, London<br />
Williamson M. (1981) Isl<strong>and</strong> Populations. Oxford University<br />
Press, Oxford<br />
Wilson D. E. & Janzen D. H. (1972) Predation on Scheelea<br />
palm seeds by bruchid beetles: seed density <strong>and</strong> distance<br />
from the parent palm. Ecology, 53, 954-9<br />
Woiwod I. P. & Hanski, I. (1992) Patterns <strong>of</strong> density dependence<br />
in moths <strong>and</strong> aphids. Journal <strong>of</strong> Animal Ecology, 61,<br />
619-29<br />
Wolf L. L. (1969) Female territoriality in a tropical hummingbird.<br />
Auk, 86, 490-504.<br />
Wynne-Edwards V. C. (1962) Animal Dispersion in Relation to<br />
Social Behaviour. Oliver & Boyd, Edinburgh<br />
Wynne-Edwards V. C. (1977) Intrinsic population control <strong>and</strong><br />
introduction. In Population Control by Social Behaviour<br />
(Ebling F. J. & Stoddart D. M. eds), pp. 1-22. Institute <strong>of</strong><br />
Biology, London<br />
Yoda K., Kira T., Ogawa H. & Hozumi K. (1963) Self thinning<br />
in overcrowded pure st<strong>and</strong>s under cultivated <strong>and</strong> natural<br />
conditions. Journal <strong>of</strong> Biology, Osaka City University, 14,<br />
107-29<br />
Yodzis P. (1989) Introduction to Theoretical Ecology. Harper &<br />
Row, New York<br />
Zeide B. (1987) Analysis <strong>of</strong> the - 3/2 power law <strong>of</strong> selfthinning.<br />
Forest Science, 33, 5 17-3 7
This page intentionally left blank
Page numbers in italic are in the<br />
references<br />
Abele, L.G., 215, 234<br />
Abrarns, P,, 113, 114, 225<br />
Ackert, J.E., 146, 225<br />
Akinlosotu, T.A., 140, 225<br />
AUee, W.C., 51, 225<br />
Anderson, R.M., 137, 138, 146, 150,<br />
164,225,232<br />
Andrewartha, H.G., 178, 179, 180,<br />
210,225,227<br />
Archer, S., 130, 225<br />
Atkinson, W.D., 114, 225<br />
Auer, C., 65, 225<br />
Ayala, F.J., 109-10, 207, 225, 232<br />
Bailey, V.A., 150, 232<br />
Bakker, K., 50, 177, 225<br />
Banks, C.J., 142, 225<br />
Baskin, C.C., 26, 225<br />
Baskin, J.M., 26, 225<br />
Beddington, J.R., 151, 152, 165, 169,<br />
174,222,225<br />
Begon, M., 42, 90, 225<br />
Bell, A.D., 21, 23, 24, 225, 229<br />
Bellows, T.S., 208, 225<br />
Belsky, A.J., 130, 226<br />
Bengtsson, J., 212, 226<br />
Beverton, R.J.H., 167, 226<br />
Birch, L.C., 178, 179, 210, 225<br />
Birkhead, T.R., 50-1, 226<br />
Blackman, G.E., 40, 160, 226, 230<br />
Boyce, S.G., 11, 232<br />
Boycott, A.E., 211, 226<br />
Bradshaw, A.D., 40, 226<br />
Branch, G.M., 48-9,226<br />
Brougham, R.W., 161, 226<br />
Brown, J.H., 78-80, 128, 226<br />
Brown, M.W., 158,226<br />
Bryant, J.P., 128, 226<br />
Bulmer, M.G., 186, 188, 190, 226<br />
Burnett, T., 145, 151, 226<br />
Burrows, F.M., 47, 226<br />
Caldwell, MM., 130, 228<br />
Callaghan, T.V., 23, 230<br />
Cameron. E.A., 158. 226<br />
Carnrnell, M., 139,236<br />
Carl, E., 202, 226<br />
Caswell, H., 72, 226<br />
Caughley, G., 150, 226<br />
Charles-Edwards, P.A., 48, 226<br />
Chesson, P.L., 156, 226<br />
CIark, L.R., 118, 142, 177, 226<br />
Clarke, T.A., 202, 226<br />
Cockrell, B.J., 148-9, 226<br />
Comins, H.N., 110, 112, 149, 153,<br />
154,226,229<br />
Connell, J.H., 11, 92, 94, 138,<br />
219-20,221,226<br />
Connolly, J., 88-9, 226<br />
Cook, R.M., 148-9,226<br />
Cousens, R., 110, 226<br />
Crawley, M.J., 128, 129, 130, 131,<br />
205,226-7,233<br />
Crisp, D.J., 202, 227<br />
Cr<strong>of</strong>ton, H.D., 150, 227<br />
Crombie, A.C., 92, 93, 227<br />
Curio, E., 142, 227<br />
Davidson, D.W., 78-83, 98, 128, 226,<br />
22 7<br />
Davidson, J., 62, 63, 178, 179, 180,<br />
22 7<br />
Davies, N.B., 120, 201, 202, 227<br />
Davy, A.J., 3, 227<br />
Dawkins, P.A., 27, 233<br />
DeBach, P., 152, 227<br />
Dempster, J.P., 186, 188, 227<br />
de Wit, C.T., 84, 88, 227<br />
Diamond, J.M., 95-6, 214, 227<br />
Dixon, A.F.G., 130, 227<br />
Donald, C.M., 40, 42, 160, 233<br />
Dunn, E., 203, 227<br />
Eberhardt, L., 20, 227<br />
Ehler, L.E., 158, 227<br />
Elner, R.W., 120, 227<br />
Ennos, R., 102, 227<br />
Errington, P.L., 125, 227<br />
Erwin, T.L., 215, 227<br />
Esau, K., 21,227<br />
Fenchel, T., 98, 99, 227<br />
Fern<strong>and</strong>o, M.H.J.P., 145, 227<br />
Finlayson, L.H., 118, 228<br />
Firbank, L.G., 48, 85, 89, 110, 205,<br />
228<br />
Ford, E.D., 42, 45, 228<br />
Free, C.A., 146, 147, 228<br />
Fujii, K., 64, 228<br />
Gadgl, M., 12-13,234<br />
Gagnon, D., 23, 232<br />
Garwood, N.C., 27, 228<br />
Gaston, K.J., 212, 228<br />
Gatsuk, L.E., 11, 228<br />
Gause, G.F., 108, 228<br />
Gill, F.B., 203, 228<br />
Gilpin, M., 210, 212, 214, 228, 229<br />
Godfray, H.C.J., 209, 228<br />
Goh, B.S., 222, 228<br />
Goldberg, D.E., 84, 89, 228<br />
Gold. W.G., 130. 228<br />
Gorman, M.L., 222, 223,228<br />
Gotelli, N.J., 214, 228<br />
Gottleib, L.D., 21, -228<br />
Gradwell, G.R., 15, 181, 183, 184,<br />
236<br />
Griffiths, K.J., 134, 136, 228<br />
Grime, J.P., 26, 235<br />
Gmbb, P.J., 102, 104, 228<br />
Gull<strong>and</strong>, J.A., 167, 228<br />
Gutsell, J.S., 172, 173, 234<br />
Haines, B., 129, 228<br />
Haldane, J.B.S., 15, 228<br />
Hancock, D.A., 169, 228<br />
Hanski, I., 114, 115, 189, 190, 209,<br />
210, 211, 212, 214, 215, 228, 229,<br />
23 7<br />
Hara, T., 48, 229<br />
Harberd, D.J., 200, 229<br />
Harcourt, D.G., 181-6, 229<br />
Harper, J.L., 13, 21, 23, 24, 26, 39,<br />
42, 44, 45, 46, 68, 77, 101, 131,<br />
133,192-3,199, 200, 201, 203,<br />
203-4, 205,206,216-17,229,<br />
230,233,234,236<br />
Harrison, S., 212, 213, 214, 215,<br />
229,235<br />
Hassell, M.P., 64, 65, 110, 112, 119,<br />
131, 134, 136, 138, 140, 142, 143,<br />
145, 146, 147, 149, 150, 151,<br />
152-8,187,188,206, 208, 209,<br />
226,229
240 AUTHOR INDEX<br />
Hastings, A., 209, 229<br />
Hatto, J., 133, 229<br />
Heads, P.A., 188, 230<br />
Healey, M.C., 202, 230<br />
Heath, S.B., 38, 56, 237<br />
Heed, W.B., 121, 230<br />
Hodgson, G.L., 40, 230<br />
Holling, C.S., 133, 136, 230<br />
Holt, S.J., 167, 226<br />
Hoppensteadt, F.C., 65, 230<br />
Horn, H.S., 22, 230<br />
Horton, K.W., 122,123, 230<br />
Hubbard, S.F., 141, 230<br />
Huffaker, C.B., 118, 143, 230<br />
Hughes, R.N., 120, 227<br />
Hughes, T.P., 11, 12, 230<br />
Hutchinson, G.E., 91, 230<br />
Iles, T.D., 170, 230<br />
Inouye. D.W., 94, 230<br />
Ives, A.R., 115. 159, 160, 230<br />
Jain, S.K., 85-7, 110, 231<br />
Janzen, D.H., 77-8, 220, 230<br />
Jeffries, R.L., 3, 227<br />
Jonsdottir, I.S., 23, 230<br />
Jordano, D.. 212, 230<br />
Kaban, R., 128, 230<br />
Kays, S., 13, 45, 46, 230<br />
Keddy,P.A., 193, 195, 196, 230<br />
Keith, L.B., 164, 230<br />
Kennett, C.E., 118, 230<br />
Kira, T., 36, 39, 46, 230, 234<br />
Klomp, H., 177, 230<br />
Kluyver, H.N., 63, 231<br />
Kontkanen, P,, 211, 231<br />
Krebs, J.R., 120, 140, 148, 201, 203,<br />
23 1<br />
Kuchlein, J.H., 144, 231<br />
Kuusela, S., 115, 229<br />
Lack, D., 99-100, 231<br />
Lanciani, C.A., 126, 231<br />
Langer, R.H.M., 25, 231<br />
Law, R., 14-16, 72-4, 87-8.111,<br />
174,231<br />
Lawrence, W.H., 127, 231<br />
Lawton, J.H., 121, 123, 132-3, 150,<br />
188, 212, 222, 225, 226, 228, 230,<br />
231,233,237<br />
Leslie, P.H., 70, 231<br />
Levin. D.A.. 231<br />
Levins, R., 52, 98, 112, 210, 211,<br />
23 1<br />
Lonsdale, W.M., 47-8,231<br />
Lotka, A.J., 105, 149, 231<br />
Lovett Doust, J., 85, 205, 234<br />
Lowe, V.P.W., 17-19, 231<br />
MacArthur, R.H., 95, 98, 112-13,<br />
121-2,149, 210,214,223,231,<br />
234<br />
MacLulick, D.A., 4, 118, 231<br />
McClure, MS., 158, 232<br />
McConnick, J.F., 102-3, 234<br />
McNaughton, S.J., 128, 232<br />
McNeil, S., 121, 132-3, 164, 231,<br />
232<br />
Manlove, R.J., 198, 199, 231<br />
Marshall, D.R., 85-7, 110, 231<br />
May, R.M., 60-1,112-14,138, 146,<br />
150, 154, 155, 160, 165, 205, 208,<br />
209, 214, 215, 221, 222, 225, 227,<br />
231,232,235<br />
Maynard Smith, J., 202, 232<br />
Mead-Briggs, A.R., 124, 232<br />
Mertz, R.W.. 11, 232<br />
Michelakis, S., 145, 232<br />
Monro, J., 140, 141, 232<br />
Moore, N.W., 202, 232<br />
Mopper, S., 128, 237<br />
Morris, R.F., 181, 183, 232<br />
Mortimer, A.M., 5, 26, 112, 234<br />
Mueller, L.D., 207, 232<br />
Murdoch, W.W., 122-4, 144, 153,<br />
155,156,160, 226, 232<br />
Murphy, G.I., 168, 232<br />
Murton, R.K., 124, 232<br />
Myers, J.H., 128, 230<br />
Nault, A., 23, 232<br />
Newsome, A.E., 118, 232<br />
Nicholson, A.J., 31, 64, 150, 165-6,<br />
177,180,232<br />
Noy-Meir, I., 150, 160, 161, 163, 232<br />
Noyes, J.S., 141, 145, 232<br />
Nudds, T.D., 184, 186, 236<br />
Oaten, A., 122-4, 144, 153, 155, 232<br />
Obeid, M,, 42, 44, 232<br />
Oinonen, E., 200, 232<br />
Osawa, A., 48, 232<br />
Oster, G.F., 205, 232<br />
Pacala, S.W., 131, 156, 157, 205,<br />
227,229,233<br />
Paine, R.T., 217, 218, 233<br />
Palmblad, I.G., 33-6, 64, 233<br />
Park, T., 92, 95, 233<br />
Pearl, R., 18-20, 62, 233<br />
Perrins, C.M., 9, 233<br />
Perry, J.N., 209, 233<br />
Pianka, E.R., 121-2, 231<br />
Pibeam, C.J., 40, 41, 233<br />
Pientel, D., 201. 233<br />
P i , S.L., 222, 231, 233<br />
Piper, E.L., 129, 233<br />
Platt, W.W., 102, 236<br />
Podoler, H., 202, 233<br />
Pollard, E., 186, 188, 189, 190, 233<br />
Poole. R.W., 178, 233<br />
Porter, J.R., 24, 43, 45, 233<br />
Pratt, D.M., 63, 233<br />
Price, P.W., 121, 233<br />
Puckridge, D.W., 40, 42, 233<br />
Putwain, P.D., 216-17, 233<br />
Radovich, J., 168,169,233<br />
R<strong>and</strong>olph, S.E., 137, 233<br />
Raup, M.J., 128, 233<br />
Reader, P.M., 187, 235<br />
Redfern, M., 157, 233<br />
Rediske, J.H., 127, 231<br />
Rees, M., 130, 233<br />
Rice,B., 128. 233<br />
Richards, O.W., 6,233<br />
Richman, S., 131,170,171,233,234<br />
Ricker, W.E., 189, 190, 233<br />
Rigler, F.H., 135, 233<br />
Roberts, E.H., 26, 233<br />
Roberts, H.A., 27,233<br />
Rogers, D., 202, 233<br />
Root, R.B., 79, 233<br />
Rosen, B.R, 21, 234<br />
Rosenzweig, M.L., 149, 234<br />
Rosewell, J., 115, 234<br />
Ross, M.A., 203-4, 205, 234<br />
Rotheray, G.E., 142, 234<br />
Rudge, A.J.B., 124, 232<br />
Sagar, G.R., 5, 26, 234<br />
Sar~khan, J., 12-13,199,200,201,<br />
234<br />
Schaefer, M.B., 169, 234<br />
Schoener, T.W., 98, 234<br />
Scott, J.C., 215, 227<br />
Searle, S.R., 70, 234<br />
Sharitz, R.R, 102-3, 234<br />
Shinozaki, K., 39, 234<br />
Shorrocks, B., 114, 115, 201, 225,<br />
234<br />
Sil<strong>and</strong>er, J.A., 205, 233<br />
SiIliman, R.P., 172, 173, 234<br />
Silvertown, J.W., 11, 85, 191, 205,<br />
234<br />
Simberl<strong>of</strong>T, D.S., 211, 215, 234
AUTHOR INDEX 241<br />
Sinclair, A.R.E., 132, 190, 191, 234<br />
Sjogren, P., 212, 234<br />
Skellam, J.G., 14, 234<br />
Slade, N.A., 186, 234<br />
Slobodkin, L.B., 170, 171, 234<br />
Smith, F.E., 179, 227<br />
Smith, H.S., 152, 179, 227<br />
Snaydon, R.W., 89,234<br />
Snyman, A., 64,234<br />
Solomon, M.E., 29-30, 133, 177,<br />
234,235<br />
Southern, H.N., 118, 125, 203, 204,<br />
235<br />
Southwood, T.R.E., 132-3, 187, 232,<br />
235<br />
Spitters, C.J.T., 112, 235<br />
Spradberry, J.P., 144, 235<br />
Stephens, D.W., 148, 235<br />
Stewart-Oaten, A., 160, 232<br />
Stiling, P., 187, 188, 235<br />
Stimson, J.S., 202, 235<br />
Stubbs, M., 64, 235<br />
Sugihara, G., 208, 209, 235<br />
Sugita, S., 48, 232<br />
Symonides, E., 20, 191, 192, 195,<br />
235<br />
Takahashi, F., 136, 235<br />
Tallamy, D.W., 128, 233<br />
Tamrn, C.O., 204, 206, 235<br />
Taylor, A.D., 157, 160, 209, 235<br />
Taylor, L.R., 189, 235<br />
Thomas, C.D., 212, 213, 230, 235<br />
Thomas, W.R., 207, 235<br />
Thompson, D.J., 133, 134-5, 136,<br />
235<br />
Thompson, K., 26, 235<br />
Tieszen, L.L., 130, 225<br />
Tilman, D., 89-90, 104, 235<br />
Tinbergen, L., 123, 235<br />
Tomlinson, P.B., 24, 225<br />
Turchin, P., 186, 188, 190, 207, 209,<br />
235<br />
Turnbull, A.L., 142, 143, 235<br />
Tybjerg, H., 21-2, 235<br />
Ullyett, G.C., 145, 235<br />
Uranov, A.A., 11, 235<br />
Usher, M.B., 169, 171, 172, 173,<br />
174,235,236<br />
Utida, S., 63, 64, 68, 118, 208, 236<br />
Vance, R.R., 96-7, 236<br />
V<strong>and</strong>ermeer, J.H., 46, 90, 236<br />
van der Meijden, E., 7, 8, 236<br />
Varley, G.C., 15, 31, 125, 145, 155,<br />
178, 179, 180, 181, 183, 184, 229,<br />
236<br />
Vestergaard, P,, 21-2, 235<br />
Vickery, W.L., 184, 186, 236<br />
Volterra, V., 105, 149, 236<br />
Wal<strong>of</strong>f, N., 6, 233<br />
Watkinson, A.R., 43, 46, 48, 66, 68,<br />
87-8,88,110,192-3,194, 196,<br />
205,228.23 1,236<br />
Watson, A., 202, 236<br />
Watson, D., 68, 236<br />
Watt, K.E.F., 169, 236<br />
Way, M.J., 139, 236<br />
Weiner J., 130, 236<br />
Weir, D.A., 199, 200, 236<br />
Weiss, A., 129, 233<br />
Weller, D.E., 47, 236<br />
Werner, P.A., 102, 104, 236<br />
Westley, L.C., 128, 236<br />
Westoby, M., 47, 128, 233, 236<br />
White, J., 25, 43, 47, 48, 236<br />
White, T.C.R, 132, 237<br />
Whitham, T.G., 128, 237<br />
Whittaker, J.B., 164, 23 7<br />
Willey, R.W., 38, 56, 237<br />
Wiams, A.G., 128, 237<br />
WilIiams, C.B., 223, 237<br />
Williamson, M., 186, 212,237<br />
Wilson, D.E., 220, 237<br />
Wison, E.O., 210, 214, 223, 231<br />
Woiwod, I.P., 189, 190, 229, 237<br />
Wolf, L.L., 144, 203, 228, 23 7<br />
Wynne-Edwards, V.C., 202, 23 7<br />
Yoda, K., 47, 237<br />
Yodzis, P., 66, 237<br />
Zeide, B., 47, 237
Abramis brama. 137<br />
Acacia comigera, 77-8<br />
Acanthina, 122<br />
Aconitum columbianum, 94-5<br />
Agaricia agaricites, 11, 12<br />
Agrostemma githago, 64, 66<br />
Aleurotracheus jelinekii, 187<br />
Algae<br />
Asterionella jormosa, 89-90, 104-5<br />
benthic, 218<br />
Cyclotella meneghiniana. 89-90<br />
Lithothamnion, 48<br />
Synedra ulna, 104-5<br />
Allium tricoccum, 23, 24<br />
Ambrosia artemisijolia, 26<br />
Anagasta kuhniella, 145<br />
Androsace septentrionalis, 191-2<br />
Anemone hepatica. 204, 206<br />
Anisodoris, 218<br />
Anisopteromalus cal<strong>and</strong>rae, 208<br />
Ants, 77-83, 128<br />
Atta columbica tonsipes, 129<br />
Lasius species, 212<br />
Pseudomyrmex jermginea, 77-8<br />
Veromessor perg<strong>and</strong>ei, 81, 82, 83,<br />
98,114<br />
Apanteles glomeratus, 140, 141<br />
Aphids, 125, 130, 132, 189-90<br />
cabbage (Brevicoryne brassicae),<br />
139-40,145<br />
Apodemus sylvaticus, 118, 137<br />
Arabidopsis thaliana, 26<br />
Archaearanea tepidariorum, 142, 143<br />
Ascaridia lineata, 146<br />
Asellus aquaticus, 123<br />
Aspidiotiphagus citrinus, 158<br />
Asterionella jormosa, 89-90, 104-5<br />
Astrocaryum mexicanum, 21<br />
Atta columbica tonsipes, 129<br />
Avena barbata, 85-7, 110-11<br />
Avena fatua, 85-7, 110-11, 196, 198,<br />
199<br />
Badgers, 144<br />
Balaenoptera musculus, 173-4<br />
Balanus balanoides, 92-5, 97, 138<br />
Balanus cariosus, 218<br />
Balanus gl<strong>and</strong>ula, 218<br />
Barley (Hordeum vulgare), 1 18<br />
Barnacles, 202, 21 7-18<br />
Balanus balanoides, 92-5, 97, 138<br />
Balanus cariosus, 218<br />
Balanus gl<strong>and</strong>ula, 218<br />
Chthamalus stellatus. 92-5, 97<br />
Mitella polymerus, 218<br />
Bats, 222<br />
Bedstraw, Heath (Galium saxatile), 216<br />
Bees, Bumble (Bombus appositus,<br />
B. flavijrons), 94-5, 97, 99<br />
Beetles<br />
Callosobruchus chinensis, 64, 118,<br />
208<br />
Callosobruchus maculatus, 63, 64, 68<br />
Colorado (Leptinotarsa decemlineata),<br />
65,181-6, 207<br />
Blowflies (Lucilia cuprina), 64, 165-6<br />
Blue tit (Parus caeruleus), 99-100<br />
Bombus appositus, 94-5, 97, 99<br />
Bombus flavijrons. 94-5, 97, 99<br />
Bracken (Pteridium aquilinum), 200<br />
Bream (Abramis brama), 137<br />
Brevicoryne brassicae, l3 9-40, 145<br />
Bromus sterilis, 84-5<br />
Bromus uniloides, 38<br />
Buttercups (Ranunculus repens),<br />
12-13, 24, 199-200, 201<br />
Butterflies, 202, 212<br />
Euphydryas editha bayensis, 214-15<br />
Plebejus argus, 212-14<br />
Cacti<br />
Opuntia inermis, 140-1<br />
Opuntia stricta, 140-1<br />
Senita, l21<br />
Cactoblastis cactorum, 140-1<br />
Cakile edentula, 194, 196-7<br />
Callaspidia dejonscolombei, 142<br />
Callosobruchus chinensis, 64, 118, 208<br />
Callosobruchus maculatus, 63, 64, 68,<br />
208<br />
Capsella bursa-pastoris, 33-7, 64<br />
Carcinus maenas, 120<br />
Cardiaspina albitextura, 118<br />
Carex arenaria, 24<br />
Carex bigelowii, 23<br />
Carrion fly, 115-16<br />
Caryophyllaeus laticeps, 137<br />
Cewus elaphus, 17-19<br />
Chalcophaps indica, 95-6<br />
Chalcophaps stephani, 95-6<br />
Chelonus texanus, 145, 153<br />
Chorthippus brunneus, 6-7<br />
Chrysocharis gemma, 188<br />
Chrysolina quadrigemina, 11 8<br />
Chthamalus stellatus, 92-5, 97<br />
Clethrionomys glareolus, 11 8<br />
Cloeon dipterum, 123<br />
Clover, 160-4<br />
Coal tit (Parus ater), 100<br />
Coccinella septempunctata, 140, 145<br />
Colorado potato beetle (Leptinotarsa<br />
decemlineata), 65, 181-6, 207<br />
Columba palumbus, 124<br />
Conyza canadensis, 33-7<br />
Corallina, 21 8<br />
Corals, 220<br />
Agaricia agaricites, 11, 12<br />
Corncockle (Agrostemma githago), 64,66<br />
Crabs<br />
(Pagurus species). 96-7<br />
(Carcinus maenas), 120<br />
Cryptus inomatus, 145, 153<br />
Crytocarya cormgata, 220<br />
Cy'clotella meneghiniana, 89-90<br />
Dactylis glomerata, 203-4, 205<br />
Dacus tryoni, 141<br />
Dahlbominus fuscipennis, 152, 153<br />
Damselfly, 133,134-5<br />
Daphnia species, 133, 134-5, 212<br />
D. magna, 62-3, 135<br />
D. pulex, 131<br />
D. pulicaria, 170-1<br />
Deer, 122, 123<br />
red (Cewus elaphus), 17-1 9<br />
white-tailed (Odocoileus hemionus),<br />
20<br />
Delphinium barbeyi, 94-5<br />
Diadromus pulchellus, 140, 141, 145<br />
Diaeretiella rapae, 140<br />
Dioclea megacarpa, 220<br />
Doryphorophaga doryphorae, 182,<br />
184-5<br />
Douglas fir, 127<br />
Doves, Ground (Chalcophapsl<br />
Gallicolumba), 95-6<br />
Dragonflies, 202<br />
Drosophila species, 123-4, 142, 143,<br />
207<br />
D. melanogaster, 50, 201<br />
D. pachea, 121<br />
D. pseudoobscum, 109-10<br />
D. willistoni, 109-10
ORGANISM INDEX 243<br />
Encarsia forrnosa, 145, 151<br />
Endocladia, 21 8<br />
Eotetranychus sexmaculatus, 143-4<br />
Ephestia species, 138<br />
E. cautella, 146-8, 153<br />
E. kuhniella, 153<br />
Erophila vema, 192, 194, 195, 205<br />
Eugenia brachy<strong>and</strong>ra, 220<br />
Euphydryas editha bayensis, 214-15<br />
Euterpe globosa, 220<br />
Fescue, Sheep's (Festuca ovina), 3,<br />
200,216<br />
Festuca ovina, 3, 200, 216<br />
Field bean, 39-40, 41<br />
Fiorinia extema, 158<br />
Fir, Douglas, 127<br />
Flax (Linum usitatissimum), 42, 43, 44<br />
Fleabane, Canadian (Conyza<br />
canadensis), 3 3-7<br />
Fleas (Spilopsyllus cuniculi), 124<br />
Flies, 120<br />
carrion, 115-16<br />
Musca domestica, 152<br />
Phytomyza ilicis, 188<br />
Terellia serratulae, 157-8, 159<br />
Urophora stylata, 157-8, 159<br />
see also Fruitflies<br />
Flour beetles, 92<br />
Flour moths (Ephestia species), 138<br />
E. cautella, 146-8, 153<br />
E. Kuhniella, 153<br />
Folsomia c<strong>and</strong>ida, 171-2<br />
Frogs, 212<br />
Fruitflies<br />
Dacus tryoni, 141<br />
Drosophila species, 1234, 142,<br />
143,207<br />
D. melanogaster, 50, 201<br />
D. pachea, 121<br />
D. pseudoobscura, 109-10<br />
D. willistoni, 109-10<br />
Fuchsia, 24, 43, 45<br />
Galium saxatile, 216<br />
Gallicolumba rufigula, 95-6<br />
Gall midge (Rhopalomyia calijbmica),<br />
158<br />
Glycine species, 2 17<br />
G. javanica, 88, 97<br />
G. max, 39<br />
Golden rod (Solidago), 102<br />
Grasshoppers (Chorthippus brunneus),<br />
6-7<br />
Great tit (Parus major), 9-10, 63,<br />
99-100,140,202-3<br />
Guillemot, Common (Uria aalge), 50-1<br />
Guppies, 123<br />
Lebistes reticulatus, 172-3<br />
Haliclona, 218<br />
Hares, Snowshoe (Lepus americanus),<br />
4,118,164-5<br />
Helianthus annus, 39-40<br />
Helianthus tuberosus, 128<br />
Helix aspersa, 130-1<br />
Hermit crabs (Pagurus species), 96-7<br />
Herons, 122<br />
Heterospilus prosopidis, 1 18<br />
Hieracium pilosella, 3<br />
Holcus lanatus, 199-200<br />
Holcus mollis, 132-3<br />
Hordeum vulgare, 11 8<br />
Humming-birds, 144<br />
Hydrobia ulvae, 98, 99, 114<br />
Hydrobia ventrosa, 98, 99, 114<br />
Hydrometra myrae, 126<br />
Hydryphantes tenuabilis, 126<br />
Hypericum peqhoratum, 118<br />
Hypocharis radicata, 130-1<br />
Ischnura elegans, 133<br />
Ixodes trianguliceps, 13 7<br />
Katherina tunicata, 218<br />
Laemophloeas minutus, 1 l8<br />
Larch Tortrix (Zeiraphera diniana), 65<br />
Lariophagus distinguendus, 208<br />
Larkspur (Delphinium barbeyi), 94-5<br />
Lasius, 212<br />
Leaf-miner (Phytomyza ilicis), 188<br />
Lebistes reticulatus, 172-3<br />
Leek moth, 141, 144<br />
Leptinotarsa decemlineata, 65, 181-6,<br />
207<br />
Lepus americanus, 4, 118, 164-5<br />
Lime, 130<br />
Limpets, 202, 218<br />
Patella cochlear, 48-9, 65<br />
Linum usitatissimum, 42, 43, 44<br />
Linyphia triangularis, 131<br />
Lithothamnion, 48<br />
Littorina sitkana, 97<br />
Lobster, Rock (Palinurus cygnus), 169<br />
Lolium perenne, 45, 46, 133<br />
Loxostege stricticalis, 145, 153<br />
Lucilia cuprina, 64, 165-6<br />
Lymantria dispar, 158<br />
Lynx canadensis, 4, 118<br />
Marsh tit (Parus palustris), 99-100,<br />
222<br />
Mattesia dispora, 1 l8<br />
Mayfhes (Cloeon dipterum), 123<br />
Meadow grass (Poa annua), 14-1 7,<br />
72-4<br />
Mexican tree palm (Astrocaryum<br />
mexicanum), 21<br />
Mice<br />
House (Mus musculus), 118<br />
Wood (Apodemus sylvaticus), 118,137<br />
Mink (Mustela vison), 125-6<br />
Minuartia glabra, 102-3<br />
Minuartia unijlora, 103<br />
Mitella polymerus, 218<br />
Monkshood (Aconitum columbianum),<br />
94-5<br />
Moths, 189-90<br />
Cactoblastis cactorum, 140-1<br />
leek, 141, 144<br />
Lymantria dispar, 158<br />
Plodia interpunctella, 64, 136<br />
Musca domestica, 152<br />
Musk-rat (Ondatra zibethicus), 125-6<br />
Mus musculus, 11 8<br />
Mussels, 120, 144, 217-18<br />
Mytilus califomianus, 122, 218<br />
Mytilus edulis, 122<br />
Mustela nivalis, 203<br />
Mustela vison, 125-6<br />
Mytilus calijomianus, 122, 218<br />
Mytilus edulis, 122<br />
Nasonia vitripennis, 152<br />
Nectarina reichenowi, 202, 203<br />
Neodiprion sertifer, 134, 152, 153<br />
Notonecta glauca, 122-3, 148, 149<br />
Oak (Quercus robur), 130<br />
Oat<br />
Avena barbata, 85-7, 110-1 1<br />
Avena fatua, 85-7, 110-11<br />
Odocoileus hemionus, 20<br />
Ondatra zibethicus, 125-6<br />
Ooencyrtus kuwanai, 158<br />
Opuntia inermis, 140-1<br />
Opuntia stricta, 140-1<br />
Oryzaephilus surinamensis, 92<br />
Owls, 222<br />
tawny (Strix aluco), 118, 125, 203,<br />
204,222<br />
Pagurus beringanus, 96-7<br />
Pagurus granosimanus, 96-7<br />
Pagurus hirsutiusculus, 96-7<br />
Palinurus cygnus, 169<br />
Panicum maximum, 88, 97, 217<br />
Parus ater, 100<br />
Parus caeruleus, 99-100<br />
Parus major, 9-10, 63, 99-100, 140,<br />
202-3<br />
Parus montanus, 100, 222<br />
Parus palustris, 100, 222<br />
Patella cochlear, 48-9, 65<br />
Pheidole species, 83<br />
Ph. gilvescens, 82<br />
Ph. sitarches, 82
244 ORGANISM INDEX<br />
Phleum arenarium, 87, 88, 111<br />
Phleum pratense, 25<br />
Phytomyza ilicis, 188<br />
Phytoseiulus persimilis, 145<br />
Picea sitchensis, 42, 45<br />
Pieris brassicae, 141<br />
Pigeon, Wood (Columba palumbus), 124<br />
Pisaster ochraceus, 21 7-19<br />
Planchonella, 220<br />
Plantago major, 33-7<br />
Plantain (Plantago major), 33-7<br />
Plebejus argus, 212-14<br />
Pleolophus basizonus, 134, 153<br />
Plodia interpunctella, 64, 136<br />
Poa annua, 14-17, 724<br />
Pogonomyrmex barbatus, 81<br />
Pogonomymex califomicus, 81<br />
Pogonomyrmex desertorum, 8 1<br />
Pogonomyrmey magnacanthus, 82<br />
Pogonomyrmex maricopa, 81<br />
Pogonomyrmex pima, 81, 83<br />
Pogonomyrmex rugosus, 81<br />
Polygonatum verticilatum, 21-2<br />
Poppies, 27<br />
Porphyra, 21 8<br />
Pseudomyrmex jermginea, 77-8<br />
Pteridium aquilinum, 200<br />
Pteromalus elevatus, 158<br />
Quercus robur, 130<br />
Ragwort (Senecio jacobaea), 7-9<br />
Ranunculus repens, 12-13, 24,<br />
199-200, 201<br />
Red deer (Cervus elaphus), 17-19<br />
Rhizobium, 88, 97<br />
Rhodomela, 218<br />
Rhopalomyia cali;fomica, 158<br />
Rhyssa persuasoria, 144<br />
Rumex acetosella, 21 6-1 7<br />
Ryegrass, 160-4<br />
Lolium perenne, 45, 46, 133<br />
Saccharomyces cerevisiae, 13 5<br />
Sardine, Pacific (Sardinops caerulea),<br />
168-9<br />
Sardinops caerulea, 168-9<br />
Sawfly, 134<br />
Scheelea rostrata, 220<br />
Searlesia dira, 97<br />
Sea rocket (Cakile edentula), 194,<br />
196-7<br />
Sedge (Carex arenaria), 24<br />
Sedum smallii, 102<br />
Senecio jacobaea, 7-9<br />
Senecio vulgaris, 68<br />
Senita cactus, 121<br />
Sheep, Tasmanian, 62-3<br />
Shepherd's purse (Capsella bursapastoris),<br />
33-7, 64<br />
Slugs, 133<br />
Snails, 130-1<br />
Acanthina species, 122<br />
Helix aspersa, 130-1<br />
Hydrobia ulvae, 98, 99, 114<br />
Hydrobia ventrosa, 98, 99, 114<br />
Thais species, 122, 138, 218<br />
Solidago, 102<br />
Sorrel (Rumex acetosella), 216-1 7<br />
Soybeans (Glycine max), 39, 21 5<br />
Spiders<br />
Archaearanea tepidariorum, 142, 143<br />
Linyphia triangularis, 131<br />
Spilopsyllus cuniculi, 124<br />
Spondias mombin, 220<br />
Sponge (Haliclona), 21 8<br />
Spruce (Picea sitchensis), 42, 45<br />
Starfish, 144, 217-18<br />
Pisaster ochraceus, 21 7-19<br />
Sterculia apetala, 220<br />
Strix aluco, 118, 125, 203, 204, 222<br />
Sunbird, Golden winged (Nectarina<br />
reichenowi), 202, 203<br />
Sunflowers (Helianthus annus), 3940<br />
Synedra ulna, 104-5<br />
Syrphus, 118, 142<br />
Tapeworms (Caryophyllaeus laticeps),<br />
137<br />
Terellia serratulae, 157-8, 159<br />
Tetranychus urticae, 145<br />
Tetrastichus cirsii, 158<br />
Thais species, 122<br />
Th. canaliculata, 138<br />
Th. emarginata, 138, 218<br />
Th. lamellosa, 138<br />
Thrips imaginis, 178-80<br />
Thymus drucei, 3<br />
Ticks (Ixodes trianguliceps), 13 7<br />
Timothy grass (Phleum pratense), 25<br />
Tits (Parus species)<br />
P. ater, 100<br />
P. caeruleus, 99-100<br />
P. major, 9-10, 63, 99-100, 140,<br />
202-3<br />
P. montanus, 100, 222<br />
P, palustris, 100, 222<br />
Torymus baccaridis, 1 58<br />
Trialeurodes vaporariorum, 145, 151<br />
Tribolium castaneum, 92<br />
Tribolium confusum, 92<br />
Trifolium repens, 102<br />
Triticum aestivum, 40, 42<br />
Tubificids, 123, 124<br />
Tuna, Yellow fin, 169<br />
Typhlodromus longipilus, 144<br />
Typhlodromus occidentalis, 143-4<br />
Uria aalge, 50-1<br />
Urophora stylata, 157-8, 159<br />
Venturia canescens, 136, 138, 146-8,<br />
153<br />
Veromessor perg<strong>and</strong>ei, 81, 82, 83, 98,<br />
1 l4<br />
Vibumum tinus, 187<br />
Vicia faba, 3940, 41<br />
Voles (Clethrionomys glareolus), 118<br />
Vulpia jasiculata, 47, 68, 87, 88, 111,<br />
192-3,196<br />
Wagtail, Pied, 120<br />
Wasps (Heterospilus prosopidis), 118<br />
Water-boatmen (Notonecta glauca)<br />
122-3,148,149<br />
Waterfleas (Daphnia species), 133,<br />
134-5,212<br />
D. magna, 62-3, 135<br />
D. pulex, 131<br />
D. pulicaria, 170-1<br />
Weasels (Mustela nivalis), 203<br />
Weevils, Bean<br />
Callosobruchus chinensis. 64, 1 l8<br />
Callosobruchus maculatus, 63, 64, 68<br />
Whale, Blue (Balaenoptera musculus),<br />
173-4<br />
Wheat (Triticum aestivum), 40, 42<br />
Whelks (Thais species), 122, 138<br />
Th. emarginata, 138, 218<br />
Whiteflies<br />
Aleurotracheus jelinekii, 187<br />
Trialeurodes vaporariorum, 145, 151<br />
Wildebeest, 132<br />
Wild oat (Avena jatua), 85-7, 110-11,<br />
196,198,199<br />
Willow tit (Parus montanus), 100, 222<br />
Woodpeckers, 222<br />
Wood pigeon (Columba palumbus), 124<br />
Yeast (Saccharomyces cerevisiae), 13 5<br />
Zea mays, 38<br />
Zeiraphera diniana, 65
Age-specific fecundity, 10<br />
Cervus elaphus, 17-1 8<br />
models for, 66-74<br />
Poa annua, 16, 72-4<br />
Age-specific mortality-rate, 15<br />
classification, 18-20<br />
Poa annua, 16<br />
Age-specific survivorship, 16<br />
Cervus elaphus, 1 7<br />
Age states classification, 10-13<br />
Aggregative behaviour, 137-44<br />
interference <strong>and</strong> pseudointerference,<br />
146-8, 155, 157<br />
mathematical model, 154<br />
Allee effect, 5 1, 160<br />
Allelopathy, 77<br />
Amensalism, 77, 78, 101<br />
Annual species, 6<br />
b (competitiorddensity parameter),<br />
46-8<br />
definition, 46<br />
Biennial species, 7-9<br />
Buried seeds, 26-7, 198-9<br />
Carrying-capacity (K), 53-4, 15 1<br />
definition, 3 1<br />
metapopulation models <strong>and</strong>,<br />
210-12<br />
Census data, 186, 188-90<br />
Chaos detection, 60, 205-9<br />
Character displacement, 98<br />
Chicken pox, 209<br />
Childhood diseases, 209<br />
Clone, 13<br />
Cloning (natural), 24<br />
Cobwebbing, 65-6<br />
Coexistence, 87-8, 95-8<br />
<strong>of</strong> Asterionella <strong>and</strong> Synedra, 104-5<br />
in carrion flies, 11 5-16<br />
habitat heterogeneity, <strong>and</strong>, 114-1 6<br />
in hermit crabs, 96-7<br />
Lotka-Volterra modelling <strong>and</strong>,<br />
105-8<br />
in mud snails, 98<br />
niche overlap <strong>and</strong>, 112-14<br />
<strong>of</strong> Panicum <strong>and</strong> Glycine, 88<br />
in Sedum <strong>and</strong> Minnartia, 102-103<br />
Cohort, 13<br />
Colonization events, 210-1 2<br />
Commensalism, 7 7<br />
Community structure, 210, 216<br />
Competition see Interspecific<br />
competition; Intraspecific<br />
competition<br />
Competitive exclusion, 87, 90, 92-5<br />
Lotka-Volterra modelling <strong>and</strong>, 108<br />
see also Interspecific competition<br />
Competitive release, 95<br />
Conservation aspects, 214-1 5<br />
Consumers see Predation<br />
Continuous breeding model, 5 8-60<br />
Cooperation in Uria aalge, 50-1<br />
Cropping (harvesting), 165-74<br />
Defoliation see Herbivores<br />
Density-dependence<br />
delayed, 125, 190<br />
in<br />
Helianthus annus, 39-40<br />
Triticum aestivum, 40-1<br />
Vicia fabia, 39-40<br />
interspecific competition <strong>and</strong>, 83-9<br />
intraspecific competition <strong>and</strong>,<br />
29-3 1<br />
predation <strong>and</strong>, 133-5, 155-60<br />
spatial, 187<br />
see also Regulation <strong>of</strong> population<br />
Density-independence, 29, 177-8,<br />
186<br />
Desert ecology, 78-83<br />
Differentiation, 59<br />
Disturbance <strong>and</strong> community<br />
structure, 219-20<br />
d,-values, 1 5<br />
Ecological neighbourhood area, 5 7<br />
Ecological niche, 90-2<br />
niche overlap, 1 12- 14<br />
versus habitat, 91<br />
Extinction <strong>of</strong> populations, 210-16<br />
butterfly studies, 212-14<br />
Fisheries research, 65, 167-8<br />
guppies, 172<br />
lobsters, 169<br />
sardines, 168, 169<br />
yellow fin tuna, 167, 169<br />
Fluctuations in population size<br />
causes, 60-2<br />
examples, 62-5<br />
host-parasitoid models, 150-5<br />
intrinsic factor models, 60-2<br />
in plants, 191-200<br />
predator-prey patterns, 11 8-19<br />
Food chains, 222<br />
Food preference, 122-4<br />
Food quality <strong>and</strong> predation, 132-3<br />
Foraging strategies, 80-1<br />
predator-prey, 148-9<br />
Fruit-eating herbivores, 12 7<br />
Fungi, 77<br />
Genet, 13<br />
Genetic aspects, 200-1<br />
Grazing system model, 160-4<br />
Growth <strong>of</strong> organisms<br />
indeterminateldeterminate, 38-9<br />
life cycles <strong>and</strong> individual size, 11<br />
modular, 21-5, 37<br />
Guilds, 79<br />
Habitat<br />
definition, 91<br />
habitat heterogeneity, 114-16<br />
size differences, 222-3<br />
versus ecological niche, 91<br />
H<strong>and</strong>ling time, 121-2.134-7, 148-9<br />
mathematical model, 152<br />
Harvesting, 165-74<br />
matrix models <strong>of</strong>, 173-4<br />
in structured populations, 170-3<br />
Herbivores, 77, 117<br />
effect on plant fitness, 126-31<br />
see also Predation<br />
Instability <strong>of</strong> community structure,<br />
220-2<br />
Interspecific competition, 77-1 16<br />
between<br />
algae species, 89-90<br />
barnacles, 92-4<br />
bumble bees, 94-5, 99<br />
flour beetles, 92<br />
fruitflies, 109-10
246 SUBJECT INDEX<br />
Interspecific competition (Cont.)<br />
granivorous ants, 78-83, 98<br />
ground doves, 95<br />
plant species, 83-90, 101-5,<br />
110-12<br />
tits, 99-100<br />
wheat <strong>and</strong> Bromus, 84-5<br />
wild oats, 85-7, 110-11<br />
character displacement, 98<br />
coexistence: in plants, 101-5<br />
coexistence: resource partitioning,<br />
95-8<br />
community structure <strong>and</strong>, 216-1 7<br />
competition avoidance, 98-101<br />
competitive exclusion, 87, 90,<br />
92-5,108<br />
competitive release, 95<br />
ecological niche <strong>and</strong>, 90-2<br />
habitat heterogeneity <strong>and</strong>, 114-16<br />
logistic models, 105-10<br />
niche overlap, 112-14<br />
Intraspecific competition, 28-5 1<br />
case studies, 33-50<br />
L ucilia cuprina, 165-6<br />
characteristics, 29-3 1<br />
in host-parasitoid systems, l5 1<br />
negative competition, 50-1<br />
scramble <strong>and</strong> contest, 31-2, 50<br />
single-species models, 52-74<br />
Inverse density-dependence, 15 3,<br />
155-6<br />
Isl<strong>and</strong> biogeography theory, 2 10,<br />
214-16<br />
Isl<strong>and</strong> habitats, 222-3<br />
Iteroparous species, 20<br />
K (carrying-capacity), 5 3-4, 15 1<br />
definition, 3 1<br />
metapopulation models <strong>and</strong>,<br />
210-12<br />
Killing-power see k-values<br />
k-values, 15<br />
Colarado beetle study, 182-6<br />
competition experiments, 64<br />
intraspecific competition <strong>and</strong>, 31-7,<br />
47, 55<br />
Leslie matrix model, 69-72<br />
practical application, 173-4<br />
Life cycles, 6-10<br />
Aleurotracheus jelinekii, 187-8<br />
Poa annua, 72<br />
Life-tables<br />
analyses, 186-8<br />
Colorado beetle, 181-6<br />
conventional, 13-1 8<br />
diagrammatic, 5-13, 68<br />
Linear recurrence equations, 69<br />
Logarithms, use <strong>of</strong>, 16-17<br />
Logistic equation, 59-60, 61<br />
Lotka-Volterra models, 105-8, 149,<br />
222<br />
1,-values, 15<br />
Mathematical models<br />
age-specific fecundity, 66-74<br />
continuous breeding, 5 8-60<br />
grazing systems, 160-4<br />
interspecific competition, 105-10<br />
intraspecific competition, 52-74<br />
Lotka-Volterra, 105-8, 149, 222<br />
metapopulation, 210-12<br />
population regulation, 185-6<br />
predation, 149-64<br />
usefulness <strong>of</strong>, 52<br />
see also Matrix modelling<br />
Matrix modelling, 69<br />
harvesting, 173-4<br />
single-species populations, 69-72<br />
m (coefficient <strong>of</strong> interference), 145-6<br />
Ephestia <strong>and</strong> Venturia, 146-7<br />
Measles, 209<br />
.Metapopulation, 210-16<br />
Models see Mathematical models;<br />
Matrix modelling<br />
Monocarpic fluctuations, 20<br />
Mutual interference by predators,<br />
144-8<br />
mathematical modelling, 155, 15 7<br />
Mutualism, 77-8<br />
Nature reserve design, 214<br />
Niche<br />
ecological niche, 90-2<br />
niche differentiation in plants,<br />
101-4<br />
niche overlap, 112-14<br />
Nicolson-Bailey model, 150-5<br />
Optimal foraging, 148-9<br />
Parasites, 77, 117, 121<br />
host immune responses, 146<br />
parasite-host distributions, 13 7-8<br />
predation-rates, 126<br />
Spilopsyllus cuniculi. 124<br />
see also Predation<br />
Parasitoids, 117, 121, 156-60<br />
host-parasitoid models, 150-5, 208<br />
predation-rates, 126<br />
Patchiness <strong>of</strong> prey distributions,<br />
143-4<br />
optimal foraging, 148<br />
parasitoid-host density <strong>and</strong>,<br />
156-60<br />
Polycarpic fluctuations, 20<br />
Predation, 77,117-74<br />
abundance patterns, 11 8-19<br />
community structure <strong>and</strong>, 217-19<br />
harvesting, 165-74<br />
mathematical models, 149-64<br />
optimal foraging, 148-9<br />
predator coevolution <strong>and</strong><br />
specialization, 11 9-24<br />
predator fitness, l3 1-3<br />
predator interference/pseudointerference,<br />
144-8, 155, 157<br />
prey availabilty, 133-7<br />
prey fitness <strong>and</strong>, 125-31<br />
stabilizing factors, 164-5<br />
timing aspects, 124-5<br />
Predation-rate<br />
aggregation <strong>and</strong>. 13 7-44<br />
effect on predator fitness, 131-3<br />
effect on prey fitness, 125-31<br />
foraging strategies <strong>and</strong>, 148-9<br />
mutual predator interference,<br />
144-6<br />
prey density <strong>and</strong>, 133-7<br />
Rainforests, 214-15, 220<br />
Ramet, 13<br />
Refuges for prey, 138-9<br />
mathematical modelling <strong>and</strong>,<br />
154<br />
partial refuges, 13 9-40<br />
Regulation <strong>of</strong> population, 29-3 1,<br />
177-209<br />
Andrewartha <strong>and</strong> Birch's view,<br />
177-8<br />
chaos detection, 60, 205-9<br />
Colorado beetle, 181-6<br />
genetic change, 200-1<br />
Nicholson's view, 177<br />
in plants, 191-200<br />
space capture, 104, 203-5<br />
territoriality, 201-3<br />
Thrips imaginis, 178-80<br />
in vertebrates, 190-1<br />
see also Density-dependence;<br />
Metapopulation<br />
Relative yield totals, 87-8<br />
for Panicum <strong>and</strong> Glycine, 88<br />
Reproduction-rate, population size<br />
<strong>and</strong>, 201<br />
R (net reproductive rate)<br />
definition, 52
SUBJECT INDEX 247<br />
<strong>of</strong> Poa annua, 74<br />
Rotharnsted Insect Survey, l89<br />
Saprophytism, 77<br />
Search efficiency <strong>of</strong> predators, 142,<br />
147<br />
host-parasitoid models, 150<br />
Seed banks, 7-9, 195<br />
buried, 26-7, 198-9<br />
granivorous ants study. 78-83, 128<br />
seed-eating animals, 127<br />
Self-thinning in plants, 43-8<br />
in Agrostemma githago, 64<br />
Semelparous species, 20<br />
Size<br />
habitat size differences, 222-3<br />
life cycles <strong>and</strong> individual size, 11<br />
see also Fluctuations in population<br />
size<br />
Skewed populations, 42<br />
Space capture, 104,203-5<br />
Survivorship curve, 16<br />
<strong>of</strong> Phleum pratense, 25<br />
Territoriality, 201-3<br />
in birds, 191, 201-2, 203<br />
in plants, 104, 203-5<br />
Time-lags<br />
population fluctuations <strong>and</strong>, 61-2<br />
in predator-prey interactions, 125<br />
Transition matrices see Matrix<br />
modelling<br />
Yields<br />
intraspecific competition <strong>and</strong>, 3 7<br />
relative yields, 87-9<br />
yield-density models, 56-8<br />
yield-density relationships, 39-42