The Ultimate Technical Analysis Handbook - Tradingportalen.com
The Ultimate Technical Analysis Handbook - Tradingportalen.com
The Ultimate Technical Analysis Handbook - Tradingportalen.com

Create successful ePaper yourself
Turn your PDF publications into a flip-book with our unique Google optimized e-Paper software.
Chapter 3 — How To Integrate <strong>Technical</strong> Indicators Into an Elliott Wave<br />
Forecast<br />
1. How One <strong>Technical</strong> Indicator Can Identify Three Trade Setups<br />
I love a good love-hate relationship, and that’s what I’ve got with technical indicators. <strong>Technical</strong> indicators are<br />
those fancy <strong>com</strong>puterized studies that you frequently see at the bottom of price charts that are supposed to tell<br />
you what the market is going to do next (as if they really could). <strong>The</strong> most <strong>com</strong>mon studies include MACD,<br />
Stochastics, RSI and ADX, just to name a few.<br />
<strong>The</strong> No. 1 (and Only) Reason To Hate <strong>Technical</strong> Indicators<br />
I often hate technical studies because they divert my attention from what’s most important – PRICE.<br />
Have you ever been to a magic show? Isn’t it amazing how magicians pull rabbits out of hats and make all<br />
those things disappear? Of course, the “amazing” is only possible because you’re looking at one hand when<br />
you should be watching the other. Magicians succeed at performing their tricks to the extent that they succeed<br />
at diverting your attention.<br />
That’s why I hate technical indicators; they divert my attention the same way magicians do. Nevertheless, I<br />
have found a way to live with them, and I do use them. Here’s how: Rather than using technical indicators as<br />
a means to gauge momentum or pick tops and bottoms, I use them to identify potential trade setups.<br />
Three Reasons To Learn To Love <strong>Technical</strong> Indicators<br />
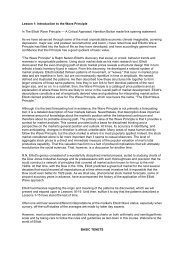
Out of the hundreds of technical indicators<br />
I have worked with over the years,<br />
my favorite study is MACD (an acronym<br />
for Moving Average Convergence-Divergence).<br />
MACD, which was developed by<br />
Gerald Appel, uses two exponential moving<br />
averages (12-period and 26-period).<br />
<strong>The</strong> difference between these two moving<br />
averages is the MACD line. <strong>The</strong> trigger or<br />
Signal line is a 9-period exponential moving<br />
average of the MACD line (usually<br />
seen as 12/26/9…so don’t misinterpret<br />
it as a date). Even though the standard<br />
settings for MACD are 12/26/9, I like to<br />
use 12/25/9 (it’s just me being different).<br />
An example of MACD is shown in Figure<br />
6 (Coffee).<br />
Figure 6<br />
<strong>The</strong> <strong>Ultimate</strong> <strong>Technical</strong> <strong>Analysis</strong> <strong>Handbook</strong> — © 2009 Elliott Wave International<br />
This ebook includes handpicked lessons from more than 200 pages of EWI’s <strong>com</strong>prehensive<br />
Trader’s Classroom Collection of eBooks. Learn more here: http://www.elliottwave.<strong>com</strong>/wave/ClubTCC<br />
8