The Ultimate Technical Analysis Handbook - Tradingportalen.com
The Ultimate Technical Analysis Handbook - Tradingportalen.com
The Ultimate Technical Analysis Handbook - Tradingportalen.com

Create successful ePaper yourself
Turn your PDF publications into a flip-book with our unique Google optimized e-Paper software.
Chapter 9 —Pick Your Poison... and Your Protective Stops<br />
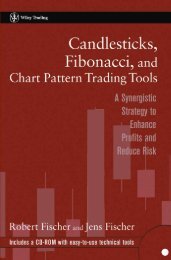
2. Volatility Stop<br />
<strong>The</strong> Volatility Stop is a <strong>com</strong>ponent<br />
of the Volatility System, also developed<br />
by Welles Wilder. It is based<br />
on a volatility index made up of the<br />
ongoing calculated average of True<br />
Range. (<strong>The</strong> True Range is always<br />
positive and is defined as the highest<br />
difference in value among these<br />
three values: today’s daily high<br />
minus today’s daily low, today’s<br />
daily high minus yesterday’s closing<br />
price, and today’s low minus<br />
yesterday’s closing price.)<br />
My 2 cents: <strong>The</strong> Volatility Stop is a<br />
bit more to my liking, especially when<br />
penetrated on a closing basis. As you<br />
Figure 79<br />
can see in Figure 79, the protective stop<br />
identified by this technique is much tighter than the levels offered by Parabolic. And while this approach to<br />
identifying protective stops is excellent in trending markets, when a market is not trending smoothly, the result<br />
is whipsaws – something we saw in the first few weeks of trading in Cocoa in early June.<br />
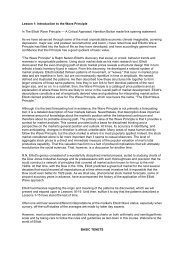
3. Three Period High-Low Channel<br />
<strong>The</strong> Three Period High-Low Channel<br />
isn’t the brainchild of any one<br />
analyst but stems from my own<br />
observation of what I consider to be<br />
tradable moves. A tradable move is<br />
a move where prices travel very far<br />
very fast (i.e. impulse waves). And<br />
as you can see in Figure 80, since<br />
the June advance began in Cocoa,<br />
prices have consistently remained<br />
above the three-period low channel.<br />
What exactly is a high-low channel?<br />
It’s a channel that marks the highest<br />
high and lowest low within a specified<br />
period of time, in this case three<br />
periods.<br />
Figure 80<br />
<strong>The</strong> <strong>Ultimate</strong> <strong>Technical</strong> <strong>Analysis</strong> <strong>Handbook</strong> — © 2009 Elliott Wave International<br />
This ebook includes handpicked lessons from more than 200 pages of EWI’s <strong>com</strong>prehensive<br />
Trader’s Classroom Collection of eBooks. Learn more here: http://www.elliottwave.<strong>com</strong>/wave/ClubTCC<br />
51