The Ultimate Technical Analysis Handbook - Tradingportalen.com
The Ultimate Technical Analysis Handbook - Tradingportalen.com
The Ultimate Technical Analysis Handbook - Tradingportalen.com

Create successful ePaper yourself
Turn your PDF publications into a flip-book with our unique Google optimized e-Paper software.
Chapter 7 — Time Divergence: An Old Method Revisited<br />
Old Timers’ Method for Finding Trade Setups<br />
Most of you are familiar with what<br />
Divergence is. If not, it is simple and<br />
intuitive – divergence occurs when an<br />
underlying indicator doesn’t reflect price<br />
movement. For example, a bearish divergence<br />
occurs when prices make new<br />
highs yet the underlying indicator does<br />
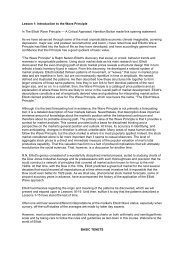
not. To clarify this point, I am including<br />
a price chart of Cocoa above its MACD<br />
(Moving Average Convergence/Divergence)<br />
chart to illustrate typical bullish<br />
and bearish divergences between the two<br />
(Figure 70).<br />
Notice in the lower left hand corner of<br />
Figure 70 that in October 2006, Cocoa<br />
prices pushed below the September 2006<br />
low. However, the underlying indicator<br />
(MACD) registered higher lows during<br />
this same period. This condition is referred<br />
to as bullish divergence. Indeed,<br />
Cocoa prices soon started trending up.<br />
Conversely, in February and March, we<br />
saw higher prices beyond the December<br />
2006 peak. Yet MACD failed to mirror<br />
the price chart and instead registered<br />
lower highs during this same period.<br />
This bearish divergence suggests an<br />
up<strong>com</strong>ing decline in Cocoa prices.<br />
Now that the explanation of Divergence<br />
is out of the way, let me share with you<br />
a unique twist on the subject. It’s something<br />
I call Time Divergence, and it occurs<br />
when price extremes in front-month<br />
or forward-month futures contracts<br />
diverge from price extremes evident in<br />
higher time-frame continuation charts.<br />
Let me explain. In Figure 71, you can<br />
see that in Sugar’s weekly continuation<br />
chart, lower highs occurred during the<br />
Figure 70<br />
Figure 71<br />
<strong>The</strong> <strong>Ultimate</strong> <strong>Technical</strong> <strong>Analysis</strong> <strong>Handbook</strong> — © 2009 Elliott Wave International<br />
This ebook includes handpicked lessons from more than 200 pages of EWI’s <strong>com</strong>prehensive<br />
Trader’s Classroom Collection of eBooks. Learn more here: http://www.elliottwave.<strong>com</strong>/wave/ClubTCC<br />
45