The Ultimate Technical Analysis Handbook - Tradingportalen.com
The Ultimate Technical Analysis Handbook - Tradingportalen.com
The Ultimate Technical Analysis Handbook - Tradingportalen.com

Create successful ePaper yourself
Turn your PDF publications into a flip-book with our unique Google optimized e-Paper software.
Chapter 6 —How To Draw and Use Trendlines<br />
3. How To Use Jeffrey Kennedy’s Channeling Technique<br />
We’ve now dealt with trendlines and Elliott’s channeling technique. Before I move on to a different topic, I’d<br />
like to share my own channeling technique.<br />
All too often, Elliotticians balance a bullish wave count with a bearish alternate. It’s frustrating to find out that<br />
what you thought was wave C was actually wave three. So when does a C wave be<strong>com</strong>e a third wave? Or how<br />
do you know if the wave 4 you’re counting goes with wave 2, and not a smaller or larger degree wave two? I<br />
spent years trying to design a tool or technique that would confirm wave patterns and answer these questions.<br />
Here’s what I came up with.<br />
My theory is simple: Five waves break down into three channels, and three waves need only one. <strong>The</strong> price<br />
movement in and out of these channels confirms each Elliott wave.<br />
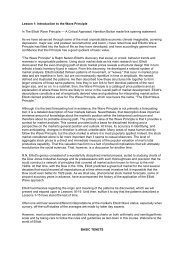
Base Channel<br />
Figure 61 shows three separate<br />
five-wave patterns with three different<br />
channels drawn: the base<br />
channel, the acceleration channel<br />
and the deceleration channel.<br />
<strong>The</strong> base channel contains the<br />
origin of wave one, the end of<br />
wave two and the extreme of<br />
wave one (Figure 61A). Of the<br />
three channels, the base channel<br />
is most important, because it defines<br />
the trend. As long as prices<br />
stay within the base channel, we<br />
can safely consider the price action<br />
corrective. Over the years,<br />
I’ve discovered that most corrective wave patterns stay within<br />
one price channel (Figure 62). Only after prices have moved<br />
through the upper or lower boundary lines of this channel is<br />
an impulsive wave count suitable, which brings us to the acceleration<br />
channel.<br />
Figure 61<br />
Acceleration Channel<br />
<strong>The</strong> acceleration channel en<strong>com</strong>passes wave three. Use the<br />
extreme of wave one, the most recent high and the bottom of<br />
wave two to draw this channel (Figure 61B). As wave three<br />
develops, you’ll need to redraw the acceleration channel to ac<strong>com</strong>modate<br />
new highs.<br />
Figure 62<br />
Once prices break through the lower boundary line of the acceleration channel, we have confirmation that wave<br />
three is over and that wave four is unfolding. I have noticed that wave four will often end near the upper boundary<br />
line of the base channel or moderately within the parallel lines. If prices break through the lower boundary<br />
line of the base channel decisively, it means the trend is down, and you need to draw new channels.<br />
<strong>The</strong> <strong>Ultimate</strong> <strong>Technical</strong> <strong>Analysis</strong> <strong>Handbook</strong> — © 2009 Elliott Wave International<br />
This ebook includes handpicked lessons from more than 200 pages of EWI’s <strong>com</strong>prehensive<br />
Trader’s Classroom Collection of eBooks. Learn more here: http://www.elliottwave.<strong>com</strong>/wave/ClubTCC<br />
40