The Ultimate Technical Analysis Handbook - Tradingportalen.com
The Ultimate Technical Analysis Handbook - Tradingportalen.com
The Ultimate Technical Analysis Handbook - Tradingportalen.com

Create successful ePaper yourself
Turn your PDF publications into a flip-book with our unique Google optimized e-Paper software.
Chapter 6 —How To Draw and Use Trendlines<br />
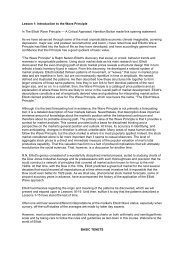
Figure 57 Figure 58<br />
<strong>The</strong> next channel we’ll<br />
draw serves to identify a<br />
likely target for wave five.<br />
Your first line connects<br />
the ends of waves two and<br />
four. Draw a parallel line at<br />
the extreme of wave three<br />
(see Figure 57). <strong>The</strong> upper<br />
boundary of this channel<br />
identifies fifth-wave resistance.<br />
If you’re contending<br />
with a third wave that is<br />
parabolic, then use the extreme<br />
of wave one. (Parabolic<br />
is simply a term used<br />
to describe price action that<br />
travels far in a short period<br />
of time.)<br />
Fifth waves are tricky, and<br />
sometimes prices will exceed<br />
this upper boundary<br />
line (called a throw-over<br />
— see Figure 58) or undershoot<br />
it. R.N. Elliott noted<br />
this possibility and discovered<br />
a significant clue that<br />
Figure 59<br />
<strong>The</strong> <strong>Ultimate</strong> <strong>Technical</strong> <strong>Analysis</strong> <strong>Handbook</strong> — © 2009 Elliott Wave International<br />
This ebook includes handpicked lessons from more than 200 pages of EWI’s <strong>com</strong>prehensive<br />
Trader’s Classroom Collection of eBooks. Learn more here: http://www.elliottwave.<strong>com</strong>/wave/ClubTCC<br />
38