The Ultimate Technical Analysis Handbook - Tradingportalen.com
The Ultimate Technical Analysis Handbook - Tradingportalen.com
The Ultimate Technical Analysis Handbook - Tradingportalen.com

Create successful ePaper yourself
Turn your PDF publications into a flip-book with our unique Google optimized e-Paper software.
Chapter 6 —How To Draw and Use Trendlines<br />
Primary Angle<br />
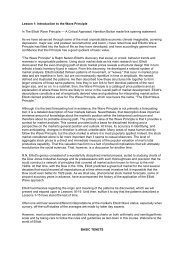
Besides simply connecting highs and lows, you can draw trendlines in many other ways that are just as exciting<br />
and informative. Figure 49 shows a technique I call Primary Angle. Notice the upward trendline drawn in Sugar<br />
in late 1999 (A1). Now look at the trendline up from the 2002 low (A2). See anything interesting? <strong>The</strong>se two<br />
trendlines are parallel! <strong>The</strong> slope of the late 1999 rally is the same for the 2002 advance. In fact, the range of<br />
the weekly high for the 2002 advance en<strong>com</strong>passes this line. <strong>The</strong> same is true for the two downward sloping<br />
trendlines drawn off the 2000 and 2003 highs (B1 & B2); the angle of the decline is the same.<br />
Another way to use Primary Angle besides identifying possible trend changes is clear in Figure 50. <strong>The</strong> trendline<br />
up from the March low is a parallel of the late February advance. As you can see, prices were falling off<br />
of this trendline by the March high. I interpret this move as weak price action with waning momentum. And<br />
resulting price action supports this conclusion. In Figure 51, notice how prices are to the right of the downward<br />
trendline from the March high. Again, this selloff lacks the intensity of its predecessor. You can see in Figure<br />
52 why this makes sense from an Elliott perspective. <strong>The</strong> wave pattern from the late February 35.05 peak is an<br />
expanded flat correction (3-3-5). Wave (a) bottomed at 31.75 (basis May), and wave (b) topped at 35.18 [after<br />
making a moderate new high beyond the extreme of wave (a)]. Wave (c) of 9 is under way, targeting Fibonacci<br />
support at 30.44-29.63. It’s not surprising to see prices behave like this near the end of a wave pattern.<br />
Figure 49<br />
<strong>The</strong> <strong>Ultimate</strong> <strong>Technical</strong> <strong>Analysis</strong> <strong>Handbook</strong> — © 2009 Elliott Wave International<br />
This ebook includes handpicked lessons from more than 200 pages of EWI’s <strong>com</strong>prehensive<br />
Trader’s Classroom Collection of eBooks. Learn more here: http://www.elliottwave.<strong>com</strong>/wave/ClubTCC<br />
33