The Ultimate Technical Analysis Handbook - Tradingportalen.com
The Ultimate Technical Analysis Handbook - Tradingportalen.com
The Ultimate Technical Analysis Handbook - Tradingportalen.com

You also want an ePaper? Increase the reach of your titles
YUMPU automatically turns print PDFs into web optimized ePapers that Google loves.
Chapter 4 — Origins and Applications of the Fibonacci Sequence<br />
Non-traditional Application<br />
So far we have covered the traditional<br />
application of Fibonacci<br />
ratios to various Elliott wave<br />
patterns. A non-traditional approach<br />
that uses the previous<br />
wave to project the current wave.<br />
For example, wave four would<br />
be used to calculate wave five<br />
or wave B to project wave C.<br />
<strong>The</strong> most significant Fibonacci<br />
ratios I have found using this<br />
technique are 1.382 and 2.000.<br />
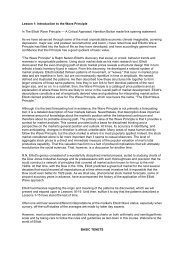
To apply this reverse Fibonacci<br />
technique, multiply the previous<br />
wave by 1.382 or 2.000 and add<br />
the sum to the origin of the developing<br />
wave. For example, in<br />
Figure 36, the distance between<br />
point A and point B is multiplied<br />
by 2.000 and projected upward<br />
Figure 36<br />
from point B. <strong>The</strong> objective for<br />
this advance was 7950 while the actual high came in at 8050. As you work your way from left to right, you<br />
can see that each significant decline in Coffee since the October 2002 high adhered to a 1.382 multiple of the<br />
previous wave.<br />
As Figure 36 illustrates, this technique has merit. However, it is presented to illustrate the versatility of Fibonacci<br />
and the inherent mathematical nature of markets, and is not a substitute for the traditional method of calculating<br />
wave retracements and projections. I use both applications in order to identify concentrations of Fibonacci<br />
objectives. As I often mention, the more numerous the Fibonacci relationships, the more significant the identified<br />
region or Fibonacci cluster. By <strong>com</strong>bining Fibonacci retracements and Fibonacci projections together, you<br />
can truly begin to identify the most highly probable area that prices will react to or strive to attain.<br />
More Information<br />
Additional information on the application of Fibonacci ratios and Elliott wave theory can be found in Elliott<br />
Wave Principle: Key to Market Behavior, by A.J. Frost and Robert Prechter. Even after 10 years of wave counting,<br />
I continue to view this book as the definitive work on the subject and reference it often. To learn more<br />
about the history of Fibonacci, see Leonard of Pisa by Joseph and Frances Gies. Both books are available in<br />
the Elliottwave.<strong>com</strong> bookstore.<br />
[July 2003]<br />
<strong>The</strong> <strong>Ultimate</strong> <strong>Technical</strong> <strong>Analysis</strong> <strong>Handbook</strong> — © 2009 Elliott Wave International<br />
This ebook includes handpicked lessons from more than 200 pages of EWI’s <strong>com</strong>prehensive<br />
Trader’s Classroom Collection of eBooks. Learn more here: http://www.elliottwave.<strong>com</strong>/wave/ClubTCC<br />
25