The Ultimate Technical Analysis Handbook - Tradingportalen.com
The Ultimate Technical Analysis Handbook - Tradingportalen.com
The Ultimate Technical Analysis Handbook - Tradingportalen.com

You also want an ePaper? Increase the reach of your titles
YUMPU automatically turns print PDFs into web optimized ePapers that Google loves.
Chapter 4 — Origins and Applications of the Fibonacci Sequence<br />
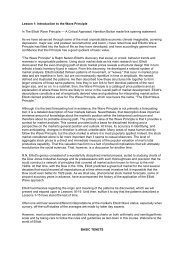
In Figure 32, we see that wave 5 was<br />
the extended wave within this impulsive<br />
sequence and that it pushed moderately<br />
above the 1.618 multiple of waves 1<br />
through 3 at 782 before reversing dramatically.<br />
For you die-hard technicians, that lonely<br />
little bar at the top of the chart just<br />
above 782 (February 20th) is an “island<br />
reversal.” (see Figure 30). This pattern<br />
occurs when the low on a bar is above<br />
the previous day’s high, and the high on<br />
the following day is below the preceding<br />
low. At highs, this chart pattern has<br />
a bearish implication, and vice versa at<br />
lows. Seeing this traditionally bearish<br />
chart pattern — especially when Elliott<br />
wave analysis identified a highly probable<br />
termination point for wave 5 — was<br />
a red flag for the ensuing decline.<br />
When wave one is the extended wave,<br />
waves three through five will tend toward<br />
a .618 relationship of the distance<br />
traveled in wave one.<br />
Figure 32<br />
Corrective Waves<br />
Corrective patterns fall into three categories:<br />
Zigzags, Flats and Triangles. You<br />
can project the probable path of Zigzags<br />
and Flats using the same method we use<br />
for impulsive moves as long as you observe<br />
that corrective patterns <strong>com</strong>monly<br />
involve different Fibonacci ratios.<br />
A Zigzag subdivides as 5-3-5. Five waves<br />
within wave A, three waves within wave<br />
B and five waves within wave C. Normally,<br />
Figure 33<br />
waves C and A will tend toward equality,<br />
much like waves five and one when wave three is extended (see Figure 33). Sometimes you will see wave C<br />
equal a 1.382 multiple of wave A or even a 1.618 multiple of wave A. When wave C equals a 1.618 multiple of<br />
wave A, and it is indeed a true corrective pattern, it can reflect increased volatility or imply that certain market<br />
participants are trying to stop out as many traders as they can before the correction is fully retraced.<br />
<strong>The</strong> <strong>Ultimate</strong> <strong>Technical</strong> <strong>Analysis</strong> <strong>Handbook</strong> — © 2009 Elliott Wave International<br />
This ebook includes handpicked lessons from more than 200 pages of EWI’s <strong>com</strong>prehensive<br />
Trader’s Classroom Collection of eBooks. Learn more here: http://www.elliottwave.<strong>com</strong>/wave/ClubTCC<br />
23