The Ultimate Technical Analysis Handbook - Tradingportalen.com
The Ultimate Technical Analysis Handbook - Tradingportalen.com
The Ultimate Technical Analysis Handbook - Tradingportalen.com

You also want an ePaper? Increase the reach of your titles
YUMPU automatically turns print PDFs into web optimized ePapers that Google loves.
Chapter 4 — Origins and Applications of the Fibonacci Sequence<br />
relevant Fibonacci retracement is usually<br />
shallow, .236 or .382. For example, in a<br />
contracting triangle where prices seem<br />
to chop around forever, wave e of the<br />
pattern will end at or near a .236 or .382<br />
retracement of wave three. When wave<br />
four is proportional in time to the first<br />
three waves, I find the .500 retracement<br />
significant. A fourth wave that consumes<br />
less time than wave two will often test<br />
the .618 retracement of wave three and<br />
suggests that more players are entering<br />
the market, as evidenced by the price<br />
volatility. And finally, in a fast market,<br />
like a “third of a third wave,” you’ll<br />
find that retracements are shallow, .236<br />
or .382.<br />
In closing, there are two things I would<br />
like to mention. First, in each of the ac<strong>com</strong>panying<br />
examples, you’ll notice that<br />
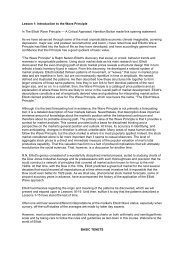
Figure 29<br />
retracement levels repeat. Within the decline from the February high in July Sugar (Figure 28), each countertrend<br />
move was a .618 retracement of the previous wave. Figure 29 demonstrates the same tendency with the<br />
.786 retracement. This event is <strong>com</strong>mon and is caused by the fractal nature of the markets.<br />
Second, Fibonacci retracements identify high probability targets for the termination of a wave; they do not<br />
represent an absolute must-hold level. So when using Fibonacci retracements, don’t be surprised to see prices<br />
reverse a few ticks above or below a Fibonacci target. This occurs because other traders are viewing the same<br />
levels and trade accordingly. Fibonacci retracements help to focus your attention on a specific price level at a<br />
specific time; how prices react at that point determines the significance of the level.<br />
[July 2003]<br />
2. How To Calculate Fibonacci Projections<br />
<strong>The</strong> Fibonacci ratio isn’t just helpful for labeling retracements that have already occurred, it’s equally helpful<br />
when projecting future market moves.<br />
Impulse Waves<br />
Beginning with impulse waves three and five, the primary Fibonacci ratios are 1.000, 1.618, 2.618 and 4.236.<br />
<strong>The</strong> most <strong>com</strong>mon Fibonacci multiples for third waves are 1.618, 2.618 and least often, 4.236. To calculate a<br />
wave-three projection, you take the distance traveled in wave one, multiply it by 1.618, and extend that sum<br />
from the extreme of wave two. <strong>The</strong> result is a high probability target for wave three.<br />
<strong>The</strong> <strong>Ultimate</strong> <strong>Technical</strong> <strong>Analysis</strong> <strong>Handbook</strong> — © 2009 Elliott Wave International<br />
This ebook includes handpicked lessons from more than 200 pages of EWI’s <strong>com</strong>prehensive<br />
Trader’s Classroom Collection of eBooks. Learn more here: http://www.elliottwave.<strong>com</strong>/wave/ClubTCC<br />
21