The Ultimate Technical Analysis Handbook - Tradingportalen.com
The Ultimate Technical Analysis Handbook - Tradingportalen.com
The Ultimate Technical Analysis Handbook - Tradingportalen.com

You also want an ePaper? Increase the reach of your titles
YUMPU automatically turns print PDFs into web optimized ePapers that Google loves.
Chapter 3 — How To Integrate <strong>Technical</strong> Indicators Into an Elliott Wave Forecast<br />
It also doesn’t matter whether you<br />
use simple, exponential, weighted or<br />
smoothed moving averages. <strong>The</strong> end<br />
result is the same: the averages <strong>com</strong>e<br />
together during periods of market contraction<br />
and move apart when the market<br />
expands. As with all my tools, this one<br />
works regardless of time frame or market.<br />
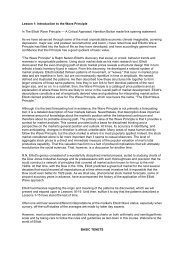
Figure 25 (Soybeans) is a 15-minute<br />
chart, where the moving averages <strong>com</strong>pressed<br />
on a number of occasions prior<br />
to sizable moves in price.<br />
I would love to say the concept of<br />
Moving Average Compression is my<br />
original idea, but I can’t. It is actually<br />
my variation of Daryl Guppy’s Multiple<br />
Moving Average indicator. His indicator<br />
is visually breathtaking, because it<br />
uses 12 exponential moving averages<br />
of different colors. I first encountered<br />
Guppy’s work in the February 1998 issue<br />
of <strong>Technical</strong> <strong>Analysis</strong> of Stocks and<br />
Commodities magazine. I highly re<strong>com</strong>mend<br />
the article.<br />
[DECEMBER 2004]<br />
Figure 24<br />
Figure 25<br />
<strong>The</strong> <strong>Ultimate</strong> <strong>Technical</strong> <strong>Analysis</strong> <strong>Handbook</strong> — © 2009 Elliott Wave International<br />
This ebook includes handpicked lessons from more than 200 pages of EWI’s <strong>com</strong>prehensive<br />
Trader’s Classroom Collection of eBooks. Learn more here: http://www.elliottwave.<strong>com</strong>/wave/ClubTCC<br />
18