The Ultimate Technical Analysis Handbook - Tradingportalen.com
The Ultimate Technical Analysis Handbook - Tradingportalen.com
The Ultimate Technical Analysis Handbook - Tradingportalen.com

You also want an ePaper? Increase the reach of your titles
YUMPU automatically turns print PDFs into web optimized ePapers that Google loves.
Chapter 3 — How To Integrate <strong>Technical</strong> Indicators Into an Elliott Wave Forecast<br />
3. How Moving Averages Can Alert You to Future Price Expansion<br />
I want to share with you one of my favorite<br />
trade set-ups, called Moving Average Compression<br />
(MAC). I like it because it consistently<br />
works, and you can customize it to your<br />
individual trading style and time frame.<br />
MAC is simply a concentration of moving<br />
averages with different parameters, and when<br />
it occurs on a price chart, the moving averages<br />
appear knotted like tangled strands of Christmas<br />
tree lights.<br />
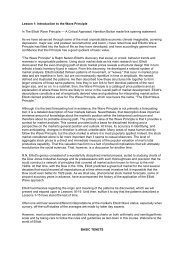
Let’s look at Figure 22 (Live Cattle). Here, you<br />
can see three different simple moving averages,<br />
which are based on Fibonacci numbers (13,<br />
21 and 34). <strong>The</strong> points where these moving<br />
averages <strong>com</strong>e together and seemingly form<br />
one line for a period of time is what I refer to<br />
as Moving Average Compression.<br />
Moving Average Compression works so well in<br />
identifying trade set-ups because it represents<br />
Figure 22<br />
periods of market contraction. As we know,<br />
because of the Wave Principle, after markets<br />
expand, they contract (when a five-wave move<br />
is <strong>com</strong>plete, prices retrace a portion of this<br />
move in three waves). MAC alerts you to those<br />
periods of price contraction. And since this<br />
state of price activity can’t be sustained, MAC<br />
is also precursor to price expansion.<br />
Notice early April in Figure 22 (Live Cattle),<br />
when the three simple moving averages I’m<br />
using formed what appears to be a single line<br />
and did so for a number of trading days. This<br />
kind of <strong>com</strong>pression shows us that a market<br />
has contracted, and therefore will soon expand<br />
— which is exactly what Live Cattle did<br />
throughout the months of April and May.<br />
I also like MAC because it is such a flexible<br />
Figure 23<br />
tool — it doesn’t matter what parameters you<br />
use. You can use very long-period moving averages as shown in Figure 23 (Coffee) or multiple moving averages<br />
as shown on the next page in Figure 24 (Feeder Cattle), and you will still find MAC signals.<br />
<strong>The</strong> <strong>Ultimate</strong> <strong>Technical</strong> <strong>Analysis</strong> <strong>Handbook</strong> — © 2009 Elliott Wave International<br />
This ebook includes handpicked lessons from more than 200 pages of EWI’s <strong>com</strong>prehensive<br />
Trader’s Classroom Collection of eBooks. Learn more here: http://www.elliottwave.<strong>com</strong>/wave/ClubTCC<br />
17