The Ultimate Technical Analysis Handbook - Tradingportalen.com
The Ultimate Technical Analysis Handbook - Tradingportalen.com
The Ultimate Technical Analysis Handbook - Tradingportalen.com

Create successful ePaper yourself
Turn your PDF publications into a flip-book with our unique Google optimized e-Paper software.
Chapter 3 — How To Integrate <strong>Technical</strong> Indicators Into an Elliott Wave Forecast<br />
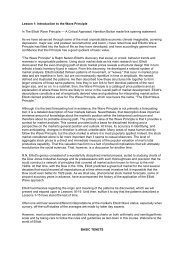
You Can Identify Triangles<br />
MACD can also help you identify triangles.<br />
In Figures 20 and 21 (Pork Bellies and Sugar)<br />
you’ll see contracting triangle wave patterns.<br />
MACD traces out similar patterns that are<br />
concentrated around the zero-line. In other<br />
words, triangles in price often correspond to<br />
a flattened MACD near zero.<br />
Overall, my love-hate relationship with technical<br />
indicators like MACD has worked out<br />
well, so long as I’ve remembered not to get too<br />
caught up in using them. I hope that you will<br />
find some of your own reasons to love them,<br />
too, but I do want to caution you that you can<br />
get burned if you be<strong>com</strong>e too enamored with<br />
them. Remember, it’s price that brought you<br />
to this dance, and you should always dance<br />
with the one that brung you.<br />
[NOVEMBER 2004]<br />
Figure 20<br />
Figure 21<br />
<strong>The</strong> <strong>Ultimate</strong> <strong>Technical</strong> <strong>Analysis</strong> <strong>Handbook</strong> — © 2009 Elliott Wave International<br />
This ebook includes handpicked lessons from more than 200 pages of EWI’s <strong>com</strong>prehensive<br />
Trader’s Classroom Collection of eBooks. Learn more here: http://www.elliottwave.<strong>com</strong>/wave/ClubTCC<br />
16