The Ultimate Technical Analysis Handbook - Tradingportalen.com
The Ultimate Technical Analysis Handbook - Tradingportalen.com
The Ultimate Technical Analysis Handbook - Tradingportalen.com

Create successful ePaper yourself
Turn your PDF publications into a flip-book with our unique Google optimized e-Paper software.
Chapter 3 — How To Integrate <strong>Technical</strong> Indicators Into an Elliott Wave Forecast<br />
You Can Count Corrective Waves and<br />
Time Reversals<br />
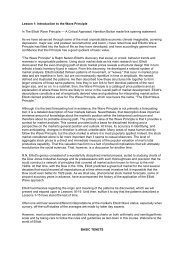
MACD also helps to identify the end<br />
of corrective waves. In Figure 18 (Live<br />
Cattle), you can see a three-wave decline.<br />
If you examine MACD, you’ll see<br />
that although wave C pushed below the<br />
extreme of wave A in price, the MACD<br />
reading for wave C was above the wave<br />
A level.<br />
Figure 19 (Corn) illustrates another<br />
example. As you can see, the MACD<br />
reading for wave C is below that which<br />
occurred in wave A, creating a small but<br />
significant divergence. Since it can be<br />
difficult to see corrective waves while<br />
they’re happening, it helps to use MACD<br />
as a back up.<br />
Figure 18<br />
Figure 19<br />
<strong>The</strong> <strong>Ultimate</strong> <strong>Technical</strong> <strong>Analysis</strong> <strong>Handbook</strong> — © 2009 Elliott Wave International<br />
This ebook includes handpicked lessons from more than 200 pages of EWI’s <strong>com</strong>prehensive<br />
Trader’s Classroom Collection of eBooks. Learn more here: http://www.elliottwave.<strong>com</strong>/wave/ClubTCC<br />
15