The Ultimate Technical Analysis Handbook - Tradingportalen.com
The Ultimate Technical Analysis Handbook - Tradingportalen.com
The Ultimate Technical Analysis Handbook - Tradingportalen.com

You also want an ePaper? Increase the reach of your titles
YUMPU automatically turns print PDFs into web optimized ePapers that Google loves.
Chapter 3 — How To Integrate <strong>Technical</strong> Indicators Into an Elliott Wave Forecast<br />
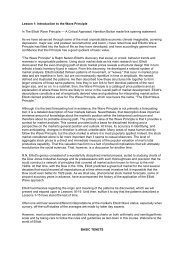
Figures 16 and 17 (Pork Bellies and<br />
Soybeans) show important variations on<br />
the same theme. Notice how wave four<br />
in Pork Bellies coincided with our Zero-<br />
Line Reversal, which I discussed in the<br />
previous lesson. Figure 17 (Soybeans),<br />
shows a five-wave decline that’s similar<br />
to the five-wave rallies shown in Figures<br />
15 and 16. Together, these charts should<br />
give you a good sense of how MACD can<br />
help you count Elliott impulse waves on<br />
a price chart.<br />
Figure 16<br />
Figure 17<br />
<strong>The</strong> <strong>Ultimate</strong> <strong>Technical</strong> <strong>Analysis</strong> <strong>Handbook</strong> — © 2009 Elliott Wave International<br />
This ebook includes handpicked lessons from more than 200 pages of EWI’s <strong>com</strong>prehensive<br />
Trader’s Classroom Collection of eBooks. Learn more here: http://www.elliottwave.<strong>com</strong>/wave/ClubTCC<br />
14