The Ultimate Technical Analysis Handbook - Tradingportalen.com
The Ultimate Technical Analysis Handbook - Tradingportalen.com
The Ultimate Technical Analysis Handbook - Tradingportalen.com

Create successful ePaper yourself
Turn your PDF publications into a flip-book with our unique Google optimized e-Paper software.
Chapter 3 — How To Integrate <strong>Technical</strong> Indicators Into an Elliott Wave Forecast<br />
2. How To Use <strong>Technical</strong> Indicators To Confirm Elliott Wave Counts<br />
Top Reason To Love <strong>Technical</strong> Indicators<br />
<strong>The</strong> previous lesson points out one of the redeeming features of technical studies: You can identify potential<br />
trade setups using MACD to find Hooks, Slingshots and Zero-Line Reversals (ZLR). In this lesson, I’m going<br />
to continue our examination of MACD, and I’ve saved the best for last. <strong>The</strong> No. 1 reason to love technical indicators<br />
is that you can use one like MACD to count Elliott waves. Let me count the ways (and the waves):<br />
You Can Count Impulse Waves and Identify Wave 3 Extremes<br />
Often, an extreme reading in MACD will<br />
correspond to the extreme of wave three.<br />
This correlation appears when MACD<br />
tests zero in wave four, prior to the development<br />
of wave five. During a typical<br />
wave five, the MACD reading will be<br />
smaller in magnitude than it was during<br />
wave three, creating what is <strong>com</strong>monly<br />
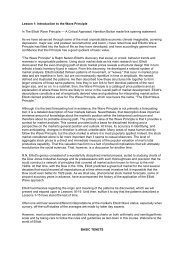
referred to as divergence. An example is<br />
illustrated in Figure 15 (Sugar).<br />
In this chart, you can see how the extreme<br />
reading in MACD is in line with<br />
the top of wave three, which occurred in<br />
July. MACD pulled back to zero in wave<br />
four before turning up in wave five. And<br />
though sugar prices were higher at the<br />
end of wave 0 than at the end of wave<br />
8, MACD readings during wave 0 fell<br />
far short of their wave 8 peak.<br />
So remember that within a five-wave<br />
move, there are three MACD signals to<br />
look for:<br />
1. Wave three normally corresponds<br />
to an extreme reading in<br />
MACD.<br />
2. Wave four ac<strong>com</strong>panies a test of<br />
zero.<br />
3. Wave five pushes prices to a new<br />
extreme while MACD yields<br />
a lower reading than what occurred<br />
in wave three.<br />
Figure 15<br />
<strong>The</strong> <strong>Ultimate</strong> <strong>Technical</strong> <strong>Analysis</strong> <strong>Handbook</strong> — © 2009 Elliott Wave International<br />
This ebook includes handpicked lessons from more than 200 pages of EWI’s <strong>com</strong>prehensive<br />
Trader’s Classroom Collection of eBooks. Learn more here: http://www.elliottwave.<strong>com</strong>/wave/ClubTCC<br />
13