June 2012 Special Report on Bonds, FREE - Elliott Wave International
June 2012 Special Report on Bonds, FREE - Elliott Wave International
June 2012 Special Report on Bonds, FREE - Elliott Wave International

You also want an ePaper? Increase the reach of your titles
YUMPU automatically turns print PDFs into web optimized ePapers that Google loves.
© <str<strong>on</strong>g>June</str<strong>on</strong>g> 6, <str<strong>on</strong>g>2012</str<strong>on</strong>g><br />
Written by Prechter, Hochberg and Kendall<br />
<str<strong>on</strong>g>Special</str<strong>on</strong>g> <str<strong>on</strong>g>Report</str<strong>on</strong>g><br />
major top in the b<strong>on</strong>d market:<br />
BOND YIELDS ARE POISED TO BEGIN RISING<br />
ON THE WAY TO DEFLATIONARY CREDIT CRISIS<br />
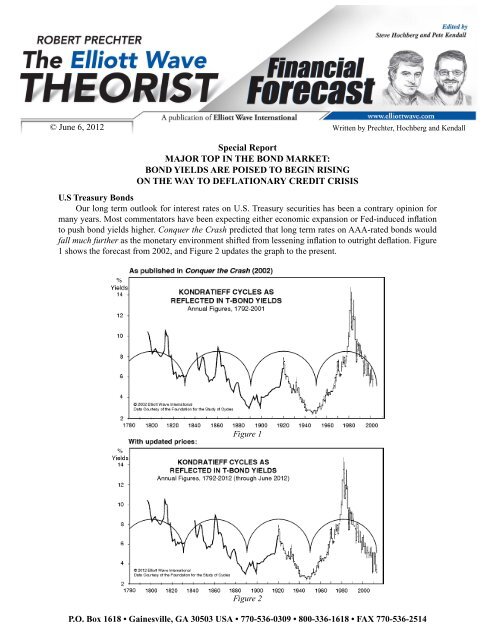
U.S Treasury B<strong>on</strong>ds<br />
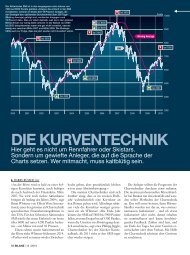
Our l<strong>on</strong>g term outlook for interest rates <strong>on</strong> U.S. Treasury securities has been a c<strong>on</strong>trary opini<strong>on</strong> for<br />
many years. Most commentators have been expecting either ec<strong>on</strong>omic expansi<strong>on</strong> or Fed-induced inflati<strong>on</strong><br />
to push b<strong>on</strong>d yields higher. C<strong>on</strong>quer the Crash predicted that l<strong>on</strong>g term rates <strong>on</strong> AAA-rated b<strong>on</strong>ds would<br />
fall much further as the m<strong>on</strong>etary envir<strong>on</strong>ment shifted from lessening inflati<strong>on</strong> to outright deflati<strong>on</strong>. Figure<br />
1 shows the forecast from 2002, and Figure 2 updates the graph to the present.<br />
Figure 1<br />
Figure 2<br />
P.O. Box 1618 • Gainesville, GA 30503 USA • 770-536-0309 • 800-336-1618 • FAX 770-536-2514
<strong>Elliott</strong> <strong>Wave</strong> <str<strong>on</strong>g>Special</str<strong>on</strong>g> <str<strong>on</strong>g>Report</str<strong>on</strong>g>—<str<strong>on</strong>g>June</str<strong>on</strong>g> 6, <str<strong>on</strong>g>2012</str<strong>on</strong>g><br />
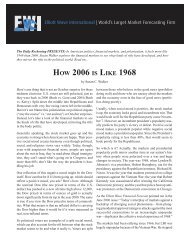
In line with our forecast, the interest rate <strong>on</strong> the Treasury’s 10-year note has just plunged to the lowest<br />
level in U.S. history. The decline from 1981 to the present is a stunning 91%. Figure 3 shows a close-up of<br />
the entire move.<br />
Those predicting ec<strong>on</strong>omic expansi<strong>on</strong> or hyperinflati<strong>on</strong> have been unable to explain this persistent<br />
plunge. Yet each of these camps got exactly the “fundamentals” they expected: record m<strong>on</strong>etizati<strong>on</strong> by the<br />
Fed (advocated by the m<strong>on</strong>etarists) and record spending by government (advocated by the Keynesians).<br />
Rates ignored these events and c<strong>on</strong>tinued to fall.<br />
For the past ten years, many high-profile investors have hated b<strong>on</strong>ds. When interviewed, they would<br />
say that the <strong>on</strong>e sure bet was that rates would rise and b<strong>on</strong>d prices would fall. Those betting against b<strong>on</strong>ds<br />
have lost a lot of m<strong>on</strong>ey, especially since 2009.<br />
Under the <strong>Elliott</strong> wave model, five-wave patterns occur in the directi<strong>on</strong> of the main trend, and countertrend<br />
moves trace out three-wave patterns. Interest rates do not follow the <strong>Elliott</strong> wave model as well as stock<br />
averages, which are more resp<strong>on</strong>sive to overall social mood. Rates are the price of just <strong>on</strong>e thing: m<strong>on</strong>ey. But<br />
it is still interesting to see how many five-wave patterns unfolded in the same directi<strong>on</strong> as the l<strong>on</strong>g decline<br />
over the past 31 years, as labeled in Figure 3.<br />
Figure 3<br />
2
<strong>Elliott</strong> <strong>Wave</strong> <str<strong>on</strong>g>Special</str<strong>on</strong>g> <str<strong>on</strong>g>Report</str<strong>on</strong>g>—<str<strong>on</strong>g>June</str<strong>on</strong>g> 6, <str<strong>on</strong>g>2012</str<strong>on</strong>g><br />
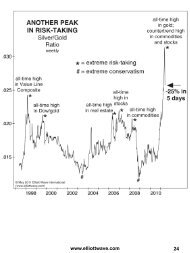
In the Great Depressi<strong>on</strong>, interest rates <strong>on</strong> lower-grade b<strong>on</strong>ds trended lower until 1930, and those <strong>on</strong><br />
high-grade b<strong>on</strong>ds c<strong>on</strong>tinued lower until 1931. Then they soared, <strong>on</strong> fears of default. Figure 4, published in<br />
C<strong>on</strong>quer the Crash, shows what happened. (The chart shows rates inverted to reflect b<strong>on</strong>d prices.)<br />
During the Great Depressi<strong>on</strong>, b<strong>on</strong>d prices finally bottomed, and interest rates peaked, in <str<strong>on</strong>g>June</str<strong>on</strong>g> 1932 (see<br />
Figure 4); stocks bottomed in July; and those years’ <strong>on</strong>ly freely traded (semi-)m<strong>on</strong>etary metal, silver, bottomed<br />
in December. Following expectati<strong>on</strong>s under soci<strong>on</strong>omic theory, the ec<strong>on</strong>omy bottomed afterward, in the first<br />
quarter of 1933. If the same sequence occurs again, rates should peak first, stock prices should bottom next,<br />
and individual commodities should make lows throughout the period, with some of them bottoming last.<br />
Finally the ec<strong>on</strong>omy will hit bottom.<br />
The preceding peak rate of inflati<strong>on</strong> in that cycle occurred in late 1919/early 1920, so the time between<br />
the extremes was just shy of 13 years. In the current cycle, the grand change from the maximum rate of<br />
inflati<strong>on</strong> to a maximum rate of deflati<strong>on</strong> seems to be <strong>on</strong> track to c<strong>on</strong>sume approximately a Fib<strong>on</strong>acci 34<br />
years (+ or – 1 year). From as far back as 2001, using several time-forecasting approaches, EWT has forecast<br />
that the final stock market bottom would occur in 2016. This timing suggests a peak rate of deflati<strong>on</strong> in<br />
Figure 4<br />
3
<strong>Elliott</strong> <strong>Wave</strong> <str<strong>on</strong>g>Special</str<strong>on</strong>g> <str<strong>on</strong>g>Report</str<strong>on</strong>g>—<str<strong>on</strong>g>June</str<strong>on</strong>g> 6, <str<strong>on</strong>g>2012</str<strong>on</strong>g><br />
or near 2015, a bit ahead of the low in<br />
stocks. Although we tentatively expect the<br />
bottoming sequence to take place between<br />
2015 and 2017, the sequence per se is more<br />
certain than its timing.<br />
One might think that interest rates will<br />
therefore fall until around 2016. But they<br />
w<strong>on</strong>’t. The reas<strong>on</strong> is that borrowers are going<br />
to default.<br />
Investors think that the issuers of all<br />
the b<strong>on</strong>ds they are buying will stay solvent<br />
and pay both interest and principal. We<br />
d<strong>on</strong>’t think so. We think the ec<strong>on</strong>omy is still<br />
sliding into depressi<strong>on</strong>, and when that trend<br />
accelerates, investors’ waxing fears will<br />
cause them to start selling b<strong>on</strong>ds, which will<br />
lead to lower b<strong>on</strong>d prices and higher yields.<br />
Investor psychology should work<br />
like this: As positive social mood initially<br />
retreats, investors looking for a haven buy<br />
b<strong>on</strong>ds that they perceive to be safe. But<br />
as social mood c<strong>on</strong>tinues to trend toward<br />
the negative, fear increases, deflati<strong>on</strong><br />
accelerates, the incomes of businesses and<br />
governments decline, and b<strong>on</strong>d investors<br />
begin to worry about losing their principal<br />
due to bankruptcy and default by b<strong>on</strong>d<br />
issuers. That’s when they start selling b<strong>on</strong>ds,<br />
and rates begin to rise. Rates <strong>on</strong> the weakest<br />
issues rise first, but eventually fear spreads<br />
to holders even of formerly presumed safe<br />
paper. Finally, the ec<strong>on</strong>omy c<strong>on</strong>tracts so<br />
severely that it reaches depressi<strong>on</strong>, wiping<br />
Figure 5<br />
out many debtors and, in the process, many creditors as well.<br />
In the current cycle, low-grade b<strong>on</strong>d yields have yet to begin climbing. As shown in Figure 5 (again with<br />
the scale inverted), yields for the Baa group have been moving lower right al<strong>on</strong>g with those for Treasuries.<br />
Commentators are saying that investors’ sustained move into b<strong>on</strong>ds is a sign of fear. But in line with c<strong>on</strong>tinued<br />
predicti<strong>on</strong>s of a “sustained but slow ec<strong>on</strong>omic recovery,” b<strong>on</strong>d buyers have reached a state of epic complacency<br />
in the belief that all of these b<strong>on</strong>ds are safe. As we will see in Figure 9, the spread between rates <strong>on</strong> T-b<strong>on</strong>ds<br />
and Baa corporates has been quietly widening for nearly a year. This is a subtle warning of trouble ahead<br />
for the high-yield sector. At this point, we still cannot place “peak” arrows <strong>on</strong> Figure 5 as there are <strong>on</strong> the<br />
1930s versi<strong>on</strong> in Figure 4. But we should be able to do so so<strong>on</strong>.<br />
Figure 6 shows the history of the B<strong>on</strong>d Buyer index of 40 corporate b<strong>on</strong>ds during the Great Depressi<strong>on</strong>.<br />
Figure 7 shows the history of its modern equivalent, the B<strong>on</strong>d Buyer 20-b<strong>on</strong>d index. B<strong>on</strong>d prices today seem<br />
poised to do what their predecessors did: plunge.<br />
In early 1932, prices <strong>on</strong> these b<strong>on</strong>ds fell below—and rates rose above—those registered at the preceding<br />
peak rate of inflati<strong>on</strong> in 1920. This is a good reas<strong>on</strong> to expect interest rates <strong>on</strong> these b<strong>on</strong>ds in coming years<br />
to rise above those of 1981, i.e. above 16%.<br />
4
<strong>Elliott</strong> <strong>Wave</strong> <str<strong>on</strong>g>Special</str<strong>on</strong>g> <str<strong>on</strong>g>Report</str<strong>on</strong>g>—<str<strong>on</strong>g>June</str<strong>on</strong>g> 6, <str<strong>on</strong>g>2012</str<strong>on</strong>g><br />
Figure 6<br />
Figure 7<br />
5
<strong>Elliott</strong> <strong>Wave</strong> <str<strong>on</strong>g>Special</str<strong>on</strong>g> <str<strong>on</strong>g>Report</str<strong>on</strong>g>—<str<strong>on</strong>g>June</str<strong>on</strong>g> 6, <str<strong>on</strong>g>2012</str<strong>on</strong>g><br />
The questi<strong>on</strong> is, when will rates begin rising in this cycle? We think the answer is “now.” Evidence is<br />
rapidly mounting that the trend in interest rates <strong>on</strong> high-grade debt is poised to reverse:<br />
1. As shown in Figure 3, the latest drop in yield has traced out five waves into Friday’s new low as b<strong>on</strong>d<br />
futures hit a new all-time high of 152½. This plunge in rates should mark at least a bottom and probably<br />
the bottom.<br />
2. The public has been buying a lot of U.S. government b<strong>on</strong>ds since 2002, as shown in Figure 8. Investors<br />
stayed enamored of government b<strong>on</strong>d funds in 2011 while selling into the stock rally. The public loved<br />
real estate at the top; it loved stocks at the top; it loved commodities at the top; it loved silver at the<br />
top; and it loved gold at the top. What do you think it means now that the public is heavily invested in<br />
U.S. government b<strong>on</strong>ds?<br />
3. The Commitment of Traders report shows that Large Speculators have become heavily invested in<br />
T-b<strong>on</strong>d futures (see Figure 9). Large Specs are not always wr<strong>on</strong>g, but they are usually wr<strong>on</strong>g when<br />
they follow a trend. The asterisks in Figure 9 show times when their buying or selling was in c<strong>on</strong>cert<br />
with the trend, and in those cases the market was approaching a reversal.<br />
4. According to the Daily Sentiment Index (courtesy trade-futures.com), there were 97% bulls am<strong>on</strong>g<br />
futures traders <strong>on</strong> Friday. This is the third-highest reading <strong>on</strong> record. (It reached 99% in December<br />
2008, at the spike high in T-b<strong>on</strong>ds following Fed’s pledge to buy them.) The DSI reached 90% bulls in<br />
<str<strong>on</strong>g>June</str<strong>on</strong>g> 2011, and except for a brief period in January-March it has been near the 90% level for much of<br />
the past year. This is both an extreme level and a lengthy period of bullish sentiment.<br />
5. T-b<strong>on</strong>ds have enjoyed their l<strong>on</strong>gest and biggest bull market <strong>on</strong> record. There are no guarantees in life<br />
or investing, but we are pretty sure that buying an extended market after three decades of rise is not<br />
a good idea. Regardless of whether our m<strong>on</strong>etary and ec<strong>on</strong>omic expectati<strong>on</strong>s turn out right, the bull<br />
market in b<strong>on</strong>ds is aged and ripe for reversal.<br />
If rates do begin to rise as we expect, most observers will probably be fooled. Bulls <strong>on</strong> the ec<strong>on</strong>omy may<br />
take the new trend as a sign of ec<strong>on</strong>omic expansi<strong>on</strong>. Those betting <strong>on</strong> hyperinflati<strong>on</strong> may take it as a sign<br />
that inflati<strong>on</strong> is ready to soar. But the real reas<strong>on</strong> for the coming rise in rates will be that investors will be<br />
Figure 8<br />
6
<strong>Elliott</strong> <strong>Wave</strong> <str<strong>on</strong>g>Special</str<strong>on</strong>g> <str<strong>on</strong>g>Report</str<strong>on</strong>g>—<str<strong>on</strong>g>June</str<strong>on</strong>g> 6, <str<strong>on</strong>g>2012</str<strong>on</strong>g><br />
Figure 9<br />
selling b<strong>on</strong>ds and demanding higher rates due to fear of default. We have seen this development already in<br />
the debt paper of Greece and other weak debtors. It should so<strong>on</strong> seep over to the str<strong>on</strong>ger debtors.<br />
You might think that the U.S. government is the str<strong>on</strong>gest sovereign debtor. It isn’t. Eight other<br />
governments pay lower rates <strong>on</strong> their 10-year notes. The U.S. 10-year yield hit a low of 1.438% <strong>on</strong> Friday,<br />
its lowest level ever. But the yields <strong>on</strong> comparable b<strong>on</strong>ds elsewhere are lower: Singapore 1.37%, Taiwan and<br />
Germany 1.17%, Sweden 1.11%, Denmark 0.93%, H<strong>on</strong>g K<strong>on</strong>g 0.88%, Japan 0.80% and Switzerland 0.47%.<br />
The coming fear of default will not be misplaced. With a turn of Grand Supercycle degree behind us, the<br />
unfolding depressi<strong>on</strong> will be deeper than that of the early 1930s. Most debtors around the world will default.<br />
The Coming Yield-Spread Explosi<strong>on</strong><br />
In January 2005, two m<strong>on</strong>ths before the spread between the 30-year U.S. Treasury b<strong>on</strong>d yield and the<br />
Moody’s Corporate Baa b<strong>on</strong>d yield reached its narrowest extreme in years, EWFF said, “Typically, such<br />
complacency [toward riskier assets] is a precursor to a large and persistent move” in the opposite directi<strong>on</strong>.<br />
By the end of March, the spread between low-grade and high-grade debt yields had begun to widen. EWFF<br />
that m<strong>on</strong>th called for a move to record wide levels. In the last quarter of 2008, the widest spread since the<br />
7
<strong>Elliott</strong> <strong>Wave</strong> <str<strong>on</strong>g>Special</str<strong>on</strong>g> <str<strong>on</strong>g>Report</str<strong>on</strong>g>—<str<strong>on</strong>g>June</str<strong>on</strong>g> 6, <str<strong>on</strong>g>2012</str<strong>on</strong>g><br />
incepti<strong>on</strong> of 30-year Treasuries<br />
in the 1970s was achieved in<br />
c<strong>on</strong>juncti<strong>on</strong> with Primary wave<br />
1 down in stocks. Figure 10<br />
shows this event.<br />
Like so many financial<br />
assets, high yield b<strong>on</strong>ds rose<br />
in 2009-2010 as stocks rallied<br />
in wave 2. In January 2011,<br />
EWFF noted that b<strong>on</strong>d fund<br />
managers were aggressively<br />
citing an improved risk<br />
envir<strong>on</strong>ment and touting junk<br />
b<strong>on</strong>ds as a reliable place to grab<br />
a little extra yield. We countered<br />
with the following assessment:<br />
The perceived lack of<br />
alternatives is creating<br />
what may be the costliest<br />
mistake in the history of<br />
investments—reaching<br />
for yield at the <strong>on</strong>set of a<br />
depressi<strong>on</strong>. When near-term manifestati<strong>on</strong>s<br />
of mood turn back toward increasing<br />
pessimism, this spread should widen to a<br />
historic extreme.<br />
Figure 10<br />
The narrowing between rates <strong>on</strong> low- and<br />
high-grade debt reached its extreme in July<br />
2011, three m<strong>on</strong>ths after the tops in the<br />
NYSE Composite stock index, the CRB<br />
Commodities index, foreign currencies and<br />
silver. As Figure 10 shows, the spread made<br />
a lower high in early April <str<strong>on</strong>g>2012</str<strong>on</strong>g>, coinciding<br />
with the highs in the Dow, S&P and NASDAQ.<br />
It is now <strong>on</strong> the verge of widening past its<br />
October 4, 2011 level. The recent <str<strong>on</strong>g>June</str<strong>on</strong>g> issue<br />
of EWFF reiterated that a move toward record<br />
widening remains the bedrock of our b<strong>on</strong>d<br />
market forecast. During Primary 3 down<br />
in stocks, the spread between low-grade and<br />
high-grade debt should exceed the extreme<br />
reached in late 2008.<br />
The recent spike in high-yield mutual<br />
fund inflows (per the bottom graph in Figure<br />
11) shows that investors c<strong>on</strong>tinued to reach<br />
for yield through the final rally in stocks.<br />
It’s been said that junk b<strong>on</strong>ds are simply<br />
equities in drag since they are the riskiest<br />
class of debt securities, and this chart bears<br />
that label out. It sports tops in 1989, which is Figure 11<br />
8
<strong>Elliott</strong> <strong>Wave</strong> <str<strong>on</strong>g>Special</str<strong>on</strong>g> <str<strong>on</strong>g>Report</str<strong>on</strong>g>—<str<strong>on</strong>g>June</str<strong>on</strong>g> 6, <str<strong>on</strong>g>2012</str<strong>on</strong>g><br />
close to a major peak in the Dow Transports;<br />
April 1999, three m<strong>on</strong>ths ahead of the peak<br />
in the Real-M<strong>on</strong>ey Dow (Dow/gold); and<br />
May 2007, just two m<strong>on</strong>ths before the Dow<br />
J<strong>on</strong>es Composite average topped and five<br />
m<strong>on</strong>ths before stocks started plunging. That<br />
bear market led to credit spreads reaching the<br />
record levels shown in Figure 10.<br />
Per Figure 11, however, the collapse<br />
failed to drive total assets in high-yield<br />
b<strong>on</strong>d funds beneath their low of July 2002,<br />
no doubt because investors were (and still<br />
are) perceiving all grades of b<strong>on</strong>ds as their<br />
new safe haven. From that time forward,<br />
total assets in high-yield b<strong>on</strong>d funds more<br />
than doubled and c<strong>on</strong>tinued to expand right<br />
through April <str<strong>on</strong>g>2012</str<strong>on</strong>g>, our last available data<br />
point. The evidence presented in recent issues<br />
Figure 12<br />
of EWT and EWFF indicates that stocks<br />
completed an important peak in May,<br />
so total junk b<strong>on</strong>d assets should turn<br />
lower in a coincident reversal, just as<br />
they have at past equity reversals. The<br />
five-wave rally pattern, shown by the<br />
labels in Figure 11, fits our case that<br />
the impending downturn will be bigger<br />
than any of the declines over the last 30<br />
years. In the not-too-distant future, junk<br />
will finally live up to its name.<br />
Figure 12 shows the relentless,<br />
8-fold rise in total b<strong>on</strong>d fund assets over<br />
the past 22 years. It is a stunning picture,<br />
reminiscent of the 18-year rise in stocks<br />
from 1982 to 2000. The sharpest rally to<br />
date began in October 2008, as investors<br />
sought an alternative to stocks. We<br />
expect wave 3 to destroy the belief in<br />
all havens except cash.<br />
The l<strong>on</strong>g rise in retail demand for<br />
higher-yielding b<strong>on</strong>d funds supports<br />
our case for a historic retreat from<br />
risky debt. According to the Investment<br />
Company Institute’s l<strong>on</strong>g-term-b<strong>on</strong>d<br />
fund data, which go back to 1984,<br />
investors became increasingly f<strong>on</strong>d of<br />
more speculative b<strong>on</strong>ds versus U.S.<br />
n<strong>on</strong>-mortgage, federal government<br />
b<strong>on</strong>ds over the course of the bull market.<br />
Figure 13 shows the ratio of total assets Figure 13<br />
9
<strong>Elliott</strong> <strong>Wave</strong> <str<strong>on</strong>g>Special</str<strong>on</strong>g> <str<strong>on</strong>g>Report</str<strong>on</strong>g>—<str<strong>on</strong>g>June</str<strong>on</strong>g> 6, <str<strong>on</strong>g>2012</str<strong>on</strong>g><br />
in riskier funds holding corporate, high yield and mortgage debt to assets in n<strong>on</strong>-mortgage, federal government<br />
b<strong>on</strong>d funds. In the 1990s, with the mania for equities at its most intense, investors’ preference for riskier<br />
b<strong>on</strong>ds rose persistently. An initial high in the ratio came in February 2000, <strong>on</strong>e m<strong>on</strong>th after the Dow’s peak<br />
and a m<strong>on</strong>th before the NASDAQ’s all-time high. A decline followed, reaching a low in March 2003, when<br />
the World Stock Index bottomed. The ratio’s ensuing rise ended in May 2007, as the accompanying rally<br />
in stocks neared its endpoint. The most recent rise started in December 2008, three m<strong>on</strong>ths before the start<br />
of the latest advance in stocks. It ended a year ago, with the assets of riskier b<strong>on</strong>d funds reaching a record<br />
4.7 times those held in less-risky government-b<strong>on</strong>d funds in <str<strong>on</strong>g>June</str<strong>on</strong>g> 2011. So, after faithfully reflecting the<br />
general directi<strong>on</strong> of the stock market through <str<strong>on</strong>g>June</str<strong>on</strong>g> 2011, the ratio has failed to approach last year’s peak.<br />
This is a key divergence from the pattern of events over the course of the Grand Supercycle topping process<br />
(see charts, May <str<strong>on</strong>g>2012</str<strong>on</strong>g> EWT) and another sign of the exhausti<strong>on</strong> that’s been overtaking the financial markets<br />
since May 2011. (For a full descripti<strong>on</strong>, see this m<strong>on</strong>th’s EWFF.) The ratio will undoubtedly c<strong>on</strong>tinue to<br />
head in its new directi<strong>on</strong>. This does not mean, however, that government b<strong>on</strong>d prices will c<strong>on</strong>tinue to rally.<br />
The unfolding deflati<strong>on</strong> will be murder <strong>on</strong> the debt of companies and governments alike. But most corporate<br />
and mortgage b<strong>on</strong>ds will perform worse than Treasury b<strong>on</strong>ds, so investors are likely to shift their preference<br />
from the former to the latter.<br />
During the coming collapse in the value of debt, investors’ interest in diversified funds of all stripes—<br />
debt, equity and commodity—will fall precipitously. The drop will come as a shock, especially to those who<br />
“rebalanced” from stocks and commodities to b<strong>on</strong>ds after the markets panicked in 2008.<br />
What To Do<br />
Generally speaking, if you are invested in l<strong>on</strong>g-term debt, sell it. Avoid high-yield b<strong>on</strong>ds like the<br />
plague. Stay away from most municipal, corporate, government agency and now even Treasury b<strong>on</strong>ds. A<br />
select few entities will be able to generate the necessary cash flow to defy an otherwise universal rise in<br />
yields. Discerning them will be difficult. Good candidates seem to be the governments of Switzerland and<br />
Singapore, the State of Nebraska and Microsoft Corp., but we are not complacent about any of them. If you<br />
have substantial assets in l<strong>on</strong>g term Treasuries and want to keep them, <strong>on</strong>e good strategy would be to sell<br />
short an offsetting amount of junk b<strong>on</strong>ds, thereby aligning your portfolio for a c<strong>on</strong>tinued widening of the<br />
spread between the two. If you wish to hold any unhedged debt, make it short term debt. T-bill rates have<br />
been stuck near zero, but if rates overall begin to rise, b<strong>on</strong>dholders will lose m<strong>on</strong>ey while bill holders will<br />
benefit by rolling c<strong>on</strong>tinually into higher and higher yields. At the end, the U.S. government might default,<br />
so do not c<strong>on</strong>sider this a permanent strategy. It’s <strong>on</strong>ly a last debt-based strategy until the ultimate crisis. We<br />
have already recommended substantial holdings of outright cash. But at some point, it will be time to c<strong>on</strong>vert<br />
even the safest debt instruments to cash and/or gold.<br />
The <strong>Elliott</strong> <strong>Wave</strong> Theorist and The <strong>Elliott</strong> <strong>Wave</strong> Financial Forecast are published by <strong>Elliott</strong> <strong>Wave</strong> Internati<strong>on</strong>al,<br />
Inc. Mail: P.O. Box 1618, Gainesville, Georgia, 30503, U.S.A. Ph<strong>on</strong>e: 770-536-0309. All<br />
c<strong>on</strong>tents copyright ©<str<strong>on</strong>g>2012</str<strong>on</strong>g> <strong>Elliott</strong> <strong>Wave</strong> Internati<strong>on</strong>al, Inc. Reproducti<strong>on</strong>, retransmissi<strong>on</strong> or redistributi<strong>on</strong><br />
in any form is illegal and strictly forbidden, as is c<strong>on</strong>tinuous and regular disseminati<strong>on</strong> of specific forecasts<br />
or strategies. Otherwise, feel free to quote, cite or review if full credit is given. Typos and other such<br />
errors are corrected in the <strong>on</strong>line versi<strong>on</strong>, which is the official final versi<strong>on</strong> of each issue.<br />
The <strong>Elliott</strong> <strong>Wave</strong> Principle is a detailed descripti<strong>on</strong> of how financial markets behave. The descripti<strong>on</strong> reveals that mass psychology swings from pessimism<br />
to optimism and back in a natural sequence, creating specific <strong>Elliott</strong> wave patterns in price movements. Each pattern has implicati<strong>on</strong>s regarding the positi<strong>on</strong><br />
of the market within its overall progressi<strong>on</strong>, past, present and future. The purpose of <strong>Elliott</strong> <strong>Wave</strong> Internati<strong>on</strong>al’s market-oriented publicati<strong>on</strong>s is to outline<br />
the progress of markets in terms of the <strong>Wave</strong> Principle and to educate interested parties in the successful applicati<strong>on</strong> of the <strong>Wave</strong> Principle. While a course<br />
of c<strong>on</strong>duct regarding investments can be formulated from such applicati<strong>on</strong> of the <strong>Wave</strong> Principle, at no time will <strong>Elliott</strong> <strong>Wave</strong> Internati<strong>on</strong>al make specific<br />
recommendati<strong>on</strong>s for any specific pers<strong>on</strong>, and at no time may a reader, caller or viewer be justified in inferring that any such advice is intended. Investing<br />
carries risk of losses, and trading futures or opti<strong>on</strong>s is especially risky because these instruments are highly leveraged, and traders can lose more than their<br />
initial margin funds. Informati<strong>on</strong> provided by <strong>Elliott</strong> <strong>Wave</strong> Internati<strong>on</strong>al is expressed in good faith, but it is not guaranteed. The market service that never<br />
makes mistakes does not exist. L<strong>on</strong>g-term success trading or investing in the markets demands recogniti<strong>on</strong> of the fact that error and uncertainty are part of<br />
any effort to assess future probabilities. Please ask your broker or your advisor to explain all risks to you before making any trading and investing decisi<strong>on</strong>s.<br />
10