Confidence Intervals Worksheet Name
Confidence Intervals Worksheet Name
Confidence Intervals Worksheet Name

You also want an ePaper? Increase the reach of your titles
YUMPU automatically turns print PDFs into web optimized ePapers that Google loves.
<strong>Confidence</strong> <strong>Intervals</strong> <strong>Worksheet</strong><br />
or… Can't find a job? Who says I want one?<br />
<strong>Name</strong>:_________________<br />
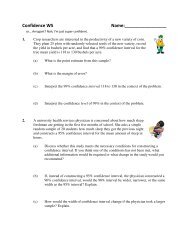
A recent poll found that “433 of the 1548 randomly-selected adults questioned felt<br />
that unemployment compensation should be extended an additional six months<br />
while the country is in the current economic downturn.” We want to use this<br />
information to construct a 95% confidence interval to estimate the proportion of<br />
the U.S. adults who feel this way.<br />
(a)<br />
State the parameter our confidence interval will estimate.<br />
(b)<br />
Identify each of the conditions that must be met to use this procedure, and explain how<br />
you know that each one has been satisfied.<br />
(c)<br />
Find the appropriate critical value and the standard error of the sample proportion.<br />
(d)<br />
Give the 95% confidence interval.<br />
(e)<br />
Interpret the confidence interval constructed in part (d) in the context of the problem.<br />
(f)<br />
Suppose you wanted to estimate the proportion of people who feel that unemployment<br />
compensation should be expanded with 95% confidence to within ± 1.5%. Calculate how<br />
large a sample you would need.<br />
(g)<br />
If you wanted to have a margin of error of ±1.5% with 99% confidence, would your<br />
sample have to be larger, smaller, or the same size as the sample in part (f)? Explain.
National Fuelsaver Corporation manufactures the<br />
Platinum Gasaver, a device they claim “may increase gas<br />
mileage by 30%.” Here are the percent changes in gas<br />
mileage for 15 identical, randomly-selected vehicles, as<br />
presented in one of the company’s advertisements:<br />
–2.4 6.9 10.4 10.8 24.8<br />
28.7 28.7 33.7 34.6 38.5<br />
40.2 44.6 46.8 46.9 48.3<br />
(a)<br />
The sample mean is ̅ = 29.43 and the sample standard deviation is s=16.23. Calculate<br />
and interpret the standard error of the mean for these data.<br />
(b)<br />
Construct and interpret a 90% confidence interval to estimate the mean change (in<br />
percent) in gas mileage. Does the data support the company’s claim? Use the four-step<br />
process. Don't forget to check your IRONS.